

Abstract
The cyanobacterial genus Acaryochloris is the only known group of oxygenic phototrophs that contain chlorophyll d rather than chlorophyll a as the major photosynthetic pigment. Studies on this organism are still in their earliest stages, and biochemical analysis has rapidly outpaced growth optimization. We have investigated culture growth of the major strains of Acaryochloris marina (MBIC11017 and MBIC10697) by using several published and some newly developed growth media. It was determined that heavy addition of iron significantly enhanced culture longevity. These high-iron cultures showed an ultrastructure with thylakoid stacks that resemble traditional cyanobacteria (unlike previous studies). These cultures also show a novel reversal in the pigment ratios of the photosystem II signature components chlorophyll a and pheophytin a, as opposed to those in previous studies.
Until recently, chlorophyll d (Chl d) was thought to be produced only by red algae (14). It has now been determined that this assumption was based on contamination of the total algal extract with cyanobacterial epiphytes (23). In fact, all Chl d-producing organisms found so far are in close association with other organisms, whether below a host ascidian (22), on the surface of a eukaryotic alga (23), or in a biofilm in the eutrophic Salton Sea (18).
This coexistence with other organisms has historically proven to be a difficult problem for microbiologists to solve, as medium compositions can never quite match the exact chemical profile of a stable environment, let alone the complexity within and around an organism. In fact, the discovery of Acaryochloris marina was a direct result of failed attempts at culturing Prochloron, a major symbiont of the colonial ascidian Lissoclinum patella (13, 21). Within its lower tunic is a large pocket of Prochloron that has not yet been successfully grown on a laboratory medium. Colonies of A. marina were instead isolated and were soon identified as a source of Chl d (22). Later studies localized this new organism underneath the host ascidian rather than within its lower tunic (13).
Initial studies and culture collection submissions of A. marina used unpurified unialgal cultures in the minimal, natural seawater medium K+ESM (Marina Biology Institute Culture collection [MBIC, Kamaishi, Japan] medium no. 8) (11, 21), as the only concern was the removal of contaminating pigments. Unfortunately, this strain was contaminated in a seemingly symbiotic manner with a small nonphotosynthetic bacterium. While the type strain (MBIC11017) grows reasonably well with its contaminant, axenic cultures of both strains MBIC11017 and MBIC10697 (the major variant strain) grow to a low cell density on an artificial seawater version of their prescribed K+ESM. Alternatively, contaminated culture growth seems to be improved on an artificial marine version of the traditional blue-green medium BG-11. However, axenic growth on marine BG-11 (MBG-11) was severely retarded. Since it is uncertain whether growth is hampered by the lack of key micronutrients in natural seawater, it is important to establish robust growth conditions on a universally available artificial seawater product.
In preparation for genetic studies on this novel organism, axenic cultures are a necessity. Unfortunately, the axenic growth level provided by K+ESM yields colonies that are much too small to perform any of the harsh selection techniques required for molecular biology. Conversely, as MBG-11 does not allow for axenic growth, we set out to construct a composite medium that could yield the growth rate of MBG-11 in the axenic colonies provided by K+ESM.
The immediate concern in changing the growth of any microorganism is the potential for altering cellular physiology or composition. To that end, high-pressure liquid chromatography (HPLC) profiles for A. marina grown under all of our growth conditions were compared. These profiles are useful in answering an important question: is the pigment composition consistent with that originally found in A. marina? Additionally, the ultrastructure of cells grown in different media was investigated using transmission electron microscopy.
MATERIALS AND METHODS
Growth conditions.
All cultures were shaken at 125 rpm under a photon irradiance of 15 to 20 μmol photons/m2 s of light at 30°C. Cultures were grown as either 2.5 ml of medium in 25-ml glass test tubes or 10 ml in 50-ml Erlenmeyer flasks. All media were prepared as published previously (7, 18, 21), using 3.2% Instant Ocean artificial sea salts (Aquarium Systems, Mentor, OH). All MGB-11 was supplemented with 20 mM N-[Tris(hydroxymethyl)methyl]-2-aminoethanesulfonic acid (TES) adjusted to pH 8.35. The 48 composite media were created by permuting the addition of 0.5×, 1×, and 2× concentrations of each of the 16 individual components of K+ESM (11, 21) into MBG-11. The medium containing 10.4 mg/liter EDTA and iron(III) monosodium salt (Fe-EDTA) added to MBG-11 is henceforth designated FeMBG-11. All cell density readings were taken at 730 nm on a Shimadzu (Kyoto, Japan) UV-160 spectrophotometer. The samples were diluted with their associated media to keep readings between 0.5 and 1.0 absorbance unit.
Culture purification.
Initial axenic growth attempts were made by first mechanically cleaning cultures (strains MBIC11017 and MBIC10697). A concentrated cell suspension was sonicated four to six times for 45 s each with a 50% duty cycle and output of 4 on a Branson (Danbury, CT) Sonifier 350. This step selectively destroyed most of the contaminating bacteria, as we observed that A.marina cells were resistant to destruction by sonication. Next, the cells were pumped onto a 1.2-μm Acrodisc syringe filter (Pall, East Hills, NY) several times to remove the smaller contaminating bacteria. The A. marina cells were then resuspended in fresh, sterile MBG-11 medium. The process was repeated until contamination was decreased by ∼95% as determined by cell counting using phase-contrast microscopy.
High-pressure liquid chromatography.
Cell samples were centrifuged in an Eppendorf (Hamburg, Germany) 5415 D centrifuge at 15,000 × g for 60 s. Pigment extraction was accomplished by suspending the resulting pellets in 7:3 acetone-methanol and incubating for 2 min on ice in the dark, after which the suspension was centrifuged again for 60 s to remove particulates. The supernatant was analyzed by reversed-phase HPLC using a 4.6- by 150-mm, 5-μm Agilent XDB-C18 column on an Agilent (Palo Alto, CA) 1100 series. Column gradients were run from 85% to 95% acetone versus water for 30 min. Extinction coefficients for chlorophyll a and pheophytin a were adapted from those described by Watanabe et al. (27). Chlorophyll d purified by HPLC was dried in a speed vacuum in the dark. The dried sample was weighed, and two equal masses were resuspended, one in 80% acetone and one in diethyl ether. The absorption spectra of both samples and the extinction coefficient of 98,600 mol−1 cm−1 at 696 nm in ether (8) were used to derive the 80% acetone extinction coefficient.
Cell fixation.
For glutaraldehyde-osmium tetroxide fixation, cells were simultaneously fixed in their growth medium with aqueous 1% glutaraldehyde and aqueous 1% osmium tetroxide. For glutaraldehyde-potassium permanganate fixation, cells were chemically fixed in 1% glutaraldehyde for 45 min. Cells were then centrifuged for 4 min at 4,000 × g. The resulting pellet was rinsed three times (10 min each) with sodium cacodylate buffer (pH 7.4). As a secondary fixative, KMnO4 was added to a final concentration of 1% and incubated for 15 min.
Potassium permanganate and osmium tetroxide samples were centrifuged for 4 min at 4,000 × g. The resulting pellet was rinsed three times (10 min each) with sodium cacodylate buffer (pH 7.4). The sample was then dehydrated in a series of acetone concentrations (25%, 50%, 75%, and 100% for 10 min), with a final 30-min rinse in 100% acetone. The sample was then infiltrated in increasing concentrations of Spurr's resin (25%, 50%, 75%, and 100% for 8 h each), followed by an 8-h infiltration into 100% Spurr's resin. Finally, samples were polymerized for 24 h at 70°C.
Sectioning and imaging.
Samples were sectioned (∼60-nm thickness) on a Leica Ultracut R ultramicrotome (Leica, Wetzlar, Germany) and contrasted with uranyl acetate (5 min) and Reynold's lead citrate (5 min) (24). The thin sections were imaged on a Philips CM 12 microscope (FEI, Hillsboro, OR) at 80 kV.
RESULTS
Growth tests.
The 48 composite media were inoculated with mechanically purified MBIC11017 cells to an initial A730 of ∼0.5. Out of all components, only Fe-EDTA significantly altered growth performance (Fig. 1). Growth with this addition even exceeded that of the positive control (contaminated cell stocks). The average of the growth curves for every other addition of each K+ESM component was actually lower than that of the negative control (Fig. 1). This growth suppression is likely due to the toxicity of higher concentrations of some of these components.
FIG. 1.

A. marina MBIC11017 growth in the 48 composite media (MBG-11 supplemented with 0.5×, 1×, or 2× concentrations of each K+ESM component). The positive control (CTRL+) was inoculated with contaminated culture stocks and the negative control (CTRL−) with mechanically cleaned cells (as described in Materials and Methods). Both control cultures were grown on standard MBG-11. All 48 test cultures were inoculated with mechanically cleaned cells. The Fe-EDTA additions are labeled relative to K+ESM concentration (0.5× and 2×). The “Average” line represents all growth curves that show no significant features (n = 46). The y-axis absorbance (a.u.) was taken at 730 nm.
Using this information, cultures of both MBIC11017 and MBIC10697 were purified axenically using 1% agar MBG-11 plates supplemented with relative 2× Fe-EDTA (10.4 mg/liter). Upon subsequent growth in liquid medium, these two strains showed a significant difference in doubling time (Fig. 2). The type strain MBIC11017 appears to have a doubling time of anywhere between 45 h (Fig. 1) and 60 h (Fig. 2), as is evident by its divergent error bars. Conversely, strain MBIC10697 grows more consistently at a doubling time of 70 to 75 h (Fig. 2 and data not shown).
FIG. 2.

Growth rate comparison of the two major A. marina strains (n = 4 for each line), both axenic, grown on FeMBG-11. Doubling times as shown are ∼55 h for MBIC11017 and ∼70 h for MBIC10697. Error bars indicate standard deviations.
Axenic cultures grew quite differently in each of the three published medium types (Fig. 3). Similar to the mechanically cleaned cells from Fig. 1, none of these axenic cultures grew much beyond an A730 of 1.0. In fact, late-phase cell density often decreased with prolonged incubation (Fig. 3). This effect seems to be alleviated in the high-iron FeMBG-11 medium (Fig. 3). Culture pH was checked throughout growth, as it was suspected that an increasing pH might account for cell death. Surprisingly, the only cultures with a significant change in pH were those grown on FeMBG-11, all of which rose more than 1 pH unit. As in the composite medium studies (Fig. 1.), only the Fe-EDTA-containing media yielded exponential growth curves.
FIG. 3.

Growth comparison of axenic A. marina MBIC11017 in different standard media (n = 5 for each line). All media are based on published recipes, with the exception of FeMBG-11, which is described herein. The y-axis absorbance (a.u.) was taken at 730 nm. Error bars indicate standard deviations.
HPLC.
Pigment ratios calculated from HPLC peak areas are shown in Table 1. Chl d values were calculated using an extinction coefficient (ɛ) in 80% acetone. The ɛ at 690.5 nm of 84,100 mol−1 cm−1 was converted to the 420-nm ɛ of 45,200 mol−1 cm−1 for use with HPLC profiles.
TABLE 1.
HPLC quantification of pigment ratios of A. marina MBIC11017 cells
| Pigments | Ratio in the indicated mediuma
|
|
|---|---|---|
| Iron rich | Iron free | |
| Chl d/Chl a | 62.1 ± 2.3 | 53.1 ± 7.6 |
| Chl d/Chl d′ | 89.5 ± 24.4 | 44.4 ± 1.3 |
| Chl d/Phe a | 42.1 ± 1.6 | 74.3 ± 0.1 |
| Chl a/Phe a | 0.68 ± 0.04 | 1.43 ± 0.22 |
| Chl d′/Phe a | 0.50 ± 0.12 | 1.67 ± 0.05 |
| Chl a/Chl d′ | 1.44 ± 0.39 | 0.85 ± 0.14 |
| PSII/PSI | 1.07 ± 0.31 | 0.30 ± 0.01 |
Cells were grown on an extra-2× Fe-EDTA (iron-rich) medium (n = 9) and on a no-iron (iron-free) medium (n = 3). PSI and PSII concentrations were calculated from one Chl d′ molecule per PSI and two Phe a molecules per PSII. Errors shown are standard deviations.
Cultures grown on high- and low-iron media produced fairly similar HPLC profiles, as seen in Table 1. Most pigment ratios match those seen previously (1, 19). However, the Chl a/pheophytin a (Phe a) ratio of 0.68 in Fe-EDTA-enriched cultures (iron rich), was always inverted from published data (1, 19). Conversely, the iron-free culture Chl a/Phe a ratio is consistent with published data (1, 19).
All ratios involving Chl d′, the major epimer of Chl d, exhibit high standard deviations. Throughout separate HPLC trials, the Chl d′ varied independently of all other pigments, likely due to the relatively rapid degradation/epimerization of Chl d (27). This high standard deviation could be reduced by half with the removal of two replicates, which would more closely match the same occurrence seen by Akiyama et al. (1). Thus, calculation of photosystem I (PSI) concentration based on one Chl d′ and of photosystem II (PSII) concentration based on two Phe a (from the assumptions of Akiyama et al. [1]) yields a very large error (Table 1), upwards of 25%.
Electron microscopy.
Electron micrographs of cells grown in concert with their bacterial contaminant (Fig. 4A and B) showed a morphology that was quite different from that in published work (10, 15, 18, 21, 22). While the overall structure of the cells (i.e., cell size and major features) remains consistent with previous work, the layout of the photosynthetic apparatus is distinctly different. As seen in Fig. 4A, the thylakoids are evenly spaced along the periphery, rather than appressed (stacked), as seen previously. The individual membranes are spaced anywhere from 20 to 35 nm apart, with occasional constriction near the ends and “corners” of the cell, where the thylakoid membranes often pinch together (Fig. 4B). This even spacing translates to a full thylakoid width of 150 to 250 nm based on the number and spacing of the individual membranes. Cells grown axenically on higher levels of iron (Fig. 5D) look similar to those shown in Fig. 4 but generally contain a lesser complement of widely spaced thylakoids.
FIG. 4.
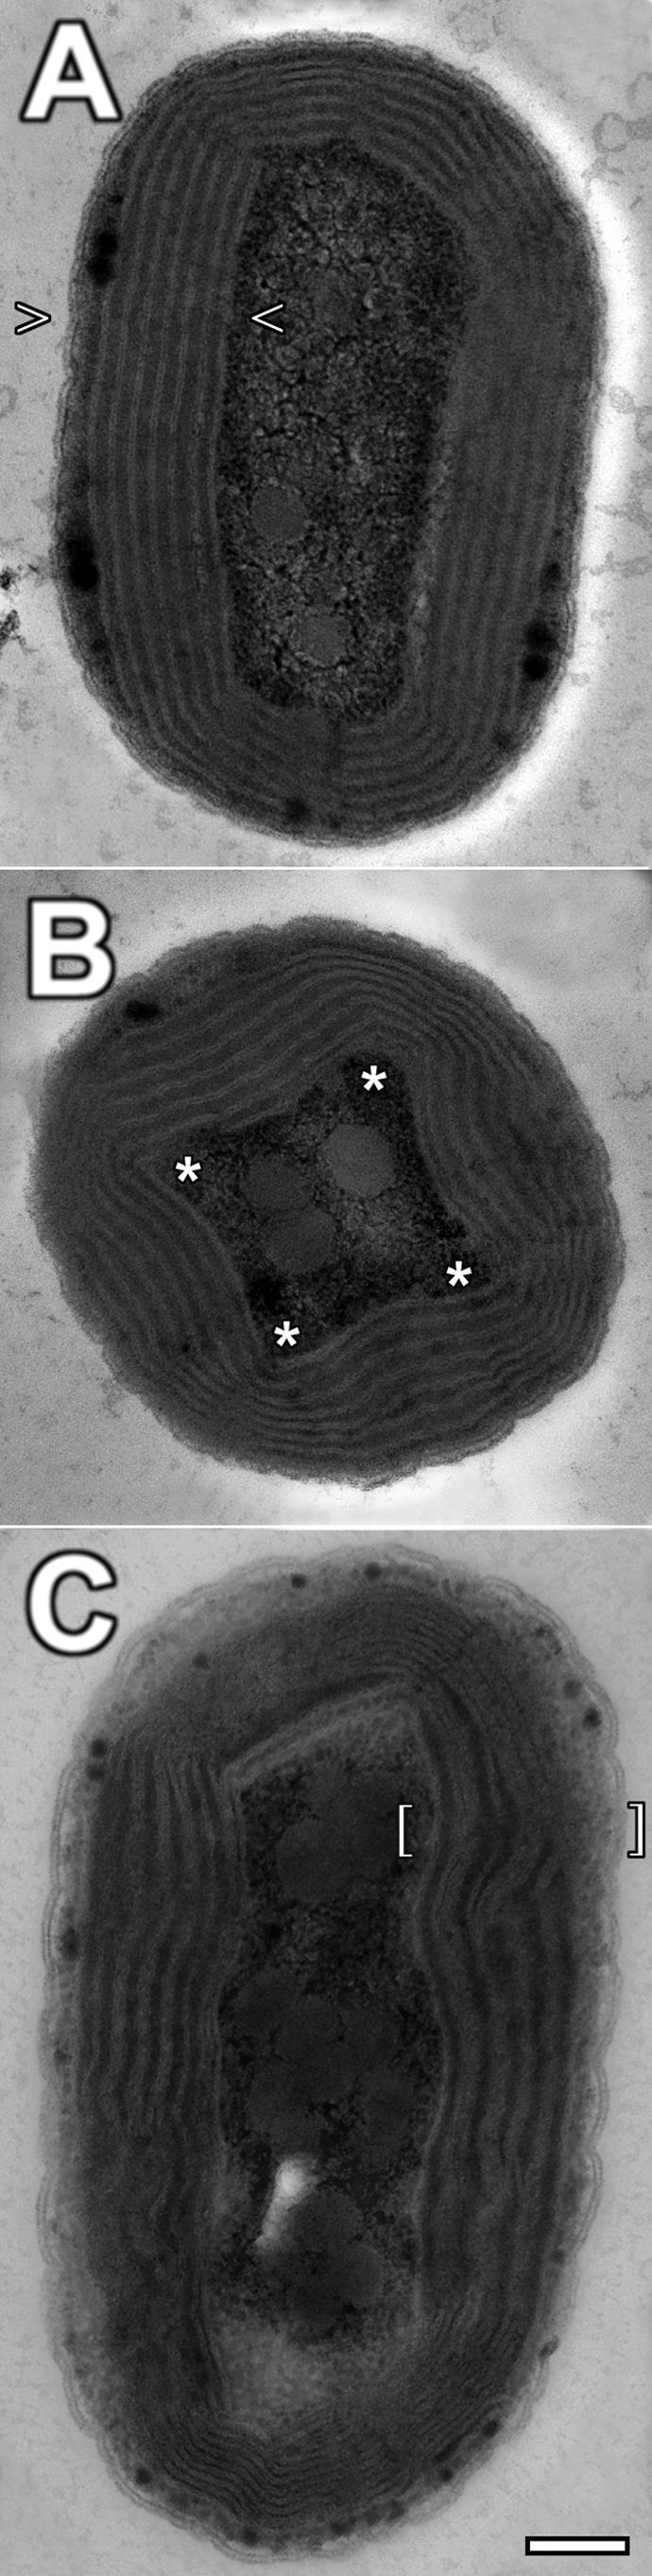
Full cell electron micrographs of A. marina MBIC11017 cells fixed with osmium tetroxide. Cells grown with their contaminating bacteria on MBG-11 (A and B) have thylakoids which are ubiquitously evenly spaced by an electron-dense material (arrowheads). When seen in cross-section, cells often have thylakoid membranes that are pinched into “corners” (asterisks). Cells grown axenically on MBG-11 with no iron (C) have only sparse areas of electron-dense material spacing thylakoids which are generally appressed (brackets).
FIG. 5.

Electron micrographs of axenic A. marina MBIC11017 cells grown in different published media fixed with potassium permanganate. Cells grown on K+ESM (A), modified K (B), and MBG-11 (C) all have erratically spaced thylakoid membranes. Most thylakoids seen in these cells were appressed peripherally, with interspersed areas of electron-dense, interthylakoid space. Cells grown on FeMBG-11 (D) have thylakoids which are evenly spaced, with a ∼20-nm gap of electron-dense material separating them.
Cells grown on K+ESM, modified K, and MBG-11 look more similar to published micrographs (Fig. 5A, B, and C, respectively). The interspersed wide gaps and closely appressed membranes seen in these cells contrast sharply with the morphology of cells grown under higher-iron conditions (Fig. 5D). Furthermore, a micrograph of a sample of cells taken from day 3 of iron-free growth (Fig. 4C), at which point cell density was still increasing, is very similar to the micrographs presented by Hu et al. (10).
DISCUSSION
Under the growth conditions described in this paper, the Acaryochloris marina type strain can double no faster than every 40 to 50 h, whether with its contaminant or axenically supplemented with Fe-EDTA. This long doubling time is further exacerbated by cultures that cannot grow past a limited density, which presents challenges for molecular research that requires healthy cultures. However, we illustrate that log growth was extended considerably by providing A. marina cells with a seemingly excessive amount of iron. This will be useful for harvesting a large mass of cells for biochemical analysis. Additionally, this dense culture mimics conditions that exist in a large colony on solid medium plates. Solid medium growth has been vital to axenic isolation of several additional Acaryochloris strains, a task that had failed continuously on plain MBG-11.
At this point, the reasons behind A. marina's dependence on iron are open for speculation. There is evidence that ascidians accumulate iron inside their cells (26). Even though A. marina is found underneath the host organism (13), its local environment is likely to be iron enriched. Such growth conditions could certainly lead to a loss of a reliable iron uptake and scavenging system, unlike the case for open-ocean bacteria that rely on iron recycling. Comparisons of growth with high levels of ferric ammonium citrate instead of Fe-EDTA showed no significant differences; however, long-term cultures tended to be healthier in Fe-EDTA (data not shown). This seems to argue against any EDTA chelating effect, but it does not rule it out.
Previous work has used a Chl a/Phe a ratio of >1 as evidence for Chl a as the primary electron donor of PSII (1, 19), assuming two Phe a molecules per PSII reaction center. However, there is a striking difference between the Chl a/Phe a ratio presented here and that seen previously. The Chl a/Phe a ratio of 0.68 for iron-rich cultures is significantly less than the ratio of 1.5 to 2.3 that had been observed previously (1, 19), while the iron-free culture ratio of 1.43 closely matches that range. This finding does not support the proposal that PSII contains two or more Chl a molecules along with two Phe a molecules (2-4, 12, 19, 20) and is inconsistent with the suggestion that the minimum Chl a/Phe a ratio is 1 (12, 19). Furthermore, the variability of the Chl a/Phe a ratio versus growth conditions shows that the Chl a level changes independently of PSII concentration, suggesting that a large portion of cellular Chl a is not associated with PSII.
The cells grown without iron also have relatively high levels of Chl d′ compared to high-iron grown cells. At this time there is no feasible way of determining whether this is because of incidental Chl d epimerization or true stoichiometric adjustment of the photosystems. The high variations in chlorophyll epimerization that have been reported (28) suggest that the quantitative use of Chl d′ as a measure of PSI (1) is inappropriate.
The electron micrographs further stress the importance of iron for the photosynthetic apparatus. The appressed membranes seen in iron-stressed cells (Fig. 4C and 5A to C) remarkably resemble those pictured in previously published work (10, 15, 17, 18, 22). The electron-dense material between the thylakoid membranes was previously identified as phycobiliproteins (10). Earlier works have described the down-regulation of phycobiliproteins, specifically phycocyanin, under iron stress (9, 25). It follows that the electron-dense areas would be minimal in iron-free cells (Fig. 4C) and, conversely, prevalent in iron-rich cells (Fig. 4A and B). A similar thylakoid/phycobiliprotein depression effect was shown by Marquardt et al. (16). We suggest that all previous studies of A. marina have been conducted on iron-stressed cultures. This work shows that this stress not only has an effect on the biochemical properties of A. marina but also has a large effect on cell physiology.
We show here that the use of high iron concentrations during A. marina growth results in robust, dense cultures. Investigation of this iron dependence could help elucidate the many questions about iron stress in cyanobacteria that still exist. The number of effects produced by iron stress, some of which are described above, could be significant enough to affect experimental results. Certainly, the changes in whole-cell chlorophyll composition shown here could have a large effect on pigment compositions of isolated photosynthetic components. Furthermore, it is tempting to speculate whether the prochlorophyte PSI Pcb proteins (relatives of the cyanobacterial iron stress-induced Isi proteins) described by Chen et al. (6) were all at one time induced under low-iron conditions (5). Evidence for this evolution, along with the presence or absence of ferric uptake and regulation genes, should be illuminated when the A. marina genome sequencing is completed (http://genomes.tgen.org).
Acknowledgments
We thank A. Telfer of the Imperial College, London, and A. Larkumand M. Chen of the University of Sydney for helpful discussions. Strain MBIC10697 was graciously provided by M. Mimuro and H. Miyashita of Kyoto University.
This work was supported by NASA Exobiology program award no. NNG04GK59G.
REFERENCES
- 1.Akiyama, M., T. Gotoh, H. Kise, H. Miyashita, M. Mimuro, and M. Kobayashi. 2004. Stoichiometries of chlorophyll d′/PSI and chlorophyll a/PSII in a chlorophyll d-dominated cyanobacterium Acaryochloris marina. Jpn. J. Phycol. 52:67-72. [Google Scholar]
- 2.Akiyama, M., H. Miyashita, H. Kise, T. Watanabe, M. Mimuro, S. Miyachi, and M. Kobayashi. 2002. Quest for minor but key chlorophyll molecules in photosynthetic reaction centers—unusual pigment composition in the reaction centers of the chlorophyll d-dominated cyanobacterium Acaryochloris marina. Photosyn. Res. 74:97-107. [DOI] [PubMed] [Google Scholar]
- 3.Akiyama, M., H. Miyashita, H. Kise, T. Watanabe, S. Miyachi, and M. Kobayashi. 2001. Detection of chlorophyll d′ and pheophytin a in a chlorophyll d-dominating oxygenic photosynthetic prokaryote Acaryochloris marina. Anal. Sci. 17:205-208. [DOI] [PubMed] [Google Scholar]
- 4.Boichenko, V. A., V. V. Klimov, H. Miyashita, and S. Miyachi. 2000. Functional characteristics of chlorophyll d-predominating photosynthetic apparatus in intact cells of Acaryochloris marina. Photosyn. Res. 65:269-277. [DOI] [PubMed] [Google Scholar]
- 5.Chen, M., T. Bibby, J. Nield, A. Larkum, and J. Barber. 2005. Iron deficiency induces a chlorophyll d-binding Pcb antenna system around photosystem I in Acaryochloris marina. Biochim. Biophys. Acta 1708:367-374. [DOI] [PubMed]
- 6.Chen, M., T. S. Bibby, J. Nield, A. W. D. Larkum, and J. Barber. 2005. Structure of a large photosystem II supercomplex from Acaryochloris marina. FEBS Lett. 579:1306-1310. [DOI] [PubMed] [Google Scholar]
- 7.Chen, M., R. G. Quinnell, and A. W. Larkum. 2002. The major light-harvesting pigment protein of Acaryochloris marina. FEBS Lett. 514:149-152. [DOI] [PubMed] [Google Scholar]
- 8.French, C. S. 1960. The chlorophylls in vivo and in vitro, vol. V/1. Springer-Verlag, Berlin, Germany.
- 9.Guikema, J. A., and L. A. Sherman. 1983. Organization and function of chlorophyll in membranes of cyanobacteria during iron starvation. Plant Physiol. 73:250-256. [DOI] [PMC free article] [PubMed] [Google Scholar]
- 10.Hu, Q., J. Marquardt, I. Iwasaki, H. Miyashita, N. Kurano, E. Morschel, and S. Miyachi. 1999. Molecular structure, localization and function of biliproteins in the chlorophyll a/d containing oxygenic photosynthetic prokaryote Acaryochloris marina. Biochim. Biophys. Acta 1412:250-261. [DOI] [PubMed] [Google Scholar]
- 11.Keller, M. D., R. C. Selvin, W. Claus, and R. R. L. Guillard. 1987. Media for the culture of oceanic ultraphytoplankton. J. Phycol. 23:633. [Google Scholar]
- 12.Kobayashi, M., S. Watanabe, T. Gotoh, H. Koizumi, Y. Itoh, M. Akiyama, Y. Shiraiwa, T. Tsuchiya, H. Miyashita, M. Mimuro, T. Yamashita, and T. Watanabe. 2005. Minor but key chlorophylls in photosystem II. Photosyn. Res. 84:201-207. [DOI] [PubMed] [Google Scholar]
- 13.Kühl, M., M. Chen, P. J. Ralph, U. Schreiber, and A. W. D. Larkum. 2005. A niche for cyanobacteria containing chlorophyll d. Nature 433:820. [DOI] [PubMed] [Google Scholar]
- 14.Manning, W. M., and H. H. Strain. 1943. Chlorophyll d, a green pigment of red algae. J. Biol. Chem. 151:1-19. [Google Scholar]
- 15.Marquardt, J., E. Morschel, E. Rhiel, and M. Westermann. 2000. Ultrastructure of Acaryochloris marina, an oxyphotobacterium containing mainly chlorophyll d. Arch. Microbiol. 174:181-188. [DOI] [PubMed] [Google Scholar]
- 16.Marquardt, J., A. Schultze, V. Rosenkranz, and W. Wehrmeyer. 1999. Ultrastructure and photosynthetic apparatus of Rhodella violacea (Porphyridiales, Rhodophyta) grown under iron-deficient conditions. Phycology 38:418-427. [Google Scholar]
- 17.Marquardt, J., H. Senger, H. Miyashita, S. Miyachi, and E. Morschel. 1997. Isolation and characterization of biliprotein aggregates from Acaryochloris marina, a Prochloron-like prokaryote containing mainly chlorophyll d. FEBS Lett. 410:428-432. [DOI] [PubMed] [Google Scholar]
- 18.Miller, S. R., S. Augustine, T. L. Olson, R. E. Blankenship, J. Selker, and A. M. Wood. 2005. Discovery of a free-living chlorophyll d-producing cyanobacterium with a hybrid proteobacterial/cyanobacterial small-subunit rRNA gene. Proc. Natl. Acad. Sci. USA 102:850-855. [DOI] [PMC free article] [PubMed] [Google Scholar]
- 19.Mimuro, M., S. Akimoto, T. Gotoh, M. Yokono, M. Akiyama, T. Tsuchiya, H. Miyashita, M. Kobayashi, and I. Yamazaki. 2004. Identification of the primary electron donor in PS II of the Chl d-dominated cyanobacterium Acaryochloris marina. FEBS Lett. 556:95-98. [DOI] [PubMed] [Google Scholar]
- 20.Mimuro, M., S. Akimoto, I. Yamazaki, H. Miyashita, and S. Miyachi. 1999. Fluorescence properties of chlorophyll d-dominating prokaryotic alga, Acaryochloris marina: studies using time-resolved fluorescence spectroscopy on intact cells. Biochim. Biophys. Acta 1412:37-46. [DOI] [PubMed] [Google Scholar]
- 21.Miyashita, H., K. Adachi, N. Kurano, H. Ikemoto, M. Chihara, and S. Miyachi. 1997. Pigment composition of a novel oxygenic photosynthetic prokaryote containing chlorophyll d as the major chlorophyll. Plant Cell Physiol. 38:274-281. [Google Scholar]
- 22.Miyashita, H., H. Ikemoto, N. Kurano, K. Adachi, M. Chihara, and S. Miyachi. 1996. Chlorophyll d as a major pigment. Nature 383:402. [Google Scholar]
- 23.Murakami, A., H. Miyashita, M. Iseki, K. Adachi, and M. Mimuro. 2004. Chlorophyll d in an epiphytic cyanobacterium of red algae. Science 303:1633. [DOI] [PubMed] [Google Scholar]
- 24.Reynolds, E. S. 1963. The use of lead citrate at high pH as an electron-opaque stain in electron microscopy. J. Cell Biol. 17:208-212. [DOI] [PMC free article] [PubMed] [Google Scholar]
- 25.Sandmann, G. 1985. Consequences of iron deficiency on photosynthetic and respiratory electron transport in blue-gree algae. Photosyn. Res. 6:261-271. [DOI] [PubMed] [Google Scholar]
- 26.Stoecker, D. 1980. Chemical defenses of ascidians against predators. Mar. Ecol. Prog. Ser. 3:257-265. [Google Scholar]
- 27.Watanabe, T., A. Hongu, and K. Honda. 1984. Preparation of chlorophylls and pheophytins by isocratic liquid chromatography. Anal. Chem. 56:251-256. [Google Scholar]
- 28.Watanabe, T., H. Mazaki, and M. Nakazato. 1987. Chlorophyll a/a′ epimerization in organic solvents. Biochim. Biophys. Acta 892:197-206. [Google Scholar]