

Abstract
Little is known about the overall patterns of thyroid hormone (Th)-mediated gene regulation by the main Th receptor (Tr) isoforms, Tr-α and Tr-β, in vivo. We used 48 complementary DNA microarrays to examine hepatic gene expression profiles of wild-type and Thra and Thrb knockout mice under different Th conditions: no treatment, treatment with 3,3′,5-triiodothyronine (T3), Th-deprivation using propylthiouracil (PTU), and treatment with a combination of PTU and T3. Hierarchical clustering analyses showed that positively regulated genes fit into three main expression patterns. In addition, only a subpopulation of target genes repressed basal transcription in the absence of ligand. Interestingly, Thra and Thrb knockout mice showed similar gene expression patterns to wild-type mice, suggesting that these isoforms co-regulate most hepatic target genes. Differences in the gene expression patterns of Thra/Thrb double-knockout mice and Th-deprived wild-type mice show that absence of receptor and of hormone can have different effects. This large-scale study of hormonal regulation reveals the functions of Th and of Tr isoforms in the regulation of gene expression patterns.
Introduction
3,3′,5-Triiodothyronine (T3), the active thyroid hormone (Th) metabolite of thyroxine (T4), affects differentiation, growth and cellular metabolism. It binds to two Th receptor (Tr) isoforms, Tr-α and Tr-β, which are encoded by separate genes (Thra and Thrb) and mediate Th-regulated gene expression by binding to Th response elements (TREs) in the promoter regions of target genes (Yen, 2001).
In the absence of Th, Trs recruit co-repressor complexes (for example, nuclear corepressor (NCoR) and silencing mediator of Tr and retinoic acid receptor (Smrt)) that lead to the histone deacetylation of local chromatin in the promoter region, and decrease the basal transcription of positively regulated target genes (Burke & Baniahmad, 2000). In the presence of Th, Trs recruit co-activator complexes that contain the p160 steroid-receptor co-activator (SRC) family members and other cofactors that have histone acetyltransferase activity, as well as other complexes that can associate with the RNA polymerase II complex (Yen, 2001; Zhang & Lazar, 2000). The overall effect of these ligand-dependent interactions is to promote the transcriptional activation of positively regulated target genes. Trs also negatively regulate target genes, but the molecular mechanism by which they do this is poorly understood (Yen, 2001).
Recent studies have shown that Thra and Thrb knockout mice have different phenotypes, and have also suggested that different Tr isoforms may have distinct roles (Flamant & Samarut, 2003; Forrest & Vennstrom, 2000). Two groups have generated Thra knockout mice that have distinct phenotypes (Flamant & Samarut, 2003; Forrest & Vennstrom, 2000). This was due to the targeting of different loci for homologous recombination, which resulted in the loss of different combinations of Tr-α isoforms. Thra knockout mice that lack all Tr-α isoforms (Thra0/0 ), including short Tr-α isoforms that are generated by internal transcription initiation, are viable and fertile, and have a mild phenotype (Gauthier et al., 2001; Macchia et al., 2001).
Thrb knockout mice have elevated thyroid-stimulating hormone (Tsh) and Th levels in their serum, thyroid gland hyperplasia, and a hearing defect (Forrest et al., 1996; Gauthier et al., 1999). Thra/Thrb double-knockout mice have also been generated and, surprisingly, survive, showing that the presence of Trs is not essential for viability (Gauthier et al., 1999; Gothe et al., 1999). Although these mice show extreme Th resistance, they do not display the severe, lethal phenotype seen in mice that are congenitally deficient for Th (Flamant et al., 2002).
Complementary DNA microarray analysis is a powerful tool for studying hormonal effects on gene regulation on a genomic scale as it allows the simultaneous measurement and comparison of the messenger RNA expression levels of thousands of genes (Meltzer, 2001). Recently, cDNA microarrays have been used to study the hormonal regulation of gene expression, including that by Trs (Meltzer, 2001; Feng et al., 2000; Miller et al., 2001; Flores-Morales et al., 2002). Previously, we used cDNA microarrays to study hepatic gene profiles in hypothyroid and hyperthyroid mice, and we identified more than 50 target genes, which are involved in a range of cellular pathways (Feng et al., 2000). To examine the effects of Th and of Tr isoforms on target-gene transcription patterns, we carried out a largescale cDNA microarray study to examine hepatic gene expression in wild-type, Thra knockout, Thrb knockout and Thra/Thrb double knockout mice at various levels of Th (Fig. 1).
Figure 1.
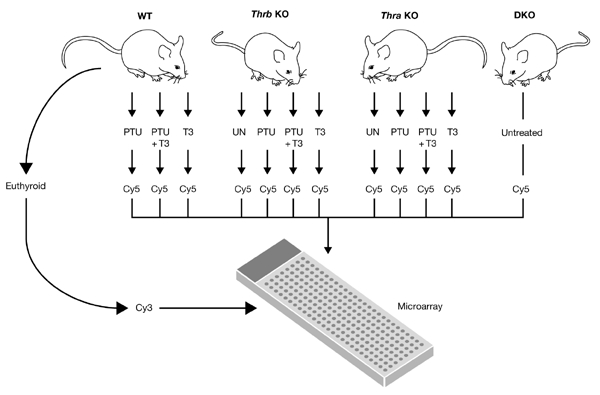
Experimental design. Hepatic RNA was harvested from mice of the genotypes indicated under various conditions of thyroid hormone (Th) treatment. Each RNA was compared to the same reference RNA pool, which was prepared from euthyroid wild-type (WT) mice. Each experiment was repeated using three or four mice. DKO, double knockout of the thyroid hormone receptor (Tr) genes Thra and Thrb; KO, knockout; PTU, propylthiouracil; T3, 3,3′,5-triiodothyronine; UN, untreated.
Results and Discussion
Identification and clustering of T3-regulated genes
Hepatic RNA from mice treated with propythiouracil (PTU) and T3, or treated with T3 alone, was compared to hepatic RNA from euthyroid wild-type mice (Figs 2,3). From this comparison, 64 probes that corresponded to 57 genes increased by greater than 1.5-fold, and 34 probes corresponding to 30 genes decreased by at least 60% when compared to wild-type euthyroid mRNA expression. Similar to earlier studies, T3 had transcriptional effects on a diverse group of genes, which are involved in lipogenic, metabolic, secretory, signalling and structural functions in the cell (Feng et al., 2000; Flores-Morales et al., 2002). We previously showed that there is a high level of correlation between cDNA microarrays and northern blot analyses in determining the expression of several target genes (Feng et al., 2000).
Figure 2.
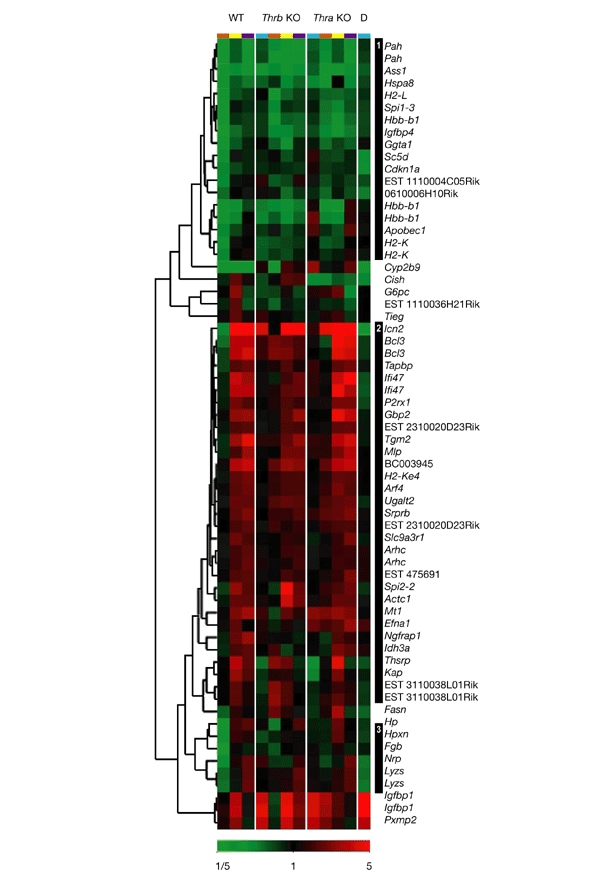
Hierarchical clustering of genes that are positively regulated by thyroid hormone in thyroid-hormone-deprived and thyroid-hormone-treated wild-type and knockout mice. Samples are clustered and are presented in the same order as in Fig. 1. Expression ratios are colour-coded according to the scale at the bottom of the figure. Clusters of interest are numbered and are indicated by the black bars on the right. The conditions used are indicated by the colour coding at the top of each column as follows: turquoise, untreated; brown, treated with propylthiouracil (PTU); yellow, treated with 3,3′,5-triiodo-thyronine (T3) and PTU; purple, treated with T3 only. Genotypes are indicated above the colour codes. D, double knockout of the thyroid hormone receptor (Tr) genes Thra and Thrb; KO, knockout; WT, wild type.
Figure 3.
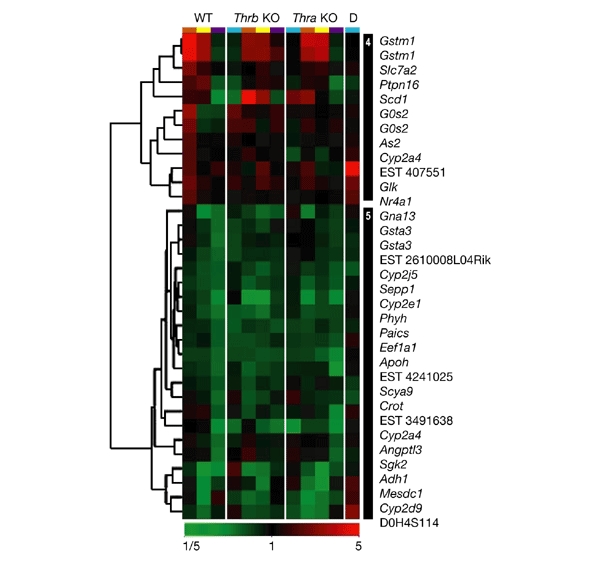
Hierarchical clustering of genes that are negatively regulated by thyroid hormone in thyroid hormone-deprived and thyroid-hormone-treated wild-type and knockout mice. Expression ratios are colour-coded according to the scale at the bottom of the figure. Clusters of interest are numbered and are indicated by the black bars on the right. The conditions used are indicated by the colour coding at the top of each column as follows: turquoise, untreated; brown, treated with propylthiouracil (PTU); yellow, treated with 3,3′,5-triiodothyronine (T3) and PTU; purple, treated with T3 only. Genotypes are indicated above the colour codes. D, double knockout of the thyroid hormone receptor (Tr) genes Thra and Thrb; KO, knockout; WT, wild type.
We performed hierarchical clustering of the target genes on the basis of the total gene expression pattern in wild-type mice. The clustering patterns were determined from data obtained from three or four individual mice for each hormonal condition. Duplicate measurements for several target genes on the microarrays showed excellent concordance in the clustering analyses, showing high reproducibility between the studies. In addition, each cluster had 5–27 target genes that shared a similar transcriptional pattern, providing internal validation for the existence of these patterns. No subsets based on function or cell-signalling pathways were found within a given cluster.
Transcription patterns of positively regulated target genes
Among the 57 positively regulated genes, 3 general patterns were seen (Fig. 2). First, some positively regulated target genes showed a 'classical' pattern of basal repression during Th deprivation, and transcriptional activation after acute treatment with T3 (cluster 3, Fig. 2; and lipocalin 2 (lcn2), B-cell leukaemia lymphoma 3 (Bcl3) and TAP-binding protein (Tapbp) in cluster 2, Fig. 2; Burke & Baniahmad, 2000; Yen, 2001; Zhang & Lazar, 2000). These genes, therefore, underwent continuous transcriptional regulation from Th deprivation to Th excess. Second, other target genes showed little or no basal repression during Th deprivation, but showed strong transcriptional activation after T3 treatment (most genes in cluster 2). These genes underwent most of their transcriptional regulation in the presence of an excess of TH. Thus, not all positively regulated target genes show basal repression in the absence of Th. As these genes were not repressed in the unliganded state, it is possible that some target genes do not recruit, or only weakly recruit, co-repressors in the absence of hormone. Alternatively, some genes may achieve homeostasis during the prolonged period of PTU treatment through the action of other positively acting transcription factors that overcome the repressive effect of unliganded Tr. Third, yet another subset of target genes showed basal repression in the absence of Th, but showed little activation after acute T3 administration (cluster 1, Fig. 2), suggesting that most of their activation occurred in the subphysiological range of Th concentration. It is possible that derepression with loss of co-repressor binding to Tr, and/or recruitment of co-activators by Tr at low T3 concentrations, may have important functions in the regulation of some of these target genes.
Genes in cluster 1 showed strong repression with PTU treatment and showed no induction or only modest induction after six hours. Although it is possible that PTU itself may have had effects on transcription, it is likely that some of these genes had delayed induction by T3. T3-responsive genes have variable kinetics of induction by T3 (Feng et al., 2000; Weiss et al., 1998), and as we measured T3 responses at a single timepoint, genes that show a relative delay of induction would fall into cluster 1. Indeed, in timecourse studies, we observed that several genes in this cluster, such as phenylalanine hydroxylase (Pah), arginosuccinate synthetase (Ass1), and insulin-like-growth-factor-binding protein 4 (Igfbp4), showed maximal induction 12–48 hours after T3 treatment (P.S.M. and S.R., unpublished data). We speculate that some genes that show strong basal repression in the absence of Th (Fig. 2, cluster 1) are induced later than genes that show little basal repression in the absence of ligand (Fig. 2, clusters 2 and 3).
Transcription patterns of negatively regulated target genes
Negatively regulated target genes showed two main transcription patterns (Fig. 3). In some cases, gene expression was increased by Th deprivation and decreased by T3 treatment (Fig. 3, cluster 4). This 'classical' pattern of ligand-independent activation and ligand-dependent negative regulation has been seen previously for several other target genes, such as thyrotropin releasing hormone (Trh), α-glycoprotein hormone subunit and thyroid stimulating hormone-β (Tshb; Hollenberg et al., 1995; Tagami et al., 1997). Most target genes, however, showed no induction in the absence of Th, but showed negative regulation with T3 treatment (Fig. 3, cluster 5). In addition, several genes were induced by treatment with PTU, or with PTU and T3 (Fig. 3, cluster 4), which could be due to delayed negative regulation by T3 or effects of PTU.
Transcription patterns of Thra and Thrb knockout mice
Gene expression patterns of positively regulated target genes were similar in Thra knockout, Thrb knockout and wild-type mice (Fig. 2; clusters 1–3, particularly cluster 2). In most cases, the T3-dependent induction of target genes was lower in the Thrb knockout mice than in the Thra knockout mice, which is consistent with the observation that most Tr expressed in the liver is Tr-β (Schwartz et al., 1992). In addition, the size of the transcriptional response to T3 was smaller in Thrb knockout mice than in wild-type mice for almost all positively and negatively regulated target genes (Fig. 4). Furthermore, no clusters of target genes that are selectively activated by either Tr isoform were identified. Flores-Morales et al. recently performed microarray analyses of hepatic genes in wild-type and Thrb knockout mice that were treated with T3. They found that 155 hepatic genes were regulated after treatment for 2 h with T3 in wild-type mice, whereas only 84 hepatic genes were regulated in Thrb knockout mice under the same conditions (Flores-Morales et al., 2002). They hypothesized that some of these effects could be due to Tr-β-isoformspecific effects. Although it is possible that differences in mice strains and the time of measurement of gene expression profiles contribute to the differences between their data and ours, our data for both the Thrb knockout and Thra knockout mice suggest that Tr isoform-specific regulation of target genes is rare. Therefore, the amount of receptor, rather than isoform type, may be the primary determinant for controlling most T3-regulated hepatic gene transcription.
Figure 4.
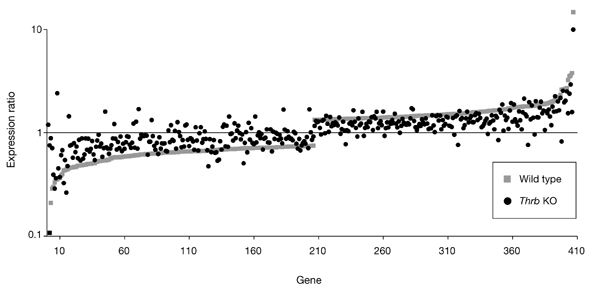
Comparison of T3-regulated gene expression in wild-type and Thrb knockout mice. The magnitudes of changes in gene expression in response to thyroid hormone (Th) in Th-deprived (propylthiouracil-treated) mice are usually greater in wild-type mice than in mice in which the Thrb gene is knocked out. Individual genes are arranged along the x axis according to the ranked order of decreases and increases in gene expression in wild-type mice. The y axis shows the log ratio of the transcription signals in T3-treated and euthyroid mice (T3/euthyroid). KO, knockout; T3, 3,3′,5-triiodothyronine; Thrb, thyroid-hormone-receptor-β.
Absence of receptor versus lack of hormone
We compared the gene expression pattern of Thra/Thrb double-knockout mice to that of the PTU-treated wild-type mice. Most positively regulated target genes had similar expression in these two types of mice (that is, they showed little or no basal repression; Fig. 2; clusters 2 and 3), although basal repression was seen for some positively regulated target genes in Th-deprived wild-type mice (Fig. 2, cluster 1). This, in turn, resulted in selective increases in gene expression in Thra/Thrb double-knockout mice compared with Th-deprived wild-type mice. Among some negatively regulated target genes, Thra/Thrb double-knockout and Th-deprived wild-type mice showed minimal or no change in expression compared with untreated wild-type mice (Fig. 3, cluster 5). However, increased transcription in Th-deprived wild-type mice compared with little or no change in Thra/Thrb double-knockout mice was seen for some target genes (Fig. 3, cluster 4). Notably, there were a few examples in which the Thra/Thrb double-knockout mice showed decreased expression of positively regulated target genes compared with Th-deprived wild-type mice (for example, spot 14 (Thsrp), interferon-γ-inducible protein 47 (Ifi47), purogenic receptor P2X (P2rx1), and expressedsequence tag (EST) 3110038L01Rik in cluster 2). In addition, there were a few examples of unexpected induction in Thra/Thrb double-knockout mice in genes that were positively regulated by T3 in wild-type mice (for example, insulin-like-growth-factor-binding protein 1 (Igfbp1) and peroxisomal membrane protein 2 (Pxmp2; Fig. 2, cluster 3). It is possible that some of these unexpected changes may be due to compensatory or homeostatic changes in the Thra/Thrb double-knockout mice, non-genomic effects of T3, or nonspecific effects of PTU.
We have performed a large-scale study of hormonal regulation in genetically engineered Tr knockout mice using cDNA microarrays and hierarchical clustering analyses. Our findings have shown the complexity and variety of patterns for positively and negatively regulated target genes, as well as the relative contributions of specific Tr isoforms to the transcriptional regulation of target genes. By using a reference RNA pool, we saw differential patterns of gene regulation, as some genes were responsive to subphysiological concentrations of Th, whereas others responded acutely to T3 treatment (Fig. 5). Basal repression of positively regulated genes and activation of negatively regulated genes during Th deprivation was seen only in a subset of target genes. In general, the gene expression profiles for Thra knockout and Thrb knockout mice were similar to those of wild-type mice, suggesting that most genes were co-regulated by both Tr isoforms and did not show isoformspecific transcriptional regulation. Studies with the Thra/Thrb double-knockout mice also showed that absence of Tr had a different effect on the pattern of gene expression than did the absence of ligand. Therefore, differential gene expression and basal repression probably account for phenotypic differences observed between Thra/Thrb double-knockout mice and hypothyroid neonatal mice (Flamant et al., 2002). Finally, our cDNA microarray studies demonstrated the feasibility and power of this technique for comparing hormonal effects on the gene-expression profiles of mice of different genotypes in the largest such study undertaken so far. Similar microarray and clustering techniques might be useful in future in in vivo studies of global gene expression patterns due to hormonal, drug, and metabolic influences.
Figure 5.
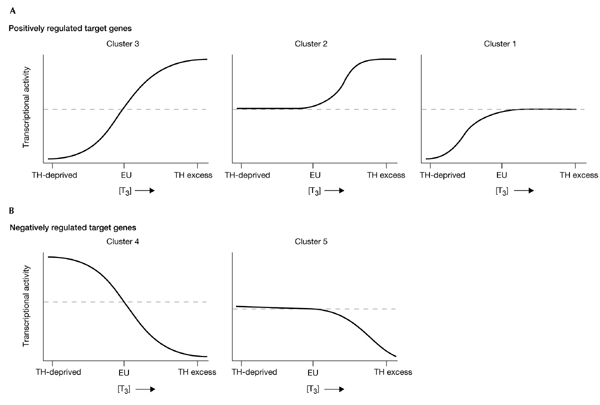
Model of gene expression patterns of positively and negatively regulated target genes. The model is based on clusters 1–5 in Figs 2,3. EU, euthyroid mice; T3, 3,3′,5-triiodothyronine; Th, thyroid hormone.
Methods
Animals.
Thrb knockout (Thrb−/− ) mice have been described previously (Gauthier et al., 1999); in these mice the Thrb gene inactivated downstream of exon 3 so that both the Thrb1 and Thrb2 mRNAs are not transcribed. In addition, Tr-β3 and Tr-Δβ3 are not expressed in these mice (Williams, 2000). Thra knockout (Thra 0/0) mice have been described previously (Macchia et al., 2001), and lack Thra1 and Thra2 mRNA, as well as ThrΔa1 and ThrΔa2 mRNA, which is initiated from an internal promoter in intron 7 that is disrupted in these mice. However, the gene for Rev-erbA-α, which is encoded on the opposite strand to Thra, is still intact. Heterozygous mice were crossed with the C57BL/6J strain at least nine times before they were interbred to generate homozygous knockout mice. Double heterozygous mice, Thra +/0 Thrb+/− , were generated by interbreeding the two lines, and were then intercrossed to generate homozygous Thra/Thrb double-knockout mice (Gauthier et al., 2001). These mice were viable and had no obvious morphological defects at birth. However, they had extreme thyroid-hormone resistance, as T3, T4 and Tsh levels were 16-fold, 9-fold and 125-fold, respectively, above the mean in wild-type mice. The wild-type mice used in this study as controls were littermates of the knockout mice.
Treatment of animals.
Mice were weaned four weeks after birth and were fed mouse chow that contained 0.53 p.p.m. iodine, as described previously in Macchia et al. (2001). All animal experiments were performed at the University of Chicago in accordance with protocols approved by the Institutional Animal Care and Use Committee.
At six weeks, mice were divided into four treatment groups: Th-deprived, untreated, Th-deprived given T3, and those given T3 only (Fig. 1). Th deprivation was achieved by feeding mice a low iodine (loI) diet supplemented with 0.15% PTU (Harlan) for four weeks (Weiss et al., 1998). Untreated mice and mice given T3 only were maintained on standard rodent chow. After four weeks on these diets, PTU-treated and untreated mice were injected intraperitoneally with 100 μg L-T3 for each 100 g of body weight. Six hours later, mice were killed by cervical dislocation, and their livers were removed for total RNA isolation. Previous Tsh measurements have shown that mice treated with PTU in accordance with this protocol are profoundly hypothyroid before T3 administration (Feng et al., 2000; Weiss et al., 1998).
RNA preparation and labelling.
Total RNA was isolated from mouse livers using the RNeasy kit (Qiagen) and was further purified using TRIZOL reagent (Life Technologies). 100 μg of total RNA was used to make cDNA using SuperScript II RNA reverse transcriptase (Life Technologies), as described previously (Khan et al., 1999). RNA isolated from untreated wild-type mice was used to prepare cDNA probes labelled with Cy3–dUTP (Amersham Pharmacia), which were used as controls. RNA isolated from livers of mice treated with PTU, PTU and T3, and from T3-treated wild-type mice, as well as from treated and untreated knockout mice, were used to prepare cDNA labelled with Cy5–dUTP (Amersham Pharmacia; Fig. 1). Labelled cDNA was purified using MicroCon 30 columns (Amicon).
Complementary DNA microarrays.
The cDNA microrarrays contained 3,899 detector elements (probes) that were derived from murine EST clones and from known genes obtained from Research Genetics, as described previously (Khanna et al., 2001). PCR products generated from these clones were printed onto glass slides as described previously (Khan et al., 1999). Probe sequences were verified for all T3-regulated genes.
Hybridization, scanning and data analysis.
Fluorescently-labelled cDNA from PTU-treated, PTU- and T3-treated, and T3-only-treated wild-type mice, as well as from untreated and treated knockout mice, were co-hybridized with labelled cDNA obtained from euthyroid wild-type mice. This was carried out on a microarray under a glass coverslip overnight at 60° C in a custom-built hybridization chamber. Fluorescence intensities were analysed using a laser scanner and image analysis was performed using DEARRAY software (Khan et al., 1999; Khanna et al., 2001). Data were stored in a FileMaker Pro database. For each reaction condition, data were generated from 3 or 4 mice (a total of 48 microarrays) and averaged for analysis.
The weighted average of three or four replicate experiments was calculated in two steps. First, the full set of experiments was normalized, and the normalized data were then averaged using a weighting scheme to take into account signal intensity and spot quality (Chen et al., 2002). Genes were selected for clustering if the maximum fluorescence intensity in either channel was >750 and the level of expression relative to untreated wild-type controls was >1.5 or <0.66 in any of the wild-type treatment groups. Hierarchical clustering was performed using the average linkage method using one uncentred Pearson correlation coefficient. Information showing a list of the genes on the microarray and the full names and changes, relative to pooled hepatic wild-type mRNA expression, of target genes, are available online at http://research.nhgri.nih.gov/microarray/selected_publications.html.
Supplementary information is available at EMBO reports online (http://www.nature.com/embor/journal/vaop/ncurrent/extref/4-embor862-s1.pdf http://www.nature.com/embor/journal/vaop/ncurrent/extref/4-embor862-s2.pdf http://www.nature.com/embor/journal/vaop/ncurrent/extref/4-embor862-s3.pdf).
Supplementary Material
Gene list
Fig. 2 Table
Fig. 3 Table
Acknowledgments
This work was supported in part by the US National Institutes of Health, grants DK15070 to S.R. and DK58281 to R.E.W.
References
- Burke L.J. & Baniahmad A. (2000) Co-repressors 2000. FASEB J., 14, 1876–1888. [DOI] [PubMed] [Google Scholar]
- Chen Y., Kamat V., Dougherty E.R., Bittner M.L., Meltzer P.S. & Trent J.M. (2002) Ratio statistics of gene expression levels and applications to microarray data analysis. Bioinformatics, 18, 1207–1215. [DOI] [PubMed] [Google Scholar]
- Feng X., Jiang Y., Meltzer P. & Yen P.M. (2000) Thyroid hormone regulation of hepatic genes in vivo detected by complementary DNA microarray. Mol. Endocrinol., 14, 947–955. [DOI] [PubMed] [Google Scholar]
- Flamant F., Poguet A.L., Plateroti M., Chassande O., Gauthier K., Streichenberger N., Mansouri A. & Samarut J. (2002) Congenital hypothyroid Pax8−/− mutant mice can be rescued by inactivating the TRα gene. Mol. Endocrinol., 16, 24–32. [DOI] [PubMed] [Google Scholar]
- Flamant F. & Samarut J. (2003) Thyroid hormone receptors: lessons from knockout and knock-in mice. Trends Endocrinol. Metab., 14, 85–90. [DOI] [PubMed] [Google Scholar]
- Flores-Morales A., Gullberg H., Fernandez L., Stahlberg N., Lee N.H., Vennstrom B. & Norstedt G. (2002) Patterns of liver gene expression governed by TRβ. Mol. Endocrinol., 16, 1257–1268. [DOI] [PubMed] [Google Scholar]
- Forrest D. & Vennstrom B. (2000) Functions of thyroid hormone receptors in mice. Thyroid, 10, 41–52. [DOI] [PubMed] [Google Scholar]
- Forrest D., Hanebuth E., Smeyne R.J., Everds N., Stewart C.L., Wehner J.M. & Curran T. (1996) Recessive resistance to thyroid hormone lacking thyroid hormone receptor β: evidence for tissue modulation of receptor function. EMBO J., 15, 3006–3015. [PMC free article] [PubMed] [Google Scholar]
- Gauthier K., Chassande O., Plateroti M., Roux J.P., Legrand C., Pain B., Rousset B., Weiss R., Trouillas J. & Samarut J. (1999) Different functions for the thyroid hormone receptors TRα and TRβ in the control of thyroid hormone production and post-natal development. EMBO J., 18, 623–631. [DOI] [PMC free article] [PubMed] [Google Scholar]
- Gauthier K. et al. (2001) Genetic analysis reveals different functions for the products of the thyroid hormone receptor α locus. Mol. Cell. Biol., 21, 4748–4760. [DOI] [PMC free article] [PubMed] [Google Scholar]
- Gothe S., Wang Z., Ng L., Kindblom J.M., Barros A.C., Ohlsson C., Vennstrom B. & Forrest D. (1999) Mice devoid of all known thyroid hormone receptors are viable but exhibit disorders of the pituitary–thyroid axis, growth, and bone maturation. Genes Dev., 13, 1329–1341. [DOI] [PMC free article] [PubMed] [Google Scholar]
- Hollenberg A.N., Monden T. & Wondisford F.E. (1995) Ligand-independent and -dependent functions of thyroid hormone receptor isoforms depend upon on their distinct amino terminal. J. Biol. Chem., 270, 14274–14280. [DOI] [PubMed] [Google Scholar]
- Khan J., Bittner M.L., Saal L.H., Teichmann U., Azorsa D.O., Gooden G.C., Pavan W.J., Trent J.M. & Meltzer P.S. (1999) cDNA microarrays detect activation of a myogenic transcription program by the PAX3-FKHR fusion oncogene. Proc. Natl Acad. Sci. USA, 96, 13264–13269. [DOI] [PMC free article] [PubMed] [Google Scholar]
- Khanna C., Khan J., Nguyen P., Prehn J., Caylor J., Yeung C., Trepel J., Meltzer P. & Helman L. (2001) Metastasis-associated differences in gene expression in a murine model of osteosarcoma. Cancer Res., 61, 3750–3759. [PubMed] [Google Scholar]
- Macchia P.E. et al. (2001) Increased sensitivity to thyroid hormone in mice with complete deficiency of thyroid hormone receptor α. Proc. Natl Acad. Sci. USA, 98, 349–354. [DOI] [PMC free article] [PubMed] [Google Scholar]
- Meltzer P.S. (2001) Spotting the target: microarrays for disease gene discovery. Curr. Opin. Genet. Dev., 11, 258–263. [DOI] [PubMed] [Google Scholar]
- Miller L.D., Park K.S., Guo Q.M., Alkharouf N.W., Malek R.L., Lee N.H., Liu E.T. & Cheng S.Y. (2001) Silencing of Wnt signaling and activation of multiple metabolic pathways in response to thyroid hormone-stimulated cell proliferation. Mol. Cell. Biol., 21, 6626–6639. [DOI] [PMC free article] [PubMed] [Google Scholar]
- Schwartz H.L., Strait K.A., Ling N.C. & Oppenheimer J.H. (1992) Quantitation of rat tissue thyroid hormone binding receptor isoforms by immunoprecipitation of nuclear triiodothyronine binding capacity. J. Biol. Chem., 267, 11794–11799. [PubMed] [Google Scholar]
- Tagami T., Madison L.D., Nagaya T. & Jameson J.L. (1997) Nuclear receptor corepressors activate rather than suppress basal transcription of genes that are negatively regulated by thyroid hormone. Mol. Cell. Biol., 17, 2642–2648. [DOI] [PMC free article] [PubMed] [Google Scholar]
- Weiss R.E., Murata Y., Cua K., Hayashi Y., Seo H. & Refetoff S. (1998) Thyroid hormone action on liver, heart, and energy expenditure in thyroid hormone receptor β-deficient mice. Endocrinology, 139, 4945–4952. [DOI] [PubMed] [Google Scholar]
- Williams G.R. (2000) Cloning and characterization of two novel thyroid hormone receptor β isoforms. Mol. Cell. Biol., 20, 8329–8342. [DOI] [PMC free article] [PubMed] [Google Scholar]
- Yen P.M. (2001) Physiological and molecular basis of thyroid hormone action. Physiol. Rev., 81, 1097–1142. [DOI] [PubMed] [Google Scholar]
- Zhang J. & Lazar M.A. (2000) The mechanism of action of thyroid hormones. Annu. Rev. Physiol., 62, 439–466. [DOI] [PubMed] [Google Scholar]
Associated Data
This section collects any data citations, data availability statements, or supplementary materials included in this article.
Supplementary Materials
Gene list
Fig. 2 Table
Fig. 3 Table