

Abstract
With the ageing population in most countries, disorders of bone and mineral metabolism are becoming increasingly relevant to every day clinical practice. Consequently, the interest in, and the need for effective measures to be used in the screening, diagnosis and follow-up of such pathologies has markedly grown. Together with clinical and imaging techniques, biochemical tests play an important role in the assessment and differential diagnosis of metabolic bone disease.
In recent years, the isolation and characterisation of cellular and extracellular components of the skeletal matrix have resulted in the development of molecular markers that are considered to reflect either bone formation or bone resorption. These biochemical indices are non-invasive, comparatively inexpensive and, when applied and interpreted correctly, helpful tools in the diagnostic and therapeutic assessment of metabolic bone disease.
Part I of this article provides an overview of the basic biochemistry of bone markers, and sources of non-specific variability. Part II (to be published in a subsequent issue of this journal) will review the current evidence regarding the clinical use of biochemical markers of bone remodelling in metabolic and metastatic bone disease.
Introduction
Bone is a metabolically active tissue that undergoes continuous remodelling by two counteracting processes, namely bone formation and bone resorption. These processes rely on the activity of osteoclasts (resorption), osteoblasts (formation) and osteocytes (maintenance). Under normal conditions, bone resorption and formation are tightly coupled to each other, so that the amount of bone removed is always equal to the amount of newly formed bone (Figure 1). This balance is achieved and regulated through the action of various systemic hormones (e.g. PTH, vitamin D, other steroid hormones) and local mediators (e.g. cytokines, growth factors). In contrast, somatic growth, ageing, metabolic bone diseases, states of increased or decreased mobility, therapeutic interventions and many other conditions are characterised by more or less pronounced imbalances in bone turnover. The results of such uncoupling in bone turnover are often changes in bone structure, strength and mass. While bone structure and strength are difficult to measure in vivo, bone mass can be assessed by densitometric techniques. In contrast to these rather static measures, however, molecular markers of bone metabolism are helpful tools to detect the dynamics of the metabolic imbalance itself.1,2
Figure 1.

The bone remodelling cycle. Under normal conditions, the resorption (osteoclast) phase takes approximately 10 days, which is then followed by a formation (osteoblast) phase that can last for up to 3 months.
Although the currently available markers of bone turnover include both enzymes and non-enzymatic peptides derived from cellular and non-cellular compartments of bone, they are usually classified according to the metabolic process they are considered to reflect. Most biochemical indices of bone resorption are related to collagen breakdown products such as hydroxyproline or the various collagen cross-links and telopeptides. Other markers of bone resorption include non-collagenous matrix proteins such as bone sialoprotein (BSP), or osteoclast-specific enzymes like tartrate-resistant acid phosphatase or cathepsin K. In contrast, markers of bone formation are either by-products of collagen neosynthesis (e.g. propeptides of type I collagen), or osteoblast-related proteins such as osteocalcin (OC) and alkaline phosphatase (AP). For clinical purposes, therefore, markers of bone formation are distinguished from indices of bone resorption (Table 1, Figure 2). This distinction, however, is not as sharp as it may appear. For example, some marker components reflect, at least in part, both bone formation and bone resorption (e.g. hydroxyproline, certain OC fragments). Furthermore, most of the molecules used as markers of bone turnover are also present in tissues other than bone, and non-skeletal processes may therefore influence their circulating or urinary levels. Finally, changes in markers of bone turnover are not disease specific but reflect, as an integral measure, alterations in the metabolism of the entire skeletal envelope independently of the underlying cause. Hence, results of bone marker measurements should always be interpreted against the background of their basic science and the clinical picture.
Table 1.
Markers of bone turnover.
| Marker | Tissue of Origin | Specimen | Analytical Method | Remarks |
|---|---|---|---|---|
|
Markers of bone formation | ||||
| Bone-specific alkaline phosphatase (BAP, bone ALP) | Bone | Serum | Electrophoresis, Precipitation, IRMA, EIA | Specific product of osteoblasts. Some assays show up to 20% cross-reactivity with the liver isoenzyme (LAP) |
| Osteocalcin (OC) | Bone, platelets | Serum | RIA, IRMA, ELISA | Specific product of osteoblasts; many immunoreactive forms in blood; some may be derived from bone resorption. |
| C-terminal propeptide of type I procollagen (PICP) | Bone, soft tissue, skin | Serum | RIA, ELISA | Specific product of proliferating osteoblasts and fibroblasts. |
| N-terminal propeptide of type I procollagen (PINP) | Bone, soft tissue, skin | Serum | RIA, ELISA | Specific product of proliferating osteoblast and fibroblasts; partly incorporated into bone extracellular matrix. |
|
Markers of bone resorption | ||||
| Collagen-related markers | ||||
| Hydroxyproline, total and dialysable (Hyp) | Bone, cartilage, soft tissue, skin | Urine | Colorimetry HPLC | Present in all fibrillar collagens and partly collagenous proteins, including C1q and elastin. Present in newly synthesised and mature collagen, i.e. both collagen synthesis and tissue breakdown contribute to urinary hydroxyproline. |
| Hydroxylysine-glycosides | Bone, soft tissue, skin, serum complement | Urine (serum) | HPLC
ELISA |
Hydroxylysine in collagen is glycosylated to varying degrees, depending on tissue type. Glycosylgalactosyl-OHLys in high proportion in collagens of soft tissues, and C1q; Galyctosyl-OHLys in high proportion in skeletal collagens. |
| Pyridinoline (PYD) | Bone, cartilage, tendon, blood vessels | Urine
Serum |
HPLC
ELISA |
Collagens, with highest concentrations in cartilage and bone; absent from skin; present in mature collagen only. |
| Deoxypyridinoline (DPD) | Bone, Dentin | Urine
Serum |
HPLC
ELISA |
Collagens, with highest concentration in bone; absent from cartilage or skin; present in mature collagen only. |
| Carboxyterminal cross-linked telopeptide of type I collagen (ICTP, CTX-MMP) | Bone, Skin | Serum | RIA | Collagen type I, with highest contribution probably from bone; may be derived from newly synthesised collagen. |
| Carboxyterminal cross-linked telopeptide of type I collagen (CTX-I) | All tissues containing type I collagen | Urine (a-/β)
Serum (β only) |
ELISA
RIA |
Collagen type I, with highest contribution probably from bone. Isomerisation of aspartyl to β-aspartyl occurs with ageing of collagen molecule. |
| Aminoterminal cross-linked telopeptide of type I collagen (NTX-I) | All tissues containing type I collagen | Urine
Serum |
ELISA
CLIA RIA |
Collagen type I, with highest contribution from bone. |
| Collagen I alpha 1 helicoidal peptide (HELP) | All tissues containing type I collagen | Urine | ELISA | Degradation fragment derived from the helical part of type I collagen (alpha-1 chain, AA 620-633). Correlates highly with other markers of collagen degradation, no specific advantage or difference in regards to clinical outcomes. |
|
Non-Collagenous Proteins | ||||
| Bone Sialoprotein (BSP) | Bone, Dentin, hypertrophic cartilage | Serum | RIA
ELISA |
Acidic, phosphorylated glycoprotein, synthesised by osteoblasts and osteoclastic- like cells, laid down in bone extracellular matrix. Appears to be associated with osteoclast function. |
| Osteocalcin fragments (ufOC, U-Mid-OC, U-LongOC) | Bone | Urine | ELISA | Certain age-modified OC fragments are released during osteoclastic bone resorption and may be considered an index of bone resorption. |
| Osteoclast Enzymes | ||||
| Tartrate-resistant acid phosphatase (TRAcP) | Bone
Blood |
Plasma
Serum |
Colorimetry
RIA ELISA |
Six isoenzymes found in human tissues (osteoclasts, platelets, erythrocytes). Band 5b predominant in bone (osteoclasts). |
| Cathepsins (e.g. K, L) | K: Primarily in osteoclasts
L: Macrophage, Osteoclasts |
Plasma, Serum | ELISA | Cathepsin K, a cysteine protease, plays an essential role in osteoclast-mediated bone matrix degradation by cleaving helical and telopeptide regions of collagen type I. Cathepsin K and L cleave the loop domain of TRAP and activate the latent enzyme. Cathepsin L has a similar function in macrophages.
Tests for measurement of Cathepsins in blood are presently under evaluation. |
Figure 2.

Biochemical markers of bone remodelling.
Markers of Bone Formation
Bone formation markers are products of active osteoblasts expressed during different phases of osteoblast development. They are considered to reflect different aspects of osteoblast function and of bone formation. All markers of bone formation are measured in serum or plasma.
Serum Total Alkaline Phosphatase (AP)
AP is a ubiquitous, membrane-bound tetrameric enzyme attached to glycosyl-phosphatidylinositol moieties located on the outer cell surface.3 The precise function of the enzyme is yet unknown, but it obviously plays an important role in osteoid formation and mineralisation.4 The total AP serum pool (TAP) consists of several dimeric isoforms, which originate from various tissues: liver, bone, intestine, spleen, kidney, and placenta. In addition, certain tumours may express macromolecular forms of AP (e.g. “Nagao AP”).5,6
The physiological isoforms of AP are coded by four gene loci, including three tissue-specific and one non-tissue-specific gene on chromosome 1. The latter encodes for the most abundant isoforms, namely bone, liver, and kidney AP. The differences between these non-specifically encoded isoenzymes are solely due to post-translational modifications in the carbohydrate moiety.7 In adults with normal liver function, approximately 50% of the total AP activity in serum is derived from the liver, whereas 50% arises from bone.8 In children and adolescents the bone-specific isoenzyme predominates (up to 90%) because of skeletal growth.9,10
Many techniques have been developed to differentiate between the two main isoforms of circulating AP, including heat denaturation, electrophoresis, precipitation, selective inhibition and, more recently, immunoassays.11–15 In healthy adults, most methods show a good correlation between bone specific and total AP (Figure 3). The newer immunoassays allow simple and rapid quantitation of either enzyme activity or enzyme mass. However, like all of the other techniques, even these assays show a certain degree of cross-reactivity between bone and liver AP (15–20%). Therefore, in subjects with high liver AP, results of bone AP measurements may be artificially high, leading to false positive results.7, 16, 17
Figure 3.

Correlation between serum total and bone specific alkaline phosphatase. Patients with non-skeletal disease had chronic hepatic failure, chronic obstructive pulmonary disease, or chronic renal failure. Patients with skeletal disease had Paget’s disease of bone, primary or secondary hyperparathyroidism, or metastatic bone disease. TAP, total alkaline phosphatase; L-BAP, bone alkaline phosphatase measured by lectin precipitation assay; I-BAP, bone alkaline phosphatase measured by immunoradiometric assay (IRMA); E-BAP, bone alkaline phosphatase measured by enzyme linked immunosorbant assay (ELISA) Reproduced from, Woitge H, Seibel MJ, Ziegler R. Comparison of total and bone-specific alkaline phosphatase in patients with nonskeletal disorders or metabolic bone disease Clin Chem 1996;42:1796–1804 with permission of the publisher of Clinical Chemistry.
Serum total AP is the most widely used marker of bone metabolism due to the wide availability of inexpensive and simple methods. Once liver disease is ruled out, serum levels of total AP provide a good impression of the extent of new bone formation and osteoblast activity.18,19 From a clinical perspective, however, detection of the bone-specific AP (BAP) isoenzyme is increasingly preferred because of its higher specificity.8, 20, 21
Osteocalcin (OC)
OC is a 5.8 kDa, hydroxyapatite-binding, protein exclusively synthesised by osteoblast, odontoblasts and hypertrophic chondrocytes.22–24 One of the major characteristics of OC is 3 vitamin-K dependent, gamma-carboxyglutamic acid (Gla) residues, which are responsible for the calcium binding properties of the protein.25 At its carboxy-terminus, OC can also interact with other proteins, including cell surface receptors. These functions predispose OC as a molecule active in the organisation of the extracellular matrix. Earlier research has suggested that OC is involved in the process of osteoid mineralisation, as the protein is expressed mainly during this phase of bone formation. However, although OC has been known for more than 20 years, its precise function has yet to be determined. More recently, new light has been cast on this issue through the development of an OC knockout mouse model. Unexpectedly, these animals have increased cortical and trabecular thickness, and their bones seem mechanically more stable than those of the wild type.26 Although the knockout model awaits further characterisation, it seems that OC is involved in the bone remodelling process and may act via a negative feed back mechanism.
OC is considered a specific marker of osteoblast function.27 It is estimated that, directly after its release from osteoblasts, the largest part of the newly synthesised protein is incorporated into the extracellular bone matrix where it constitutes approximately 15% of the non-collagenous protein fraction. A smaller fraction is released into the circulation where it can be detected by immunoassays.28–34 Serum levels of immunoreactive OC have been shown to correlate well with the bone formation rate as assessed by histomorphometry.35 However, the peptide is readily subject to rapid degradation in serum, so that both intact peptides and OC fragments of various sizes coexist in the circulation.36–38 Furthermore, since OC is incorporated into the bone matrix, some investigators have suggested that OC fragments may be released even during bone resorption. This may be particularly true for some smaller N-terminal fragments of OC, which are found in individuals with high bone turnover.39–41 The ensuing heterogeneity of OC fragments in serum results in considerable limitations in the clinical application of this a priori highly specific marker. Thus, the various assays used to measure OC in serum detect fragments of various sizes and usually, epitope specificity and antibody cross-reactivity of the assays are ill defined. In practice, different immunoassays have routinely yielded such varying results in measurements that they are not comparable. 43,45
Two-site immunoassays, utilising antibodies detecting different parts of the OC molecule, have been introduced that detect the intact 1–49 OC molecule. However, only one third of the total OC serum pool represents intact OC, and due to the instability of OC in serum, rapid loss of immunoreactivity is seen with these assays when samples are left for more than 1 hour at room temperature. To circumvent this problem, newer assays measure the largest degradation product of OC, the 1–43 (N-terminal/mid-molecule) fragment. This fragment, which represents one-third of the circulating OC pool, is a result of proteolytic degradation of the intact molecule and may in part be generated by active osteoblasts. Although little is know about the function of the N-terminal fragment, it’s measurement eliminates in part the problem of pre-analytical instability.45,46 However, quick processing of the blood sample after drawing is essential for most assays since a loss of reactivity is noted within a few hours at room temperature. The same applies to sera subjected to multiple thawing, or prolonged storage at temperatures above −25° C.
Procollagen Type I Propeptides
The procollagen type I propeptides are derived from collagen type I, the most abundant form of collagen found in bone.45 However, type I collagen is also present in other tissues such as skin, dentin, cornea, vessels, fibrocartilage, and tendons. In bone, collagen is synthesised by osteoblasts in the form of pre-procollagen. These precursor molecules are characterised by short terminal extension-peptides: the amino (N-) terminal propeptide (PINP) and the carboxy (C-) terminal propeptide (PICP) (Figure 4).46 After secretion into the extracellular space, the globular trimeric propeptides are enzymatically cleaved and liberated into the circulation.47 PICP has a MW of 115 kDa, is stabilised by disulphide bonds, cleared by liver endothelial cells via the mannose receptor and therefore has a short serum half-life of 6–8 minutes.48,49 PINP has a MW of only 70 kDa, is rich in proline and hydroxyproline and is eliminated from the circulation by liver endothelial cells by the scavenger receptor. Since both PICP and PINP are generated from newly synthesised collagen in a stoichiometric fashion, the propeptides are considered quantitative measures of newly formed type I collagen. Although type I collagen propeptides may also arise from other sources, most of the non-skeletal tissues exhibit a slower turnover than bone, and contribute very little to the circulating propeptide pool.
Figure 4.

Schematic representation of the collagen type I molecule. The carboxy- and amino-terminal propeptides are cleaved by specific propeptidases and are partly released into the circulation. Figure courtesy of Dr Simon Robins, Aberdeen.
Both propeptides are currently measured by specific immunoassays.50,51 Different studies have shown good correlations between serum PICP levels and the rate of bone formation.52,53 While the clinical relevance of PICP in the evaluation of metabolic bone diseases is still viewed with skepticism,54,55 serum PINP appears to be of greater diagnostic validity. From a practical point of view, the thermostability of the propeptides is an advantage in that extended transport and storage times are well tolerated without significant loss of signal. The propeptides share these properties with most of the parameters of collagen metabolism (e.g., crosslinks, ICTP, NTx, CTx, hydroxyproline; vide infra.
Markers of Bone Resorption
Except for tartrate-resistant acid phosphatase the majority of bone resorption markers are degradation products of bone collagen (Figure 5). More recently, non-collagenous proteins such as BSP, and osteoclast-derived enzymes such as cathepsin K and L have been investigated as markers of bone turnover.
Figure 5.

Molecular basis of currently used markers of type I collagen-related degradation. For more details, see text and Table 1. Figure courtesy Dr Simon Robins, Aberdeen.
Hydroxyproline (OHP)
OHP is formed intracellularly from the post-translational hydroxylation of proline and constitutes 12–14% of the total amino acid content of mature collagen. Ninety percent of the OHP liberated during the degradation of bone collagen is primarily metabolised in the liver.56 Subsequently, it is excreted in the urine where it may be detected either as free or peptide-bound hydroxyproline by colorimetric or HPLC methods.57,58 Urinary OHP is usually considered to reflect bone resorption. However, it should be noted that significant amounts of urinary OHP are derived from the degradation of newly synthesised collagen.59 In addition, hydroxyproline can be found in other tissues such as the skin and, moreover, liberated from the metabolism of elastin and C1q.60,61 Urinary hydroxyproline is therefore considered an unspecific index of collagen turnover and, consequently, has been largely replaced by more specific techniques.
Hydroxylysine-Glycosides
The hydroxylysine-glycosides arise during the post-translational phase of collagen synthesis and occur in two forms, glycosyl-galactosyl-hydroxylysine (GGHL) and galactosyl-hydroxylysine (GHL) (Figure 5).62 Both components are released into the circulation during collagen degradation and may be measured in urine by HPLC after appropriate derivatisation.63 The intrinsic advantage of hydroxylysine over that of hydroxyproline is that the glycosylated forms are not metabolised and are not influenced by dietary components.62,63 Moreover, GGHL is present in skin and C1q, while GHL is more specific for bone. Thus the ratio of GGHL/GHL may allow for the recognition of existent tissue specificity. Although the hydroxylysines have potential as markers of bone resorption, their major disadvantage is the current absence of a convenient immunoassay format.64–66
3-Hydroxypyridinium Crosslinks of Collagen Pyridinoline (PYD) and Deoxypyridinoline (DPD)
PYD and DPD are formed during the extracellular maturation of fibrillar collagens. As trifunctional crosslinks, they bridge several collagen peptides and mechanically stabilise the collagen molecule (Figure 5).67–69 During bone resorption, crosslinked collagens are proteolytically broken down and the crosslink components are released into the circulation and the urine.70–72 The measurement of hydroxypyridinium crosslinks is not influenced by the degradation of newly synthesised collagens and their levels strictly reflect the degradation of mature i.e. crosslinked collagens. In addition, the urinary excretion of pyridinium crosslinks is independent of dietary sources since neither PYD nor DPD are taken up from food.73 Finally, the two hydroxypyridinium components show a high specificity for skeletal tissues. While PYD is found in cartilage, bone, ligaments and vessels, DPD is almost exclusively found in bone and dentin. Neither derivative is present in the collagen of skin or in other sources such as C1q or elastin.61,74,75 Since bone has a much higher turnover than cartilage, ligaments, vessels or tendons, the amounts of PYD and DPD in serum or urine are mainly derived from the skeleton. Thus, the pyridinium crosslinks are currently viewed the best indices for assessing bone resorption.76–78
Initially, PYD and DPD were quantified in urine by reverse-phase ion-paired HPLC technique, combined with a pre-fractionation step using cellulose partition chromatography, and hydrolysis of urine samples to convert all crosslinks into the peptide free forms.75,79–81 Currently, automated techniques for the measurement in urine and serum are available. Analysis of urine by HPLC without initial hydrolysis showed that 40–50% of the crosslinks were present in peptide-free form.82 Although the amounts of free and peptide-bound crosslinks seem to vary with the bone pathology, direct immunoassays for free and peptide-bound crosslinks are widely used. Under normal conditions, these assays have been shown to produce results similar to those provided by the traditional HPLC technique.83–85
Crosslinked Telopeptides of Type I Collagen
The crosslinked telopeptides of type I collagen are derived from specific regions of the collagen type I molecule, namely the aminoterminal (NTP) and the carboxyterminal (CTP) telopeptide (Figure 5).
The first collagen telopeptide assay was a RIA for the carboxyterminal type I collagen telopeptide (ICTP) in serum.86 The respective antibodies were raised against a crosslink-containing collagen peptide (MW 8.5 kDa) isolated from human bone. The antigenic determinant requires a trivalent crosslink, including two phenylalanine-rich domains of the telopeptide region of the alpha-1 chain of type I collagen. Divalently and non-crosslinked peptides do not react with the antibody, nor do peptides isolated from skin. Despite the fact that the initial peptide contained pyridinoline, the assay also detected other crosslink forms such as deoxypyridinoline or pyrrole crosslinks. The ICTP assay appears to be sensitive for pathological bone resorption as seen in multiple myeloma, metastatic bone disease and other degradation processes involving hasty breakdown of skeletal and non-skeletal type I collagen.87
Another group of immunoassays involve the carboxyterminal telopeptide of type I collagen, abbreviated CTX (Figure 5).88 Employing a polyclonal antiserum against a synthetic octapeptide containing the crosslinking site, a first ELISA (termed β-CTX) recognised the C-terminal type I collagen telopeptide containing an isoaspartyl (=β-aspartyl) peptide bond in its L-enantiomeric form.89 The β–L-aspartyl is considered to result mainly from the ageing of extracellular proteins. Only one peptide strand is necessary for immunoreactivity. Meanwhile, a monoclonal-based RIA for the non-isomerised octapeptide (EKAH- αD-GGR) in urine has been developed (“α-CTX”).90 Simultaneous measurement of both forms may be used to calculate the ratio of α-CTX/β-CTX as an index of bone turnover. This ratio has been shown to be elevated in the urine of patients with untreated Paget's disease of bone, where rapid bone formation and resorption result in an increase of α-CTx (non-isomerised octapeptide).91
Further to isomerisation, many proteins are also subjected to racemisation of certain residues. Both processes are considered an effect of ageing, as the extent of racemisation and isomerisation increases with the time elapsed since synthesis of the protein. Additionally, antibodies directed against the D-aspartic acid residues in the CTX molecule have been described.92 Thus, immunoassays now exist (though not commercially available) for all four possible isomers of the CTX molecule: the native α-L form, the β-isomerised isoaspartyl peptide (βL), and the respective racemised forms α-D and β-D. The differential use of these assays may possibly provide information on the age-dependent changes of collagen in health and disease, although the clinical relevance is questionable.93
More recently, a sandwich ELISA for the measurement of β-CTX in serum has been developed. When this assay was described initially, it utilised a polyclonal antiserum against collagenase-digested collagen type I together with the β-isomerised C-terminal octapeptide attached to the ELISA plate.94 The newer assay uses two monoclonal antibodies, and it is claimed that they recognise only dipeptides containing a crosslink and two β-isomerised peptides with the same sequence as shown for the urinary assay. Although there is no direct evidence that the antigenic determinant in serum must contain a crosslink for immunoreactivity, this is indeed highly probable since β-transformation occurs slower than crosslinking, and single peptides do not react in the serum CTX-ELISA. However, the crosslink component may be any kind of crosslink, similar to the ICTP antigen in serum. Presently, standards for the original serum CTX-ELISA are made from antigens immunopurified from human urine, but automated assays (Boehringer-Mannheim) utilise synthetic antigens. Serum and urinary CTX values are highly correlated (r= 0.86) suggesting that the antigen is similar in both analytical media.
Yet another peptide assay measures the crosslinked N-terminal telopeptide of type I collagen. This assay (termed NTX-assay) utilises a monoclonal antibody raised against an epitope on the alpha-2 chain of type I collagen. (Figure 5).95 However, the antibody seems to react with several crosslinking components, and the presence of a pyridinium crosslink is not essential for reactivity. As a matter of fact, digests of skin collagen exhibited similar reactivity with the NTX assay as skeletal extracts.96 Both the monoclonal antibody and the assay format are identical for the urine and the serum based assays. As expected, the two assays show good correlation to each other, and the analyte seems to be stable at room temperature and during up to three freeze-thaw cycles.97
Bone Sialoprotein (BSP)
BSP is a phosphorylated glycoprotein with an apparent MW of 70–80 kDa, which accounts for 5–10% of the non-collagenous matrix of bone.98,99 The protein has been shown to be a major synthetic product of active osteoblasts and odontoblasts, but was also found in osteoclast-like and malignant cell lines. Consequently, BSP or its mRNA is detected mainly in mineralised tissue such as bone, dentin and at the interface of calcifying cartilage.100–102 Intact BSP contains an Arg-Gly-Asp (RGD) integrin recognition sequence, improves the attachment of osteoblasts and osteoclasts to plastic surfaces, binds preferentially to the α2 chain of collagen, nucleates hydroxyapatite crystal formation in vitro and appears to enhance osteoclast mediated bone resorption.103,104 The protein is therefore considered to play an important role in cell-matrix-adhesion processes and in the supramolecular organisation of the extracellular matrix of mineralised tissues.
We and others have developed immunoassays for the measurement of BSP in serum.105,106 So far, all of these assays are based upon polyclonal antisera, and little is known about the specific nature of the respective epitopes. Antibodies do not cross-react with non-collagenous proteins such as osteonectin, fibronectin or osteocalcin.106 In serum, the majority of BSP is bound to Factor H, a major regulator of the alternate complement pathway, which is found at 0.5g/L in serum. Although this phenomenon is of unknown physiological relevance, BSP/Factor H binding studies suggest that current immunoassays detect only a fraction of bioavailable BSP in serum.107 Based upon clinical data and the rapid reduction of serum BSP levels following intravenous bisphosphonate treatment, it is assumed that serum BSP reflects processes mainly related to bone resorption.108
Tartrate-Resistant Acid Phosphatase (TRAP, TRAcP)
This enzyme belongs to the family of the ubiquitous acid phosphatases, of which at least five different isoforms are known. These isoforms are expressed by different tissues and cells such as prostate, bone, spleen, platelets, erythrocytes, and macrophages. All acid phosphatases are inhibited by L(+)-tartrate, except band 5, which was therefore termed tartrate-resistant acid phosphatase (TRAP or TRAcP). Of the latter, 2 subforms, 5a and 5b are known, and recent research has shown that TRAP-5b is characteristic of osteoclasts.109 The origin of TRAP-5a is unknown, but may be expressed by macrophages. The two isoforms 5a and 5b are different in that 5a contains sialic acid, whereas 5b does not. So far, most assays for the measurement of TRAP in blood have used colorimetry and detected both isoforms without differentiating between bands 5a and 5b. More recently, specific immunoassays for TRAP 5b have been described and clinical results indicate that this marker may be useful to assess osteoclast activity.110,111 The antibodies for these assays were raised against material isolated from the spleen of a patient with hairy cell leukemia or against TRAP 5b isolated from human cord plasma.112,113 For the conventional TRAP assays, care should be taken after phlebotomy to stabilise the enzyme since TRAP loses more than 20% of its activity per hour at room temperature. This can be prevented by the addition of citrate buffer to the sample.114
Cathepsin K
Cathepsin K is a member of the cysteine protease family that, unlike other cathepsins, has the unique ability to cleave both helical and telopeptide regions of collagen I.115,116 Its clinical relevance was appreciated with the discovery that pycnodysostosis, an autosomal recessive disease characterised by osteopetrosis, was the result of mutations in the cathepsin K gene.117 This clinical phenotype has been confirmed in cathepsin K null mice showing dysfunctional matrix digestion.118,119 Immunocytochemical studies have shown that cathepsin K is located intracellularly in vesicles, granules and vacuoles throughout the cytoplasm of osteoclasts and that it is secreted into bone resorption lacunae for extracellular collagen degradation.120 Recently, a new enzyme-linked immunoassay for measurements of cathepsin K in serum has been developed. Due to the fact that cathepsin K is expressed and secreted by osteoclasts during active bone resorption, cathepsin K, and specifically its circulating form, may be a useful and specific biochemical marker of osteoclastic activity.
Variability
Most bone turnover markers exhibit significant within-subject variability. This poses a major problem in the practical use of bone markers: Whenever a change in a bone marker level is observed in an individual patient (e.g. following an intervention), this change must be interpreted against the background of the respective marker’s variability. Therefore, knowledge of the sources of variability and the strategies used to cope with “background noise” are essential for the meaningful interpretation of bone markers.
In general, non-specific variability comprises both pre-analytical (i.e. mostly subject related; CVPA) and analytical (i.e. mostly assay related; CVA) factors. Total variability is considered the sum of pre-analytical and analytical variation and defined as CVT2 = CVPA2 + CVA2. The ideal marker and assay is characterised by i) excellent analytical performance (i.e. high precision and accuracy) and ii) minimal and predictable pre-analytical variability. Unfortunately, no test in clinical chemistry completely meets all of these criteria. Indeed, most of the currently available assays for biochemical markers of bone turnover are characterised by substantial pre-analytical variability. The relevant pre-analytical factors affecting marker variability are summarised in Table 2 and 3.
Table 2.
Sources of pre-analytical variability.
| Technical sources |
| Specimen and mode of sample collection |
| Specimen handling and storage |
| Thermodegradation |
| Photolysis |
| Timing of sample collection (see also diurnal variation) |
| Between laboratory variation |
| Biological (subject related) sources |
| Age: |
| Puberty, somatic growth, menopausal transition, menopause, ageing, frailty |
| Gender |
| Ethnicity |
| Recent fractures (up to one year) |
| Pregnancy/Lactation |
| Drugs: |
| Anti-resorptive agent (e.g. HRT, bisphosphonates, SERMs, strontium, OPG) |
| Anabolic agents (e.g. anabolic steroids, PTH, PTHrP, strontium) |
| Glucocorticosteroids |
| Anticonvulsants |
| GnRH agonists |
| Oral Contraception |
| Non-skeletal Disease: |
| Diabetes |
| Thyroid disease |
| Renal impairment (GFR < 20 ml/min/1.73 m2) |
| Liver disease |
| Systemic inflammatory disease (IBD, RA, COPD etc.) |
| Degenerative joint disease |
| Immobility/Loss of gravity (bed rest, space flight) |
| Diet |
| Exercise |
| Temporal variability: |
| Diurnal (circadian) |
| Menstrual |
| Seasonal |
Table 3.
Pre-analytical and biological characteristics of bone markers.
| Marker (abbreviation) | Recommended storage | Concentrations influenced by |
|---|---|---|
| Total alkaline phosphatase | Stable < −20°C | Liver function |
| Bone-Specific alkaline phosphatase | Stable < −20°C | Liver function |
| Osteocalcin | Unstable < −80°C | Renal function, haemolysis |
| Procollagen type I carboxy-terminal propeptide | Stable < −20°C | Liver function |
| Procollagen type I amino-terminal propeptide | Stable < −20°C | Liver function |
| Hydroxyproline | Stable < −20°C | Liver function, diet, inflammation (e.g. Clq) |
| Pyridinoline | Stable < −20°C | Liver function, active arthritis, UV radiation |
| Deoxypyridinoline | Stable < −20°C | Liver function, UV radiation |
| Carboxy-terminal crosslinked telopeptide of type I collagen (ICTP) | Stable < −20°C | Renal function, liver function |
| Carboxy-terminal crosslinking telopeptide of type I collagen (CTX-I) | Stable < −20°C | Renal function, liver function |
| Amino-terminal crosslinkng telopeptide of type I collagen | Stable < −20°C | Liver function |
| Hydroxylysine glycosides (Hyl-glycosides) | Stable < −20°C | Liver function |
| Bone sialoprotein | Stable < −20°C | Renal function, Liver function, hemolysis |
| Tartrate resistant acid phosphatase | Unstable < −80°C | Haemolysis, blood clotting |
A number of factors need to be taken into account when employing serial measurements of biochemical markers to determine changes in bone turnover. To minimise some of the limitations linked to pre-analytical and analytical variability, standardised sampling and sample handling are mandatory to obtain reliable results.
Technical Sources of Variability
In addition to parameters of assay performance (Figure 6 and 7), factors such as the choice of sample (i.e. serum versus urine), mode of sample collection (e.g. 24 hour collection versus first or second morning void), the appropriate preparation of the patient (e.g. pre-sampling diet/fasting/exercise before phlebotomy), the correct handling, processing and storage of specimens should always be considered. This is important as these technical sources of variability are controllable and hence modifiable. For the purpose of practical use, some technical aspects of variability are discussed in more detail in Table 2.
Figure 6.

Intra-assay precision profiles for three immunoassays measuring type I collagen degradation products in urine. A: Deoxypyridinoline (DPD), B: Aminoterminal crosslinked telopeptide (NTX), C: Carboxyterminal octapeptide (CTX) Reproduced from, Ju HS, Leung S, Brown B, et al. Comparison of analytical performance and biological variability of three bone resorption assays. Clin Chem 1997, 43:1570–6. With permission of Clinical Chemistry.
Figure 7.

Dilution linearity profiles for three immunoassays measuring type I collagen degradation products in urine (n=4). A: Deoxypyridinoline (DPD), B: Aminoterminal crosslinked telopeptide (NTX), C: Carboxyterminal octapeptide (CTX). Reproduced from, Ju HS, Leung S, Brown B, et al. Comparison of analytical performance and biological variability of three bone resorption assays. Clin Chem 1997, 43:1570–6. With permission of Clinical Chemistry.
Thermodegradation
Some bone markers are sensitive to ambient conditions such as temperature. Thermodegradation should always be a concern with assays directed against the intact OC(1–49) molecule. Rapid enzymatic cleavage of the peptide into smaller fragments will lead to significant signal losses if the serum sample is kept at room temperature for more than 1–2 hrs. Adding protease inhibitors will delay, but by no means prevent this process.121 Both the free and conjugated forms of PYD and DPD have been shown to be stable in urine samples kept at room temperature for several weeks. Several reports show that pyridinium crosslinks can be stored at –20°C for years and that repeated freeze-thaw cycles of urine samples have no effect on the concentrations of PYD and DPD.122
Similar stability has been reported for urinary N-terminal (NTX) and C-terminal (CTX) collagen type I telopeptides, while ICTP in serum loses up to 12% of the signal when stored at room temperature for 5 days.123 The stability of glycosylated hydroxylysine residues has not been fully characterised yet, but it may be necessary to add boric acid to preserve the urine samples.
The activity of serum tartrate-resistant acid phosphatase (TRAP) declines rapidly during storage at room temperature or even at −20°C but is stable when stored at −70°C or lower.114 Multiple freezing-thaw cycles usually have a deleterious effect on serum TRAP activity. In contrast, serum levels of BSP appear rather stable, both at room temperature, 4°C and −20°C, and have been shown to not change significantly during repeated freeze-thaw-cycles.124 However, when samples are being exposed to temperatures above 30°C, an increase in signal is usually seen with the RIA.
Some assays and marker components are sensitive to haemolysis of the sample, resulting in results that are either too low or too high. This is usually the case for OC and BSP, but has also been described for TRAP and some other serum markers.
Photolysis
Pyridinium crosslinks in aqueous solutions are unstable when subjected to intensive UV irradiation.122,123,125 The effect increases with rising pH and has been shown to be greater for free than for total pyridinoline.122 Urinary NTX and CTX are not affected by UV light exposure.123
Timing and Mode of Sample Collection
In general, random samples can be used for measurement of most urinary parameters (but see below for diurnal variation!). For convenience, measurement of bone markers in urine is usually performed either in the first or second morning void, or in 2 hour collections. In each case, values need to be corrected for urinary creatinine which introduces additional pre-analytical and analytical variability. Creatinine output has been reported to be fairly constant with time (variations within 10%) and to correlate with lean body mass,126 but there are also reports suggesting that the correction for creatinine in a urine spot sample could be misleading. Alternatively, the excretion rate of the marker may be determined in a 24 hour urine collection. However, these collections are subject to inevitable inaccuracies due to collection errors. With most markers, similar results are obtained from either 24 hours, 2-hours, or spot urine (FMV, SMV) collections.
It is long known that bone turnover and thus bone markers show significant diurnal variations, with highest values in the early morning hours and lowest values during the afternoon and evening.127 Most studies report daily amplitudes of 15 – 30%, although the most pronounced diurnal changes have been communicated for CTX (Figure 8).128–134 It should be borne in mind that the slope of diurnal changes is steepest during the morning hours, which is usually the time at which urine samples are collected. This is true for both urinary and serum markers. Controlling the timing of sample collection is therefore a “bare necessity” for all types of markers (see also further below).
Figure 8.

Diurnal variation. A–C: Comparison of three immunoassays measuring type I collagen degradation products in urine. A: Deoxypyridinoline (DPD), B: Aminoterminal crosslinked telopeptide (NTX), C: Carboxyterminal octapeptide (CTX). All values are creatinine-corrected. The thick line represents the mean, while thin lines are individual subjects. Reproduced from, Ju HS, Leung S, Brown B, et al. Comparison of analytical performance and biological variability of three bone resorption assays. Clin Chem 1997, 43:1570–76. With the permission of Clinical Chemistry.
In addition, the effects of diet and food intake need to be considered with certain markers. For example, the ingestion of hydroxyproline-rich foods, such as meat or gelatine will markedly affect measurements of OHP in urine.135 It is therefore necessary to instruct patients to be on a collagen-free diet for at least 24 hours before collecting their urine for OHP measurements. In contrast, urinary and serum DPD, NTX and CTX are unaffected by collagen ingestion. Unlike most other bone markers, serum CTX values are influenced by food intake, and samples for this marker need to be taken in the fasting state.
The effect of acute exercise immediately or shortly before phlebotomy for bone turnover markers has been studied with some markers appearing to rise by as much as 30–40% of their baseline value, while others seem to be unaffected by these activities.
Variation Between Laboratories
Markers of bone turnover are now offered by a great number of commercial laboratories and in some countries are widely used by practising physicians. A recent trial amongst laboratories in Europe showed marked variability of most commercialised test kits, with inter-laboratory coefficients of variation up to 40%. Results obtained from identical blood and urine samples using the same assay and the same method differed by up to 5.6-fold between laboratories.136 Therefore, results from different laboratories cannot be readily compared to each other, even if the same method and sample has been used. Immunoassays for bone turnover markers should be included into routine proficiency testing programs.
Biological Sources of Variability
Intra-individual (i.e. biological) sources of variability are much harder to control then technical aspects of variability. Many biological factors cannot be modified at all (e.g age, gender, ethnicity etc.), while others are hard to control in clinical practice. Nevertheless, every effort should be made to account for these factors when interpreting the results of bone marker measurements.
Effects of Age and Changes in Sex Hormone Levels on Markers of Bone Remodelling
Once somatic growth subsides, the serum and urinary concentrations of most bone markers return to a level somewhat lower than that seen during normal puberty and growth. This stabilisation usually occurs during the 3rd decade and in healthy men, levels of practically all markers remain more or less unchanged until 70 years of age. After that, a slight increase is usually seen in formation markers such as serum BAP or OC, and most resorption markers.84,137–139
Menopause is associated with a substantial acceleration in bone turnover, which is mirrored by a 50–100% increase in both bone formation and bone resorption markers (Figure 9).137,139–148 In early postmenopausal women, this increase in bone turnover may be attenuated by calcium supplementation.149
Figure 9.
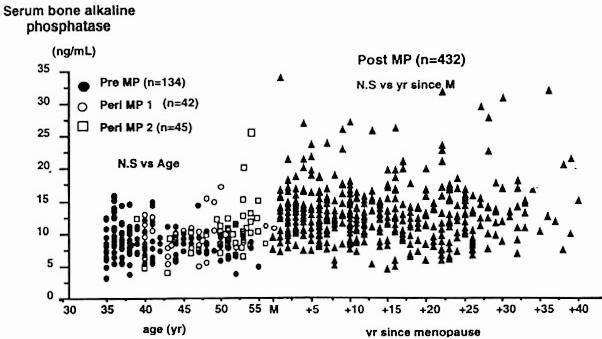
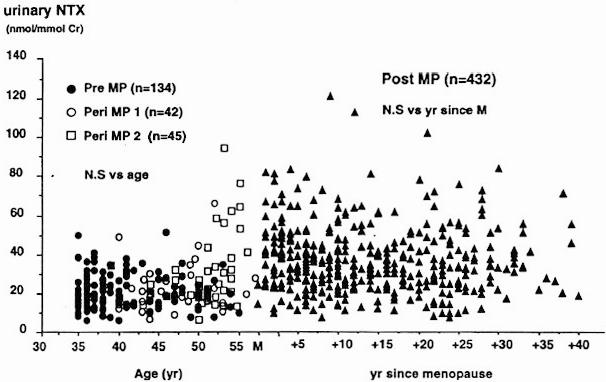
Age-related changes in (A) bone specific alkaline phosphatase and (B) urinary collagen type I aminoterminal crosslinked telopeptide (NTX). Pre, premenopausal women; peri MP 1, early perimenopausal women; peri MP 2, late peri-menopausal women; post MP, postmenopausal women; M, menopause. Reproduced from Garnero, P, Sornay-Rendu, E, Chapuy, M-C, Delmas, PD. Increased bone turnover in late postmenopausal women is a major determinant of osteoporosis. J. Bone Miner Res. 1996, 11, 337–49. With the permission of the American Society for Bone and Mineral Research.
Long-term treatment of women with oestrogen has been shown to reduce resorption markers such as DPD and NTx to premenopausal levels and to correct secondary hyperparathyroidism.150,151 A prospective study covering the perimenopausal transition in healthy women suggests that changes in bone turnover start during late pre-menopause with a decrease in bone formation, which is later followed by a rise in bone resorption.152 It is now widely accepted that the accelerated rate of bone loss seen after the menopause is mainly due to an uncoupling in bone turnover and an increase in bone resorption. Studies employing specific bone markers indicate that bone turnover continues to be increased (and to be associated with bone loss) even during late menopause.153 In some postmenopausal women, but particularly in the very elderly, this increase in bone turnover is often, but not always, found to be due to vitamin D and/or calcium deficiency and secondary hyperparathyroidism.154–156
In men, the pattern of age-dependent change in bone markers is quite different from that observed in women. Markers of bone formation and resorption are high in men aged 20 to 30 years which corresponds to the late phase of formation of peak bone mass. Thereafter they decrease reaching their lowest levels between 50 and 60 years (Figure 10).157–160 While there is general agreement on the age-related changes of bone turnover in adult men between 20 and 60 years of age, data on bone turnover rates in men over the age of 60 years are largely discordant. Based on recent cross-sectional studies, concentrations of bone formation markers remained unchanged, decreased, or increased with age in men over 60 years.157,158,160–163 Most studies evaluating age-related changes in bone resorption markers observed an increase in serum and urinary indices.157,158,160,163,164 However, this was not confirmed in other population-based studies which showed no change in resorption indices with age.159,165 A careful analysis of the published data provides clues that may help to explain some of these discrepancies. Differences in studies investigating age-dependent changes in bone formation and resorption may be related to diverse population characteristics and sample size, to the use of marker assays with different specificities, to age-related changes in renal and hepatic function, and lastly to the inclusion of men with osteoporosis.
Figure 10.
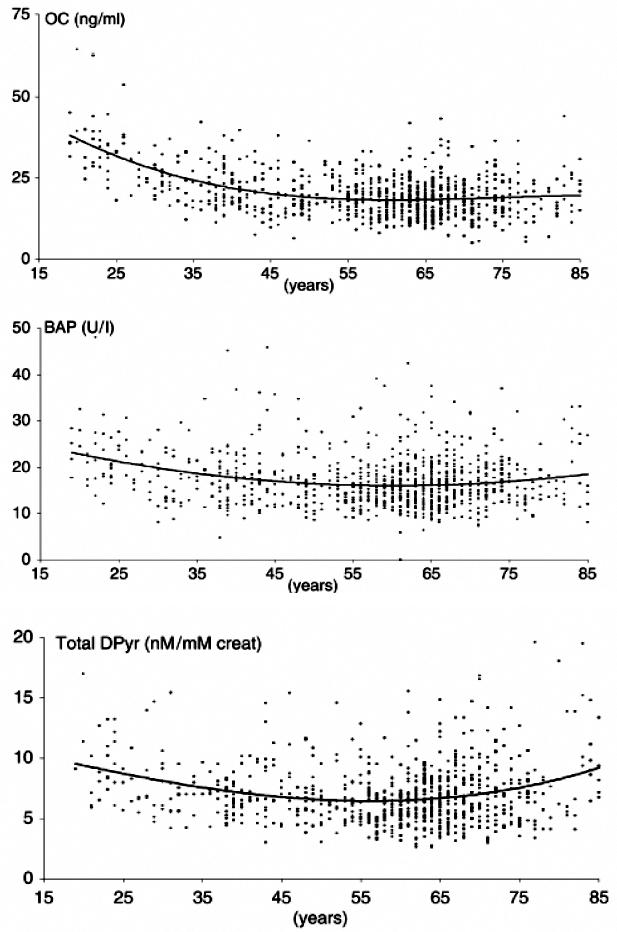
Age-related changes of biochemical markers of bone formation and resorption in men. (A) Serum osteocalcin, (B) Serum bone-specific alkaline phosphatase, and (C) 24-h urinary excretion of deoxypyridinoline. Reproduced from, Szulc, P, Garnero, P, Munoz, F, Marchand, F, Delmas, PD. Cross-sectional evaluation of bone metabolism in men. J Bone Miner Res. 2001, 16, 1642–50 with permission of the American Society for Bone and Mineral Research.
As some biochemical markers of bone turnover are cleared via by the kidney (i.e. OC, collagen telopeptides), age-associated decrease in glomerular filtration rate may affect urinary and, to a larger extent, serum marker concentrations. In the presence of decreased renal function, urinary excretion of bone resorption markers expressed as 24 hour output may be falsely decreased. Conversely, levels of markers corrected by urinary creatinine can be falsely increased because of decreased creatinine filtration and decreased muscle mass.166–168
Both static and dynamic histomorphometric studies suggest that bone formation decreases with age in healthy men. In contrast, osteoclast function remains largely constant with age. Consequently, decreased bone formation seems to be the principal factor in bone loss in men.168,169 In the cohort of healthy men studied by Clarke et al., specific markers of bone resorption (urinary DPD) did not change with age, confirming the histomorphometric findings that osteoclast function is preserved with increasing age in these men.170 These results are in contrast to some of the previously mentioned cross-sectional studies which report an age-dependent increase in serum and urinary indices of bone resorption.157–160,163,164,167–169
As mentioned before, differences in population characteristics may, at least in part, explain these inconsistencies. Furthermore, men with idiopathic osteoporosis are histomorphometrically characterised by increased bone resorption with an increase in eroded surfaces up to 90% when compared with age-matched controls.171 Hence, the observed increase in biochemical markers of bone resorption in population-based studies might also be due to the heterogeneity of men investigated including men with osteoporosis.
Taken together it remains controversial to what extent biochemical markers of bone resorption change as a function of age in men over 60 years. Observational studies investigating age-dependent changes in bone marker levels indicate that in elderly men there seems to be an imbalance in bone turnover with increased bone resorption and stable bone formation after the age of 60. As biochemical markers have been shown to be negatively correlated with BMD, this imbalance in bone turnover may, at least in part, be responsible for the age-related bone loss in men.158,167 However, confounding factors such as population characteristics, specificity of bone marker, as well as estimates of renal and liver function have to be taken into account when evaluating age-dependent changes in bone turnover.
Effects of Diurnal Variation on Bone Marker Measurements
Diurnal variation appears not to be affected by age, menopause, physical activity or season. Although in postmenopausal women bone turnover is higher than in premenopausal women, the circadian variation is similar for both pre- and postmenopausal women and, thus, is not thought to be influenced by sex hormones.138,172,173 The aetiology of diurnal variation is unknown. Several hormones, such as parathyroid hormone, growth hormone, or cortisol show diurnal changes and may therefore be involved in the generation of diurnal changes in bone metabolism.175 Independent of this, there is wide agreement that controlling the time of sampling is crucial in order to obtain clinically relevant information from bone markers. Most biochemical markers show significant diurnal variations, with highest values in the early morning hours and lowest values during the afternoon and at night. This has been well documented for most urinary markers and amplitudes usually vary between 20 and 30 % (Figure 8).127 Serum markers usually show less pronounced changes during the day than urine based indices. However, discrepant results have been reported for serum CTX. Wichers et al. have reported daily amplitudes of serum CTX of up to 66%, while others describe smaller changes (Figure 8D).134
Figure 8D.
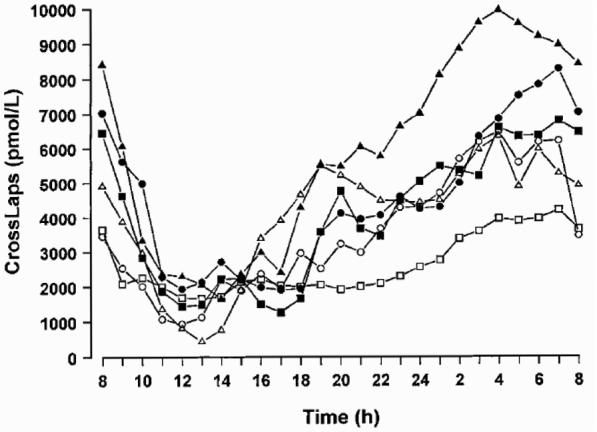
Diurnal variation in serum CTX levels in six healthy male volunteers. On average, the peak value was 66% higher and the nadir was 60% lower than the calculated daily mean. Reproduced from, Wichers M, Schmidt E, Bidlingmaier F, Klingmüller D. Diurnal rhythm of Crosslaps in human serum. Clin Chem 1999, 45, 1858–60. With the permission of Clinical Chemistry.
Effect of Low-Frequency Biological Rhythms on Bone Marker Measurements
Intra-individually, biochemical markers of bone turnover not only vary within a single day but in most cases also between consecutive days. This phenomenon is called between-day or day-to-day variability and is apparently due to genuine variations in marker levels and not to analytical imprecision. In general, serum markers show less day-today variability than markers of bone turnover measured in urine.175 The day-to-day variation in the urinary excretion of PYD and DPD, measured by HPLC and corrected for creatinine, ranges between 16–26%.176 Similar results have been reported for free pyridinoline by EIA (7–25%), for the N-terminal collagen type I telopeptide (NTX, 13–35%), for the C-terminal collagen type I telopeptide (CTX, 12–35%) and for tartrate-resistant acid phosphatase (TRAP, 10–12%).175,177 Day-to-day variability adds considerably to the total variation of biochemical markers of bone turnover and unlike diurnal variation, cannot be controlled.
Bone turnover varies with the menstrual cycle with an overall amplitude of approximately 10–20%.178,179 There is evidence to support the suggestion that bone formation is higher during the luteal than the follicular phase, whereas bone resorption is higher during the mid-follicular, late-follicular and early luteal phase.179,181 Cyclical changes in bone turnover have also been reported in postmenopausal women treated with sequential oestrogen/gestagen regimens, showing decreases during oestrogen treatment and increases during gestagen treatment.182 In premenopausal women with metabolic bone disease, menstrual variability should be taken into account, and the timing for sampling is probably best during the first 3–7 days of the menstrual cycle.
Bone turnover and its regulation seem to vary with seasonal changes. Some studies have shown that serum 25-OH vitamin D and urinary calcium are higher in summer than in winter, and that parathyroid hormone levels show inverse changes.182,183 More recently, seasonal changes were also described for markers of bone metabolism, with a 20–30 % lower turnover rate in summer than in winter (Figure 11)184 The increase in bone turnover in winter may be due, at least in part, to subclinical vitamin D deficiency.
Figure 11.

Seasonal variability of serum bone specific alkaline phosphatase (S-BAP) and urinary deoxypyridinoline (U-DPD). Values are presented as the percent change from the annual mean (±SEM). The number and width of representative intervals of each bone marker were computed as Δ = (Dmax − Dmin)/(1 + 3.322 x Ig n), in which Δ is the interval width, Dmax is the end of the analysis period (December 31), Dmin is the beginning of the analysis period (January l), n is the number of data points, and l + 3.322 x Ig n gives the number of intervals. After computing mean values and weighing the number of data points in each interval, graphs were constructed using the least square curve fitting by means of a polynomial regression. Data points (mean values ± SEM) are placed on the median of the respective interval (i.e. for S-BAP in males, January 25 represents the median of the first interval ranging from January l to February 15). Differences in the number and width of representative intervals between parameters result from missing laboratory values or elimination of extreme values in some instances. Reproduced from, Woitge, H, Scheidt-Nave, C, Kissling, C, et al. Seasonal variation of biochemical indices of bone turnover: results of a population based study. J Clin Endocrinol Metab. 1998;83:68–75. With permission from The Endocrine Society.
Effects of Somatic Growth
During early childhood and then again during the pubertal growth spurt, biochemical markers of bone turnover are significantly higher than during adulthood.188 In girls, peak bone marker levels are observed approximately two years earlier than in boys, and oestradiol seems to be the major determinant of the increase in bone turnover. In men between 20 and 30 years of age, bone turnover markers are usually higher than in women of the same age bracket. After the age of 50, most bone turnover markers tend to increase with further ageing, but less in men than in women. In the latter, the age-related increase in bone turnover is more pronounced due to the menopause, when both bone resorption and formation increase by about 50–100 %.186,187
Other Biological Sources of Variability
A number of non-skeletal diseases have been shown to strongly affect bone turnover markers. These conditions mostly relate to impairments in the clearance and/or metabolism of the components measured. Thus, even moderate impairment of renal function (GFR 50 ml/min) has been shown to have significant effects on the serum levels of OC, of BSP, and of the collagen type I telopeptides (NTX, CTX).108,188,189
In summary, numerous factors influence bone turnover, but there are even more sources of variability that need to be taken into account when measuring biochemical markers of bone turnover. To minimise some of the limitations linked to pre-analytical and analytical variability, standardised sampling and sample handling are mandatory to obtain reliable results. Controllable factors such as the mode of sample collection, sample handling and storage, diurnal and menstrual rhythms, pre-sampling exercise and pre-sampling diet should be taken care of wherever possible. Laboratories are encouraged to establish their own reference ranges and to use gender and age specific reference intervals. In order to further reduce variability, standardisation of bone marker assays and routine proficiency testing programs are strongly recommended.
How to Deal with Variability
If bone markers vary so much, how can we ever use them in our patients? Admittedly, most data on the use of bone markers have been generated in large populations or controlled clinical trials, which may not be representative of a routine clinical setting. However, bone markers can well be used in individual patients if methods are used that account for potential sources of variability and thus integrate the inherent limitations of bone markers measurements.
The Concept of Least Significant Change (LSC)
Numerous biological factors affect bone turnover and therefore bone marker levels (Table 2). As a rule, markers showing large changes in response to disease processes or interventions also show substantial degrees of biological variability. In the clinical setting, variability of bone markers should be of particular concern when it comes to serial measurements, for example during therapeutic monitoring. Often, a moderate reduction in a bone resorption marker is believed to be the effect of anti-resorptive treatment, when it really should be attributed to non-specific variability. However, a true (“significant”) response in either BMD or bone turnover can only be assumed, when within a single individual the change in signal is greater than the imprecision of the measurement. This change is called the “LSC”. LSC can be defined for various levels of confidence (e.g. 80% or 95%) and in large depends on the short- and long-term within subject variability (CV) of a given marker. The CV of bone formation markers is lower than that of most bone resorption markers, and so is their LSC. Thus, for formation markers, a change >25% should under regular circumstances be considered significant, while for most bone resorption markers (serum and urine) LSC is around 60–80%.
Another phenomenon to be considered when interpreting any serial measurement is the regression to the mean. This effect is independent from biological variability and relates to the changes in extreme baseline values.
The pronounced variability and heterogeneity of bone markers makes it difficult to determine precise thresholds or cut-offs for practical use in individual patients. In clinical medicine, two interrelated approaches are often used to assess the clinical significance of a change. These include a comparison of the actual difference to a predefined cut-off, and a comparison of the measured value to a predefined range.
The first method defines certain cut-off levels that a change in a marker must exceed to be considered “clinically significant”. Some models apply LSC or similar statistical approaches to define a-priori cut-offs.190 Other models have used the placebo and treatment groups of large randomised controlled trials (RCTs) and calculated the fracture incidence according to the change in a marker above or below a certain cut-off. For example, using data from the fracture intervention trial, Bauer et al. demonstrated that alendronate-treated women with a reduction in serum BALP of 30% or more at 1 year had fewer hip and non-spine (but not vertebral) fractures than alendronate-treated women with a 1 year change in serum BALP of less than 30%. However, when compared to the placebo group, there was no difference in the incidence of vertebral fractures between the alendronate-treated groups (>30% vs. <30% change at 1 year). In this instance, therefore, setting a 30% cut-off helped to define – a posteriori – a valid response to alendronate treatment for non-spine and hip fractures, but appears to be useless for vertebral fractures.194
Another widely used method to assess therapy-induced changes in laboratory parameters is to compare the actual marker level to a predefined range (similar to the T and Z score approach in bone mineral density [BMD]). In most instances, this range will be the ‘reference’ or ‘normal’ range, which may or may not be standardised between methods and/or laboratories. In the bone field, most people would agree that patients with accelerated bone turnover are likely to benefit from anti-resorptive treatment if their bone markers return to the respective ‘normal’, i.e. premenopausal range. Such a ‘normalisation” would be considered a valid response, while changes that do not lead to a return of the marker into the reference range would be labelled as an invalid response. Furthermore, a reduction of the marker below the reference range could be indicative of over-treatment.
A recent paper by Sambrook et al. illustrates the usefulness of this approach. In a double masked and double placebo controlled study, the authors compared the effects of alendronate 70 mg once weekly with raloxifene 60mg daily on markers of bone turnover in 487 postmenopausal women with low BMD.193 Both anti-resorptive agents reduced serum OC and urinary NTX-I levels after 1 year of treatment, but the effect was more pronounced for alendronate. Large RCTs have shown that both alendronate and raloxifene reduce fracture risk in women with low BMD. It is therefore interesting to note that in the head-to-head trial by Sambrook et al., both alendronate and raloxifene returned bone markers into their respective reference ranges.192
The problem with this method is that reference ranges for most markers have not been well defined. Also, a reduction into the ‘normal’ range can only be achieved if the pre-treatment values are abnormally high, which is the case in less then 50% of patients with osteoporosis. Clearly, the approach is also invalid for anabolic treatments, which increase both bone formation and resorption. Finally, standardisation of most assays is presently insufficient to provide a basis for a wider application of such a reference-based approach.136
| List of Abbreviations | |
|---|---|
| TAP | Serum total alkaline phosphatase |
| BAP or Bone ALP | Serum bone alkaline phosphatase |
| BMD | Bone mineral density |
| BSP | Bone sialoprotein |
| β-CTX-I | Epitope of C-terminal cross-linked telopeptide of collagen type I |
| DPD | Deoxypyridinoline |
| ICTP | Epitope of C-terminal cross-linked telopeptide of collagen type I |
| LSC | Least significant change |
| NTX-I | N-terminal cross-linked telopeptide of collagen type I |
| PICP | C-terminal propeptide of procollagen type I |
| PINP | N-terminal propeptide of procollagen type I |
| PTH | Parathyroid hormone |
| PTHrP | Parathyroid hormone-related peptide |
| PYD | Pyridinoline |
| TRAP or TRAcP | Tartrate-resistant acid phosphatase |
Footnotes
Competing interests: None declared
References
- 1.Lian JB and Stein GS. The cells of bone. In: Dynamics of bone and cartilage metabolism. Seibel MJ, Robins SP, Bilezikian JP (eds), Academic Press, San Diego; 1999, 165–86.
- 2.Rizzoli R and Bonjour JP. Physiology of calcium and phosphate homeostasis. In: Dynamics of bone and cartilage metabolism. Seibel MJ, Robins SP, Bilezikian JP (eds), Academic Press, San Diego; 1999, 247–60.
- 3.Stinson RA, Hamilton BA. Human liver plasma membranes contain an enzyme activity that removes membrane anchor from alkaline phosphatase and converts it to a plasma-like form. Clin Biochem. 1994;27:49–55. doi: 10.1016/0009-9120(94)90011-6. [DOI] [PubMed] [Google Scholar]
- 4.Harris H. The human alkaline phosphatases: what we know and what we don’t know. Clin Chim Acta. 1990;186:133–50. doi: 10.1016/0009-8981(90)90031-m. [DOI] [PubMed] [Google Scholar]
- 5.Crofton PM. Biochemistry of alkaline phosphatase isoenzymes. Crit Rev Clin Lab Sci. 1982;16:161–94. doi: 10.3109/10408368209107027. [DOI] [PubMed] [Google Scholar]
- 6.Koyama I, Miura M, Matsuzaki H, Sakagishi Y, Komoda T. Sugar-chain heterogeneity of human alkaline phosphatases: differences between normal and tumour-associated isoenzymes. J Chromatogr. 1987;413:65–78. doi: 10.1016/0378-4347(87)80214-1. [DOI] [PubMed] [Google Scholar]
- 7.Langlois MR, Delanghe JR, Kaufman JM, De Buyzere ML, Van Hoecke MJ, Leroux-Roels GG. Posttranslational heterogeneity of bone alkaline phosphatase in metabolic bone disease. Eur J Clin Chem Clin Biochem. 1994;32:675–80. doi: 10.1515/cclm.1994.32.9.675. [DOI] [PubMed] [Google Scholar]
- 8.Green S, Antiss CL, Fishman WH. Automated differential isoenzyme analysis. II. The fractionation of serum alkaline phosphatase into liver, intestinal, and other components. Enzymologia. 1971;41:9–26. [PubMed] [Google Scholar]
- 9.Van Hoof VO, Holyaerts MF, Geryl H, Van Mullem M, Lepoutre LG, De Broe ME. Age and sex distribution of alkaline phosphatase isoenzymes by agarose electrophoresis. Clin Chem. 1990;36:875–8. [PubMed] [Google Scholar]
- 10.Magnusson P, Larsson L, Magnusson M, Davie MW, Sharp CA. Isoforms of bone alkaline phosphatase: characterisation and origin in human trabecular and cortical bone. J Bone Miner Res. 1999;14:1926–33. doi: 10.1359/jbmr.1999.14.11.1926. [DOI] [PubMed] [Google Scholar]
- 11.Hill CS, Wolfert RL. The preparation of monoclonal antibodies which react preferentially with human bone alkaline phosphatase and not liver alkaline phosphatase. Clin Chem Acta. 1989;186:315–20. doi: 10.1016/0009-8981(90)90050-3. [DOI] [PubMed] [Google Scholar]
- 12.Rosalki SB, Foo AY. Two new methods for separating and quantifying bone and liver alkaline phosphatase isoenzymes in plasma. Clin Chem. 1984;30:1182–6. [PubMed] [Google Scholar]
- 13.Rosalki SB, Foo AY. Lectin affinity electrophoresis of alkaline phosphatase for the differentiation of bone hepatobiliary disease. Electrophoresis. 1987;10:604–11. doi: 10.1002/elps.1150100813. [DOI] [PubMed] [Google Scholar]
- 14.Crofton PM. Wheat-germ lectin affinity electrophoresis for alkaline phosphatase isoforms in children: age-dependent reference ranges and changes in liver and bone disease. Clin Chem. 1992;38:663–70. [PubMed] [Google Scholar]
- 15.Gomez B, Jr, Ardakani S, Ju J, et al. Monoclonal antibody assay for measuring bone-specific alkaline phosphatase activity in serum. Clin Chem. 1995;41:1560–6. [PubMed] [Google Scholar]
- 16.Martin M, Van Hoof V, Couttenye M, Prove A, Blokx P. Analytical and clinical evaluation of a method to quantify bone alkaline phosphatase, a marker of osteoblastic activity. Anticancer Research. 1997;17:3167–70. [PubMed] [Google Scholar]
- 17.Woitge H, Seibel MJ, Ziegler R. Comparison of total and bone-specific alkaline phosphatase in patients with nonskeletal disorders or metabolic bone disease. Clin Chem. 1996;42:1796–804. [PubMed] [Google Scholar]
- 18.Van Straalen JP, Sanders E, Prummel MF, Sanders GTB. Bone alkaline phosphatase as indicator of bone formation. Clin Chim Acta. 1991;201:27–34. doi: 10.1016/0009-8981(91)90021-4. [DOI] [PubMed] [Google Scholar]
- 19.Alpers DH, Goodwin CL, Young GP. Quantitation of human intestinal and liver/bone alkaline phosphatase in serum by rocket electroimmunoassay. Anal Biochem. 1984;140:129–37. doi: 10.1016/0003-2697(84)90143-x. [DOI] [PubMed] [Google Scholar]
- 20.Farley JR, Chesnut CH, III, Baylink DJ. Improved method for quantitative determination in serum of alkaline phosphatase of skeletal origin. Clin Chem. 1981;27:2002–7. [PubMed] [Google Scholar]
- 21.Gorman L, Statland BE. Clinical usefulness of alkaline phosphatase isoenzyme determinations. Clin Biochem. 1977;10:171–4. doi: 10.1016/s0009-9120(77)92552-8. [DOI] [PubMed] [Google Scholar]
- 22.Gallop PM, Lian JB, Hauschka PV. Carboxylated calcium-binding proteins and vitamin K. New Eng J Med. 1980;302:1460–6. doi: 10.1056/NEJM198006263022608. [DOI] [PubMed] [Google Scholar]
- 23.Hauschka PV, Lian JB, Cole DE, Gundberg C. Osteocalcin and matrix Gla protein: vitamin K-dependent proteins in bone. Physiol Rev. 1989;69:990–1047. doi: 10.1152/physrev.1989.69.3.990. [DOI] [PubMed] [Google Scholar]
- 24.Gundberg CM, Nishimoto SK. Vitamin K dependent proteins of bone and cartilage. In: Dynamics of Bone and Cartilage Metabolism, Seibel MJ, Robins SP, Bilezikian JP eds. Academic Press, San Diego;1999, 43–58.
- 25.Price PA. Vitamin K-dependent proteins. In: Calcium regulation and bone metabolism: basic and clinical aspects, Cohn D Ved, Elsevier Science, Amsterdam; 1987, p 419–25.
- 26.Ducy P, Desbois C, Boycem B, et al. Increased bone formation in osteocalcin-deficient mice. Nature. 1996;382:448–52. doi: 10.1038/382448a0. [DOI] [PubMed] [Google Scholar]
- 27.Brown JP, Delmas PD, Malaval L, et al. Serum bone Gla-protein: a specific marker for bone formation in postmenopausal osteoporosis. Lancet. 1984;1:1091–3. doi: 10.1016/s0140-6736(84)92506-6. [DOI] [PubMed] [Google Scholar]
- 28.Bouillon R, Vanderschueren D, Van Herck E, et al. Homologous radioimmunoassay of human osteocalcin. Clin Chem. 1992;38:2055–60. [PubMed] [Google Scholar]
- 29.Delmas PD, Stenner D, Wahner HW, et al. Increase in serum bone gamma-carboxyglutamic acid protein with aging in women. J Clin lnvest. 1983;71:1316–21. doi: 10.1172/JCI110882. [DOI] [PMC free article] [PubMed] [Google Scholar]
- 30.Gundberg CM, Wilson PS, Gallop PM, Parfitt AM. Determination of osteocalcin in human serum: results with two kits compared with those by a well-characterised assay. Clin Chem. 1985;31:1720–3. [PubMed] [Google Scholar]
- 31.Taylor AK, Linkhart SG, Mohan S, Baylink DJ. Development of a new radioimmunoassay for human osteocalcin: evidence for a midmolecule epitope. Metabolism. 1988;37:872–7. doi: 10.1016/0026-0495(88)90122-9. [DOI] [PubMed] [Google Scholar]
- 32.Monaghan DA, Power MJ, Fottrell PF. Sandwich enzyme immunoassay of osteocalcin in serum with use of an antibody against human osteocalcin. Clin Chem. 1993;39:942–7. [PubMed] [Google Scholar]
- 33.Parviainen M, Kuronen I, Kokko H, Lakaniemi M, Savolainen K, Mononen I. Two-site enzyme immunoassay for measuring intact human osteocalcin in serum. J Bone Miner Res. 1994;9:347–54. doi: 10.1002/jbmr.5650090309. [DOI] [PubMed] [Google Scholar]
- 34.Chen JT, Hosoda K, Hasumi K, Ogata E, Shiraki M. Serum N-terminal osteocalcin is a good indicator for estimating responders to hormone replacement therapy in postmenopausal women. J Bone Miner Res. 1996;11:1784–92. doi: 10.1002/jbmr.5650111123. [DOI] [PubMed] [Google Scholar]
- 35.Delmas PD, Malaval L, Arlot M, et al. Serum bone-Gla-protein compared to bone histomorphometry in endocrine diseases. Bone. 1985;6:339–41. doi: 10.1016/8756-3282(85)90326-6. [DOI] [PubMed] [Google Scholar]
- 36.Fournier B, Gineyts E, Delmas PD. Evidence that free gamma carboxyglutamic acid circulates in serum. Clin Chim Acta. 1989;182:173–82. doi: 10.1016/0009-8981(89)90076-4. [DOI] [PubMed] [Google Scholar]
- 37.Taylor AK, Linkhart S, Mohan S, et al. Multiple osteocalcin fragments in human urine and serum as detected by a midmolecule osteocalcin radioimmunoassay. J Clin Endocrinol Metab. 1990;70:467–72. doi: 10.1210/jcem-70-2-467. [DOI] [PubMed] [Google Scholar]
- 38.Baumgrass R, Williamson MK, Price PA. Identification of peptide fragments generated by digestion of bovine and human osteocalcin with the lysosomal proteinases cathepsin B, D, L, H, and S. J Bone Miner Res. 1997;12:447–55. doi: 10.1359/jbmr.1997.12.3.447. [DOI] [PubMed] [Google Scholar]
- 39.Gorai L, Hosoda K, Taguchi Y, et al. A heterogeneity in serum osteocalcin N-terminal fragments in Paget’s disease: Comparison with other biochemical indices in pre- and post-menopause. J Bone Miner Res. 1997;12 (S1):T678. doi: 10.1007/s002239900558. [DOI] [PubMed] [Google Scholar]
- 40.Page AE, Hayman AR, Andersson LMB, Chambers TJ, Warburton MJ. Degradation of bone matrix proteins by osteoclast cathepsins. Int J Biochem. 1993;25:545–50. doi: 10.1016/0020-711x(93)90662-x. [DOI] [PubMed] [Google Scholar]
- 41.Delmas PD, Christiansen C, Mann KG, Price PA. Bone Gla protein (osteocalcin) assay standardisation report. J Bone Miner Res. 1990;5:5–11. doi: 10.1002/jbmr.5650050104. [DOI] [PubMed] [Google Scholar]
- 42.Masters PW, Jones RG, Purves DA, Cooper EH, Cooney JM. Commercial assays for serum osteocalcin give clinically discordant result. Clin Chem. 1994;40:358–63. [PubMed] [Google Scholar]
- 43.Diaz Diego EM, Guerrero R, de la Piedra C. Six osteocalcin assays compared. Clin Chem. 1994;40:2071–7. [PubMed] [Google Scholar]
- 44.Dumon JC, Wantier H, Mathieu JJ, Body JJ. Technical and clinical validation of a new immunoradiometric assay for human osteocalcin. Eur J Endocrinol. 1996;135:231–7. doi: 10.1530/eje.0.1350231. [DOI] [PubMed] [Google Scholar]
- 45.Liu SH, Yang RS, al-Shaikh R, Lane JM. Collagen in tendon, ligament, and bone healing. A current review. Clin Orthop Relat Res. 1995. pp. 265–78. [PubMed]
- 46.Merry AH, Harwood R, Wooley DE, Grant ME, Jackson DS. Identification and partial characterisation of the non-collagenous amino- and carboxy-terminal extension peptides of cartilage procollagen. Biochem Biophys Res Commun. 1976;71:83–90. doi: 10.1016/0006-291x(76)90252-7. [DOI] [PubMed] [Google Scholar]
- 47.Fessler LI, Morris NP, Fessler JH. Procollagen: biological scission of amino and carboxy extension peptides. Proc Nat Acad Sci USA. 1975;72:4905–9. doi: 10.1073/pnas.72.12.4905. [DOI] [PMC free article] [PubMed] [Google Scholar]
- 48.Olsen BR, Guzman NA, Engel J, Condit C, Aase S. Purification and characterization of a peptide from the carboxy-terminal region of chick tendon procollagen type I. Biochemistry. 1977;16:3030–6. doi: 10.1021/bi00632a034. [DOI] [PubMed] [Google Scholar]
- 49.Smedsrod B, Melkko J, Risteli L, Risteli J. Circulating C-terminal propeptide of type I procollagen is cleared mainly via the mannose receptor in liver endothelial cells. Biochem J. 1990;271:345–50. doi: 10.1042/bj2710345. [DOI] [PMC free article] [PubMed] [Google Scholar]
- 50.Taubman MB, Goldberg B, Sherr C. Radioimmunoassay for human procollagen. Science. 1974;186:1115–7. doi: 10.1126/science.186.4169.1115. [DOI] [PubMed] [Google Scholar]
- 51.Melkko J, Niemi S, Risteli L, Risteli J. Radioimmunoassay of the carboxyterminal propeptide of human type I procollagen. Clin. Chem. 1990;36:1328–32. [PubMed] [Google Scholar]
- 52.Eriksen EF, Charles P, Meisen F, et al. Serum markers of type 1 collagen formation and degradation in metabolic bone disease: correlation with bone histomorphometry. J Bone Miner Res. 1993;8:127–32. doi: 10.1002/jbmr.5650080202. [DOI] [PubMed] [Google Scholar]
- 53.Hassager C, Jensen LT, Johansen JS, et al. The carboxy-terminal propeptide of type 1 procollagen in serum as a marker of bone formation: the effect of nandrolone decanoate and female sex hormones. Metabolism. 1991;40:205–8. doi: 10.1016/0026-0495(91)90176-w. [DOI] [PubMed] [Google Scholar]
- 54.Ebeling PR, Peterson JM, Riggs BL. Utility of type I procollagen propeptide assays for assessing abnormalities in metabolic bone diseases. J Bone Miner Res. 1992;7:1243–50. doi: 10.1002/jbmr.5650071118. [DOI] [PubMed] [Google Scholar]
- 55.Charles P, Mosekilde L, Risteli L, et al. Assessment of bone remodeling using biochemical indicators of type I collagen synthesis and degradation: relation to calcium kinetics. Bone Miner. 1994;24:81–94. doi: 10.1016/s0169-6009(08)80147-x. [DOI] [PubMed] [Google Scholar]
- 56.Lowry M, Hall D, Brosnan J. Hydroxyproline metabolism by the rat kidney: distribution of renal enzymes of hydroxyproline catabolism and renal conversion of hydroxyproline to glycine and serine. Metabolism. 1985;34:955–61. doi: 10.1016/0026-0495(85)90145-3. [DOI] [PubMed] [Google Scholar]
- 57.Kivirikko KI. Urinary excretion of hydroxyproline in health and disease. Int Rev Connect Tissue Res. 1970;5:93–163. doi: 10.1016/b978-0-12-363705-5.50008-7. [DOI] [PubMed] [Google Scholar]
- 58.Krane SM, Kantrowitz FG, Byrne M, Pinnell SR, Singer FR. Urinary excretion of hydroxylysine and its glycosides as an index of collagen degradation. J Clin Invest. 1977;59:819–27. doi: 10.1172/JCI108704. [DOI] [PMC free article] [PubMed] [Google Scholar]
- 59.Smith R. Collagen and disorders of bone. Clin Sci. 1980;59:215–23. doi: 10.1042/cs0590215. [DOI] [PubMed] [Google Scholar]
- 60.Prockop DJ, Kivirikko KI, Tuderman L, Guzman NA. The biosynthesis of collagen and its disorders. New Engl J Med. 1979;301:13–23. doi: 10.1056/NEJM197907053010104. [DOI] [PubMed] [Google Scholar]
- 61.Robins SP. Turnover of collagen and its precursors. In: Biology of Collagen, Viidik A, Vuust J (eds.), Academic Press, New York, 1980;135–51.
- 62.Cunningham LW, Ford JD, Segrest JP. The isolation of identical hydroxylysyl glycosides from hydroxylates of soluble collagen and from human urine. J Biol Chem. 1967;242:2570–1. [PubMed] [Google Scholar]
- 63.Moro L, Modricki C, Stagni N, et al. High performance liquid chromatography analysis of urinary hydroxylysine glycosides as indicators of collagen turnover. Analyst. 1984;109:1621–8. doi: 10.1039/an9840901621. [DOI] [PubMed] [Google Scholar]
- 64.Moro L, Noris-Suarez K, Michalsky M, Romanello M, de Bernard B. The glycosides of hydroxylysine are final products of collagen degradation in humans. Biochim Biophys Acta. 1993;1156:288–90. doi: 10.1016/0304-4165(93)90044-9. [DOI] [PubMed] [Google Scholar]
- 65.Segrest JP, Cunningham LW. Variations in human urinary O-hydroxylysyl glycoside levels and their relationship to collagen metabolism. J Clin Invest. 1970;49:1497–509. doi: 10.1172/JCI106367. [DOI] [PMC free article] [PubMed] [Google Scholar]
- 66.Bettica P, Moro L, Robins SP, et al. The comparative performance of urinary bone resorption markers: galactosyl hydroxylysine, pyridinium crosslinks, hydroxyproline. Clin Chem. 1992;38:2313–8. [PubMed] [Google Scholar]
- 67.Fujimoto D, Moriguchi T, Ishida T, Hayashi H. The structure of pyridinoline, a collagen crosslink. Biochem Biophys Res Commun. 1978;84:52–7. doi: 10.1016/0006-291x(78)90261-9. [DOI] [PubMed] [Google Scholar]
- 68.Robins SP. Fibrillogenesis and maturation of collagens. In: Dynamics of Bone and Cartilage Metabolism, Seibel MJ, Robins SP, Bilezikian JP eds. Academic Press, San Diego; 1999 p 31–42.
- 69.von der Mark K. Structure and Biosynthesis of Collagens. In: Dynamics of Bone and Cartilage Metabolism, Seibel M, Robins S, Bilezikian J eds. Academic Press, San Diego; 1999 p 3–30.
- 70.Gunja-Smith Z, Boucek RJ. Collagen crosslink components in human urine. Biochem J. 1981;197:759–62. doi: 10.1042/bj1970759. [DOI] [PMC free article] [PubMed] [Google Scholar]
- 71.Delmas PD, Schlemmer A, Gineyts E, et al. Urinary excretion of pyridinoline crosslinks correlates with bone turnover measured on iliac crest biopsy in patients with vertebral osteoporosis. J Bone Miner Res. 1991;6:639–44. doi: 10.1002/jbmr.5650060615. [DOI] [PubMed] [Google Scholar]
- 72.Eastell R, Colwell A, Hampton L, Reeve J. Biochemical markers of bone resorption compared with estimates of bone resorption from radiotracer kinetic studies in osteoporosis. J Bone Miner Res. 1997;12:59–65. doi: 10.1359/jbmr.1997.12.1.59. [DOI] [PubMed] [Google Scholar]
- 73.Colwell A, Russell R, Eastell R. Factors affecting the assay of urinary 3-hydroxy pyridinium crosslinks of collagen as markers of bone resorption. Eur J Clin Invest. 1993;23:341–49. doi: 10.1111/j.1365-2362.1993.tb02034.x. [DOI] [PubMed] [Google Scholar]
- 74.Boucek RJ, Noble NL, Gunja-Smith Z, Butler WT. The Marfan syndrome: a deficiency in chemically stable collagen crosslinking. New Engl J Med. 1981;305:988–91. doi: 10.1056/NEJM198110223051705. [DOI] [PubMed] [Google Scholar]
- 75.Eyre DR, Dickson IR, Van Ness KP. Collagen crosslinking in human bone and articular cartilage. Biochem J. 1988;252:495–500. doi: 10.1042/bj2520495. [DOI] [PMC free article] [PubMed] [Google Scholar]
- 76.Seibel MJ, Robins SP, Bilezikian JP. Urinary pyridinium crosslinks of collagen: specific markers of bone resorption in metabolic bone disease. Trends Endocrinol Metab. 1992;3:263–70. doi: 10.1016/1043-2760(92)90129-o. [DOI] [PubMed] [Google Scholar]
- 77.Kraenzlin EM, Seibel MJ. Measurement of biochemical markers of bone resorption. In: Dynamics of Bone and Cartilage Metabolism, Seibel MJ, Robins SP, Bilezikian JP eds. Academic Press, San Diego; 1999, 11–426.
- 78.Brixen K, Eriksen EF. Validation of local and systemic markers of bone turnover. In: Dynamics of Bone and Cartilage Metabolism, Seibel MJ, Robins SP, Bilezikian JP eds. Academic Press, San Diego; 1999, 427–36.
- 79.Black D, Duncan A, Robins SP. Quantitative analysis of the pyridinium crosslinks of collagen in urine using ion-paired reversed-phase high-performance liquid chromatography. Anal Biochem. 1988;169:197–203. doi: 10.1016/0003-2697(88)90274-6. [DOI] [PubMed] [Google Scholar]
- 80.Pratt DA, Daniloff Y, Duncan A, Robins SP. Automated analysis of the pyridinium crosslinks of collagen in tissue and urine using solid-phase extraction and reversed-phase high- performance liquid chromatography. Anal Biochem. 1992;207:168–75. doi: 10.1016/0003-2697(92)90519-d. [DOI] [PubMed] [Google Scholar]
- 81.James IT, Perrett D. Automated on-line solid-phase extraction and high-performance liquid chromatographic analysis of total and free pyridinium crosslinks in serum. J Chromatogr. 1998;79:159–66. doi: 10.1016/s0021-9673(97)01210-7. [DOI] [PubMed] [Google Scholar]
- 82.Robins SP, Duncan A, Riggs BL. Direct measurement of free hydroxy-pyridinium crosslinks of collagen in urine as new markers of bone resorption in osteoporosis. In: Osteoporosis 1990. Christiansen C, Overgaard K eds. Osteopress, Copenhagen; 1990 p 465–8.
- 83.Seyedin SM, Kung VT, Daniloff YN, et al. Immunoassay for urinary pyridinoline: the new marker of bone resorption. J Bone Miner Res. 1993;8:635–41. doi: 10.1002/jbmr.5650080515. [DOI] [PubMed] [Google Scholar]
- 84.Robins SP, Woitge H, Hesley R, Ju J, Seyedin S, Seibel MJ. Direct, enzyme-linked immunoassay for urinary deoxypyridinoline as a specific marker for measuring bone resorption. J Bone Miner Res. 1994;9:1643–9. doi: 10.1002/jbmr.5650091019. [DOI] [PubMed] [Google Scholar]
- 85.Delmas PD, Gineyts E, Bertholin A, Garnero P, Marchand F. Immunoassay of urinary pyridinoline crosslink excretion in normal adults and in Paget’s disease. J Bone Miner Res. 1993;8:643–8. doi: 10.1002/jbmr.5650080516. [DOI] [PubMed] [Google Scholar]
- 86.Risteli J, Niemi S, Elomaa I, Risteli L.Bone resorption assay based on a peptide liberated during type I collagen degradation J Bone Miner Res 19916S251, A670 [Google Scholar]
- 87.Risteli J, Risteli L. Products of bone collagen metabolism. In: Dynamics of Bone and Cartilage Metabolism. Seibel M, Robins S, Bilezikian J eds. Academic Press, San Diego, 1999, p 275–88.
- 88.Bonde M, Qvist P, Fledelius C, Riis BJ, Christiansen C. Immunoassay for quantifying type I degradation products in urine evaluated. Clin Chem. 1994;40:2022–5. [PubMed] [Google Scholar]
- 89.Fledelius C, Johnsen AH, Cloos PAC, Bonde M, Qvist P. Characterization of urinary degradation products derived from type I collagen. Identification of a beta-isomerized Asp-Gly sequence within the C-terminal telopeptide (alpha1) region. J Biol Chem. 1997;272:9755–63. doi: 10.1074/jbc.272.15.9755. [DOI] [PubMed] [Google Scholar]
- 90.Bonde M, Fledelius C, Qvist P, Christiansen C. Coated-tube radioimmunoassay for C-telopeptides of type I collagen to assess bone resorption. Clin Chem. 1996;42:1639–44. [PubMed] [Google Scholar]
- 91.Garnero P, Fledelius C, Gineyts E, et al. Decreased beta-isomerization of the C-terminal telopeptide of type I collagen alpha 1 chain in Paget’s disease of bone. J Bone Miner Res. 1997;12:1407–15. doi: 10.1359/jbmr.1997.12.9.1407. [DOI] [PubMed] [Google Scholar]
- 92.Cloos PAC, Fledelius C. Two New Bone Resorption Assays Measuring Racemized Protein Fragments: Measurement of Age-modified Peptides to Assess Bone Quality. Bone. 1998;23 (Suppl):T 114. [Google Scholar]
- 93.Cloos PAC, Fledelius C, Ovist P, Garnero P. Biological Clocks of Bone Aging: Racemisation and Isomerization, Potential Tools to Assess Bone Turnover. Bone. 1998;23 (Suppl.):F440. [Google Scholar]
- 94.Bonde M, Garnero P, Fledelius C, et al. Measurement of bone degradation products in serum using antibodies reactive with an isomerized form of an 8 amino acid sequence of the C-telopeptide of type I collagen. J Bone Miner Res. 1997;12:1028–34. doi: 10.1359/jbmr.1997.12.7.1028. [DOI] [PubMed] [Google Scholar]
- 95.Hanson DA, Weis MA, Bollen AM, Maslan SL, Singer FR, Eyre DR. A specific immunoassay for monitoring human bone resorption: quantitation of type I collagen cross-linked N-telopeptides in urine. J Bone Miner Res. 1992;7:1251–8. doi: 10.1002/jbmr.5650071119. [DOI] [PubMed] [Google Scholar]
- 96.Robins SP. Collagen crosslinks in metabolic bone disease. Acta Orthop Scand Suppl. 1995;266:171–5. [PubMed] [Google Scholar]
- 97.Woitge HW, Oberwittler H, Farahmand I, et al. Novel serum markers of bone resorption. J Bone Miner Res. 1999;14:792–801. doi: 10.1359/jbmr.1999.14.5.792. [DOI] [PubMed] [Google Scholar]
- 98.Fisher LW, Whitson SW, Avioli LW, Termine JD. Matrix sialoprotein of developing bone. J Biol Chem. 1983;258:12723–7. [PubMed] [Google Scholar]
- 99.Oldberg A, Franzen A, Heinegard D. Isolation and characterization of two sialoproteins present only in bone. Biochem J. 1985;232:715–24. doi: 10.1042/bj2320715. [DOI] [PMC free article] [PubMed] [Google Scholar]
- 100.Chen J, Shapiro HS, Wrana JL, Reimers S, Heersche J, Sodek J. Localization of bone sialoprotein (BSP) expression to sites of mineral tissue formation in fetal rat tissue by in situ hybridization. Matrix. 1991;11:133–43. doi: 10.1016/s0934-8832(11)80217-9. [DOI] [PubMed] [Google Scholar]
- 101.Bianco P, Fisher LW, Young MF, Termine JD, Robey PG. Expression of bone sialoprotein (BSP) in developing human tissues. Calcif Tissue Int. 1991;49(6):421–6. doi: 10.1007/BF02555854. [DOI] [PubMed] [Google Scholar]
- 102.Bellahcene A, Castronovo V. Expression of bone matrix proteins in human breast cancer: potential roles in microcalcification formation and in the genesis of bone metastases. Bull Cancer. 1997;84:17–24. [PubMed] [Google Scholar]
- 103.Ross FP, Chappel J, Alvarez JI, et al. Interactions between the bone matrix proteins osteopontin and bone sialoprotein and the osteoclast integrin αv β3 potentiate bone resorption. J Biol Chem. 1993;268:9901–7. [PubMed] [Google Scholar]
- 104.Hunter GK, Goldberg HA. Modulation of crystal formation by bone phosphoproteins: Role of glutamic acid-rich sequences in the nucleation of hydroxyapatite by bone sialoprotein. Biochem J. 1994;302:175–9. doi: 10.1042/bj3020175. [DOI] [PMC free article] [PubMed] [Google Scholar]
- 105.Saxne T, Zunino L, Heinegard D. Increased release of bone sialoprotein into synovial fluid reflects tissue destruction in rheumatoid arthritis. Arthritis Rheum. 1995;38:82–90. doi: 10.1002/art.1780380113. [DOI] [PubMed] [Google Scholar]
- 106.Karmatschek M, Woitge HW, Armbruster FP, Ziegler R, Seibel MJ. Improved purification of human bone sialoprotein and development of a homologous radioimmunoassay. Clin Chem. 1997;43:2076–82. [PubMed] [Google Scholar]
- 107.Fedarko NS, Fohr B, Robey PG, Young MF, Fisher LW. Factor H binding to bone sialoprotein and osteopontin enables tumor cell evasion from complement-mediated attack. J Biol Chem. 2000;275:16666–72. doi: 10.1074/jbc.M001123200. [DOI] [PubMed] [Google Scholar]
- 108.Seibel MJ, Woitge HW, Pecherstorfer M, et al. Serum immunoreactive bone sialoprotein as a new marker of bone turnover in metabolic and malignant bone disease. J Clin Endocrinol Metab. 1996;81:3289–94. doi: 10.1210/jcem.81.9.8784085. [DOI] [PubMed] [Google Scholar]
- 109.Minkin C. Bone acid phosphatase: tartrate-resistant acid phosphatase as a marker of osteoclast function. Calcif Tissue Int. 1982;34:285–90. doi: 10.1007/BF02411252. [DOI] [PubMed] [Google Scholar]
- 110.Halleen JM, Karp M, Viloma S, et al. Two-site immunoassays for osteoclastic tartrate-resistant acid phosphatase based on characterisation of six monoclonal antibodies. J Bone Miner Res. 1999;14:464–9. doi: 10.1359/jbmr.1999.14.3.464. [DOI] [PubMed] [Google Scholar]
- 111.Halleen JM, Alatalo SL, Suominen H, Cheng S, Janckila AJ, Vaananen HK. Tartrate-resistant acid phosphatase 5b: a novel serum marker of bone resorption. J Bone Miner Res. 2000;15:1337–45. doi: 10.1359/jbmr.2000.15.7.1337. [DOI] [PubMed] [Google Scholar]
- 112.Kraenzlin ME, Lau KH, Liang L, et al. Development of an immunoassay for human serum osteoclastic tartrate-resistant acid phosphatase. J Clin Endocrinol Metab. 1990;71:442–51. doi: 10.1210/jcem-71-2-442. [DOI] [PubMed] [Google Scholar]
- 113.Cheung C, Panesar N, Haines C, Masarei J, Swaminathan R. Immunoassay of a tartrate-resistant acid phosphatase in serum. Clin Chem. 1995;41:679–86. [PubMed] [Google Scholar]
- 114.Bais R, Edwards JB. An optimized continuous-monitoring procedure for semiautomated determination of serum acid phosphatase activity. Clin Chem. 1976;22:2025–8. [PubMed] [Google Scholar]
- 115.Kafienah W, Bromme D, Buttle DJ, Croucher LJ, Hollander AP. Human cathepsin K cleaves native type I and II collagens at the N-terminal end of the triple helix. Biochem J. 1998;331:727–32. doi: 10.1042/bj3310727. [DOI] [PMC free article] [PubMed] [Google Scholar]
- 116.Li Z, Yasuda Y, Li W, et al. Regulation of collagenase activities of human cathepsins by glycosaminoglycans. J Biol Chem. 2004;279:5470–9. doi: 10.1074/jbc.M310349200. [DOI] [PubMed] [Google Scholar]
- 117.Gelb BD, Shi GP, Chapman HA, Desnick RJ. Pycnodysostosis, a lysosomal disease caused by cathepsin K deficiency. Science. 1996;273:1236–8. doi: 10.1126/science.273.5279.1236. [DOI] [PubMed] [Google Scholar]
- 118.Saftig P, Hunziker E, Wehmeyer O, et al. Impaired osteoclastic bone resorption leads to osteopetrosis in cathepsin-K-deficient mice. Proc Natl Acad Sci USA. 1998;95:13453–8. doi: 10.1073/pnas.95.23.13453. [DOI] [PMC free article] [PubMed] [Google Scholar]
- 119.Gowen M, Lazner F, Dodds R, et al. Cathepsin K knockout mice develop osteopetrosis due to a deficit in matrix degradation but not demineralization. J Bone Miner Res. 1999;14:1654–63. doi: 10.1359/jbmr.1999.14.10.1654. [DOI] [PubMed] [Google Scholar]
- 120.Goto T, Yamaza T, Tanaka T. Cathepsins in the osteoclast. J Electron Microsc. 2003;52:551–8. doi: 10.1093/jmicro/52.6.551. [DOI] [PubMed] [Google Scholar]
- 121.Lang M, Seibel MJ, Zipf A, Ziegler R. Influence of a new protease inhibitor on the stability of osteocalcin in serum. Clin Lab. 1996;42:5–10. [Google Scholar]
- 122.Colwell A, Hamer A, Blumsohn A, Eastell R. To determine the effects of ultraviolet light, natural light and ionizing radiation on pyridinium cross-links in bone and urine using high-performance liquid chromatography. Europ J Clin. Invest. 1996;26:1107–14. doi: 10.1046/j.1365-2362.1996.460602.x. [DOI] [PubMed] [Google Scholar]
- 123.Blumsohn A, Colwell A, Naylor KE, Eastell R. Effect of light and gamma-irradiation on pyridinolines and telopeptides of type I collagen in urine. Clin Chem. 1995;41:1195–7. [PubMed] [Google Scholar]
- 124.Karmatschek M, Woitge HW, Armbruster FP, Ziegler R, Seibel MJ. Improved purification of human bone sialoprotein and development of a homologous radioimmunoassay. Clin Chem. 1997;43:2076–82. [PubMed] [Google Scholar]
- 125.Walne AJ, James IT, Perret D. The stability of pyridinium crosslinks in urine and serum. Clin Chem. Acta. 1995;240:95–7. doi: 10.1016/0009-8981(95)06125-0. [DOI] [PubMed] [Google Scholar]
- 126.Heymsfield SB, Artega C, McManus BS, Smith J, Moffitt S. Measurements of muscle mass in humans: validity of the 24 hour urinary creatinine method. Am J Clin Nutr. 1983;37:478–94. doi: 10.1093/ajcn/37.3.478. [DOI] [PubMed] [Google Scholar]
- 127.Mautalen CA. Circadian rhythm of urinary total and free hydroxyproline excretion and its relation to creatinine excretion. J Lab Clin Med. 1970;75:11–8. [PubMed] [Google Scholar]
- 128.Eastell R, Calvo MS, Burritt MF, Offord KP, Russell RG, Riggs BL. Abnormalities in circadian patterns of bone resorption and renal calcium conservation in type I osteoporosis. J Clin Endocrinol Metab. 1992;74:487–94. doi: 10.1210/jcem.74.3.1740481. [DOI] [PubMed] [Google Scholar]
- 129.Greenspan SL, Dresner-Pollak R, Parker RA, London D, Ferguson L. Diurnal variation of bone mineral turnover in elderly men and women. Calcif Tissue Int. 1997;60:419–23. doi: 10.1007/s002239900256. [DOI] [PubMed] [Google Scholar]
- 130.Li Y, Woitge W, Kissling C, et al. Biological variability of serum immunoractive bone sialoprotein. Clin Lab. 1998;44:553–5. [Google Scholar]
- 131.Jensen JE, Kollerup G, Sorensen A, Sorensen OH. Intraindividual variability of bone markers in the urine. Scand J Clin Lab Invest Suppl. 1997;57:29–34. [PubMed] [Google Scholar]
- 132.Sarno M, Powell H, Tjersland G, Schoendorfer D, et al. A collection method and high-sensitivity enzyme immunoassay for sweat pyridinoline and deoxypyridinoline crosslinks. Clin Chem. 1999;45:1501–9. [PubMed] [Google Scholar]
- 133.Schlemmer A, Hassager C. Acute fasting diminishes the circadian rhythm of biochemical markers of bone resorption. Eur J Endocrinol. 1999;140:332–7. doi: 10.1530/eje.0.1400332. [DOI] [PubMed] [Google Scholar]
- 134.Wichers M, Schmidt E, Bidlingmaier F, Klingmüller D. Diurnal rhythm of Crosslaps in human serum. Clin Chem. 1999;45:1858–60. [PubMed] [Google Scholar]
- 135.Lang M, Haag P, Schmidt-Gayk H, Seibel MJ, Ziegler R. Influence of ambient storage conditions and of diet on the measurement of biochemical markers of bone turnover. Calcif Tissue Int. 1995;56:497. [Google Scholar]
- 136.Seibel MJ, Lang M, Geilenkeuser WJ. Interlaboratory variation of biochemical markers of bone turnover. Clin Chem. 2001;47:1443–50. [PubMed] [Google Scholar]
- 137.Beardsworth LJ, Eyre DR, Dickson IR. Changes with age in the urinary excretion of lysyl- and hydroxylysyl-pyridinoline, two new markers of bone collagen turnover. J Bone Miner Res. 1990;5:671. doi: 10.1002/jbmr.5650050702. [DOI] [PubMed] [Google Scholar]
- 138.Eastell R, Simmons PS, Colwell A, et al. Nyctohemeral changes in bone turnover assessed by serum bone Gla-protein concentration and urinary deoxypyridinoline excretion: effects of growth and ageing. Clin Sci (Lond) 1992;83:375–82. doi: 10.1042/cs0830375. [DOI] [PubMed] [Google Scholar]
- 139.Seibel M, Woitge H, Scheidt NC, et al. Urinary hydroxypyridinium crosslinks of collagen in population-based screening for overt vertebral osteoporosis: results of a pilot study. J Bone Miner Res. 1994;9:1433–40. doi: 10.1002/jbmr.5650090916. [DOI] [PubMed] [Google Scholar]
- 140.Cantatore F, Carrozzo M, Magli D, D’Amore M, Pipitone V. Serum osteocalcin levels in normal humans of different sex and age. Panminerva Med. 1988;30:23–5. [PubMed] [Google Scholar]
- 141.Catherwood B, Marcus R, Madvig P, Cheung A. Determinants of bone gamma-carboxyglutamic acid-containing protein in plasma of healthy aging subjects. Bone. 1985;6:9–13. doi: 10.1016/8756-3282(85)90400-4. [DOI] [PubMed] [Google Scholar]
- 142.Eastell R, Calvo MS, Burritt MF, Offord KP, Russell RG, Riggs BL. Abnormalities in circadian patterns of bone resorption and renal calcium conservation in type I osteoporosis. J Clin Endocrinol Metab. 1992;74:487–94. doi: 10.1210/jcem.74.3.1740481. [DOI] [PubMed] [Google Scholar]
- 143.Epstein S, McClintock R, Bryce G, Poser J, Johnston CC, Jr, Hui S. Differences in serum bone Gla protein with age and sex. The Lancet. 1984 Feb 11;:307–10. doi: 10.1016/s0140-6736(84)90360-x. [DOI] [PubMed] [Google Scholar]
- 144.Galli M, Caniggia M. Osteocalcin in normal adult humans of different sex and age. Horm Metab Res. 1984;17:165–6. doi: 10.1055/s-2007-1013481. [DOI] [PubMed] [Google Scholar]
- 145.Garnero P, Delmas PD. Assessment of the serum levels of bone alkaline phosphatase with a new immunoradiometric assay in patients with metabolic bone disease. J Clin Endocrinol Metab. 1993;77:1046–53. doi: 10.1210/jcem.77.4.8104954. [DOI] [PubMed] [Google Scholar]
- 146.Hassager C, Risteli J, Risteli L, Christiansen C. Effect of the menopause and hormone replacement therapy on the carboxy-terminal pyridinoline cross-linked telopeptide of type I collagen. Osteoporos Int. 1994;4:349–52. doi: 10.1007/BF01622196. [DOI] [PubMed] [Google Scholar]
- 147.Midtby M, Magnus JH, Joakimsen RM. The Tromso Study: a population-based study on the variation in bone formation markers with age, gender, anthropometry and season in both men and women. Osteoporos Int. 2001;12:835–43. doi: 10.1007/s001980170034. [DOI] [PubMed] [Google Scholar]
- 148.Sgherzi M, Fabbri G, Bonati M, et al. Episodic changes of serume procollagen type I carboxy-terminal propeptide levels in fertile and postmenopausal women. Gynecol Obstet Invest. 1994;38:60–4. doi: 10.1159/000292448. [DOI] [PubMed] [Google Scholar]
- 149.Cleghorn DB, O’Loughlin PD, Schroeder BJ, Nordin BE. An open, crossover trial of calcium-fortified milk in prevention of early postmenopausal bone loss. Med J Aust. 2001;175:242–5. doi: 10.5694/j.1326-5377.2001.tb143554.x. [DOI] [PubMed] [Google Scholar]
- 150.McKane W, Khosla S, Risteli J, Robins S, Muhs J, Riggs B. Role of estrogen deficiency in pathogenesis of secondary hyperparathyroidism and increased bone resorption in elderly women. Proc Assoc Am Physicians. 1997;109:174–80. [PubMed] [Google Scholar]
- 151.Prestwood K, Pilbeam C, Burleson J, et al. The short-term effects of conjugated estrogen on bone turnover in older women. J Clin Endocrinol Metab. 1994;79:366–71. doi: 10.1210/jcem.79.2.8045949. [DOI] [PubMed] [Google Scholar]
- 152.Seifert-Klauss V, Mueller JE, Luppa P, et al. Bone metabolism during the perimenopausal transition: a prospective study. Maturitas. 2002;41:23–33. doi: 10.1016/s0378-5122(01)00248-1. [DOI] [PubMed] [Google Scholar]
- 153.Garnero P, Sornay-Rendu E, Chapuy M-C, Delmas PD. Increased bone turnover in late postmenopausal women is a major determinant of osteoporosis. J Bone Miner Res. 1996;11:337–49. doi: 10.1002/jbmr.5650110307. [DOI] [PubMed] [Google Scholar]
- 154.Mezquita-Raya P, Munoz-Torres M, Luna JD, et al. Relation between vitamin D insufficiency, bone density, and bone metabolism in healthy postmenopausal women. J Bone Miner Res. 2001;16:1408–15. doi: 10.1359/jbmr.2001.16.8.1408. [DOI] [PubMed] [Google Scholar]
- 155.Harris SS, Soteriades E, Dawson-Hughes B. Secondary hyperparathyroidism and bone turnover in elderly blacks and whites. J Clin Endocrinol Metab. 2001;86:3801–4. doi: 10.1210/jcem.86.8.7783. [DOI] [PubMed] [Google Scholar]
- 156.Sambrook PN, Chen JS, March LM, et al. Serum parathyroid hormone is associated with increased mortality independent of 25-hydroxy vitamin d status, bone mass, and renal function in the frail and very old: a cohort study. J Clin Endocrinol Metab. 2004;89:5477–81. doi: 10.1210/jc.2004-0307. [DOI] [PubMed] [Google Scholar]
- 157.Wishart JM, Need AG, Horowitz M, Morris HA, Nordin BE. Effect of age on bone density and bone turnover in men. Clin Endocrinol (Oxf) 1995;42:141–6. doi: 10.1111/j.1365-2265.1995.tb01854.x. [DOI] [PubMed] [Google Scholar]
- 158.Khosl S, Melton LJ, Atkinson EJ, O’Fallon WM, Klee GG, Riggs BL. Relationship of serum sex steroid levels and bone turnover markers with bone mineral density in men and women: a key role for bioavailable estrogen. J Clin Endocrinol Metab. 1998;83:2266–74. doi: 10.1210/jcem.83.7.4924. [DOI] [PubMed] [Google Scholar]
- 159.Orwoll ES, Bell NH, Nanes MS, et al. Collagen N-telopeptide excretion in men: the effects of age and intrasubject variability. J Clin Endocrinol Metab. 1998;83:3930–5. doi: 10.1210/jcem.83.11.5259. [DOI] [PubMed] [Google Scholar]
- 160.Fatayerji D, Eastell R. Age-related changes in bone turnover in men. J Bone Miner Res. 1999;14:1203–10. doi: 10.1359/jbmr.1999.14.7.1203. [DOI] [PubMed] [Google Scholar]
- 161.Tsai KS, Pan WH, Hsu SH, et al. Sexual differences in bone markers and bone mineral density of normal Chinese. Calcif Tissue Int. 1996;59:454–60. doi: 10.1007/BF00369210. [DOI] [PubMed] [Google Scholar]
- 162.Garnero P, Delmas PD. Assessment of the serum levels of bone alkaline phosphatase with a new immunoradiometric assay in patients with metabolic bone disease. J Clin Endocrinol Metab. 1993;77:1046–53. doi: 10.1210/jcem.77.4.8104954. [DOI] [PubMed] [Google Scholar]
- 163.Gallagher JC, Kinyamu HK, Fowler SE, Dawson-Hughes B, Dalsky GP, Sherman SS. Calciotropic hormones and bone markers in the elderly. J Bone Miner Res. 1998;13:475–82. doi: 10.1359/jbmr.1998.13.3.475. [DOI] [PubMed] [Google Scholar]
- 164.Clarke BL, Ebeling PR, Jones JD, et al. Predictors of bone mineral density in aging healthy men varies by skeletal site. Calcif Tissue Int. 2002;70:137–45. doi: 10.1007/s00223-001-1072-4. [DOI] [PubMed] [Google Scholar]
- 165.Sone T, Miyake M, Takeda N, Fukunaga M. Urinary excretion of type I collagen crosslinked N-telopeptides in healthy Japanese adults: age- and sex-related changes and reference limits. Bone. 1995;17:335–9. doi: 10.1016/s8756-3282(95)00243-x. [DOI] [PubMed] [Google Scholar]
- 166.Szulc P, Delmas PD. Biochemical markers of bone turnover in men. Calcif Tissue Int. 2001;69:229–34. doi: 10.1007/s00223-001-1059-1. [DOI] [PubMed] [Google Scholar]
- 167.Szulc P, Garnero P, Munoz F, Marchand F, Delmas PD. Cross-sectional evaluation of bone metabolism in men. J Bone Miner Res. 2001;16:1642–50. doi: 10.1359/jbmr.2001.16.9.1642. [DOI] [PubMed] [Google Scholar]
- 168.Szulc P, Munoz F, Claustrat B, et al. Bio available estradiol may be an important determinant of osteoporosis in men: the MINOS study. J Clin Endocrinol Metab. 2001;86:192–9. doi: 10.1210/jcem.86.1.7126. [DOI] [PubMed] [Google Scholar]
- 169.Aaron JE, Makins NB, Sagreiya K. The microanatomy of trabecular bone loss in normal aging men and women. Clin Orthop Relat Res. 1987;198:260–71. [PubMed] [Google Scholar]
- 170.Clarke BL, Ebeling PR, Jones JD, et al. Changes in quantitative bone histomorphometry in aging healthy men. J Clin Endocrinol Metab. 1996;81:2264–70. doi: 10.1210/jcem.81.6.8964862. [DOI] [PubMed] [Google Scholar]
- 171.Chavassieux P, Meunier PJ. Histomorphometric approach of bone loss in men. Calcif Tissue Int. 2001;69:209–13. doi: 10.1007/s00223-001-1047-5. [DOI] [PubMed] [Google Scholar]
- 172.Schlemmer A, Hassager C, Jensen SB, Christiansen C. Marked diurnal variation in urinary excretion of pyridinium cross-links in premenopausal women. J Clin Endocrinol Metab. 1992;74:476–80. doi: 10.1210/jcem.74.3.1740479. [DOI] [PubMed] [Google Scholar]
- 173.Schlemmer A, Hassager C, Pedersen B, Christiansen C. Posture, age, menopause, and osteopenia do not influence the circadian variation in the urinary excretion of pyridinium crosslinks. J. Bone Miner Res. 1994;9:1883–8. doi: 10.1002/jbmr.5650091207. [DOI] [PubMed] [Google Scholar]
- 174.Nielsen HK, Laurberg P, Brixen K, Mosekilde L. Relations between diurnal variations in serum osteocalcin, cortisol, parathyroid hormone, and ionised calcium in normal individuals. Acta Endocrinol (Copenh) 1991;124:391–8. doi: 10.1530/acta.0.1240391. [DOI] [PubMed] [Google Scholar]
- 175.Popp-Snijders C, Lips P, Netelenbos JC. Intra-individual variation in bone resorption markers in urine. Ann Clin Biochem. 1996;33:347–8. doi: 10.1177/000456329603300411. [DOI] [PubMed] [Google Scholar]
- 176.McLaren AM, Isdale AH, Whitings PH, Bird HA, Robins SP. Physiological variations in the urinary excretion of pyridinium crosslinks of collagen. Br J Rheumatol. 1993;32:307–12. doi: 10.1093/rheumatology/32.4.307. [DOI] [PubMed] [Google Scholar]
- 177.Blumsohn A, Hannon RA, al-Dehaimi AW, Eastell R. Short-term intraindividual variability of markers of bone turnover in healthy adults. J Bone Miner Res. 1994;9(Suppl.1):S153. [Google Scholar]
- 178.Nielsen HK, Brixen K, Bouillon R, Mosekilde L. Changes in biochemical markers of osteoblastic activity during the menstrual cycle. J Clin Endocrinol Metab. 1990;70:1431–7. doi: 10.1210/jcem-70-5-1431. [DOI] [PubMed] [Google Scholar]
- 179.Schlemmer A, Hassager C, Risteli J, Risteli L, Jensen SB, Christiansen C. Possible variation in bone resorption during the normal menstrual cycle. Acta Endocrinol (Copenh) 1993;129:388–92. doi: 10.1530/acta.0.1290388. [DOI] [PubMed] [Google Scholar]
- 180.Gorai I, Chaki O, Nakayama M, Minaguchi H. Urinary biochemical markers for bone resorption during the menstrual cycle. Calc Tiss Int. 1995;57:100–4. doi: 10.1007/BF00298428. [DOI] [PubMed] [Google Scholar]
- 181.Christiansen C, Riis BJ, Nilas L, Rodbro P, Deftos L. Uncoupling of bone formation and resorption by combined estrogen and progestagen therapy in postmenopausal osteoporosis. Lancet. 1985:800–1. doi: 10.1016/s0140-6736(85)90794-9. [DOI] [PubMed] [Google Scholar]
- 182.Scharla S, Scheidt-Nave C, Leidig G, Seibel MJ, Ziegler R. Lower serum 25-hydroxyvitamin D is associated with increased bone resorption markers and lower bone density at the proximal femur in normal females: a population-based study. Exp Clin Endocrinol Diabetes. 1996;104:289–92. doi: 10.1055/s-0029-1211456. [DOI] [PubMed] [Google Scholar]
- 183.Morgan DB, Rivlin RS, Davis R. Seasonal changes in the urinary excretion of calcium. Am J Clin Nutr. 1972;25:652–4. doi: 10.1093/ajcn/25.7.652. [DOI] [PubMed] [Google Scholar]
- 184.Woitge H, Scheidt-Nave C, Kissling C, et al. Seasonal variation of biochemical indices of bone turnover: results of a population based study. J Clin Endocrinol Metab. 1998;83:68–75. doi: 10.1210/jcem.83.1.4522. [DOI] [PubMed] [Google Scholar]
- 185.Stepan JJ, Tesarova A, Havranek T, Jodl J, Normankova J, Pacovsky V. Age and sex dependency of the biochemical indices of bone remodeling. Clin Chem Acta. 1985;151:273–83. doi: 10.1016/0009-8981(85)90090-7. [DOI] [PubMed] [Google Scholar]
- 186.Eastell R, Delmas PD, Hodgson SF, Eriksen EF, Mann KG, Riggs BL. Bone formation rate in older normal women: concurrent assessment with bone histomorphometry, calcium kinetics, and biochemical markers. J Clin Endocrinol Metab. 1988;67:741–8. doi: 10.1210/jcem-67-4-741. [DOI] [PubMed] [Google Scholar]
- 187.Kelly PJ, Pocock NA, Sambrook PN, Eisman JA. Age and menopause-related changes in indices of bone turnover. J Clin Endocrinol Metab. 1989;69:1160–5. doi: 10.1210/jcem-69-6-1160. [DOI] [PubMed] [Google Scholar]
- 188.Gundberg CM, Hanning R, Liu A, Zlotkin S, Balfe J, Cole D. Clearance of osteocalcin by peritoneal dialysis in children with end-stage renal disease. Pediatr Res. 1987;21:296–300. doi: 10.1203/00006450-198703000-00020. [DOI] [PubMed] [Google Scholar]
- 189.Woitge HW, Oberwittler H, Farahmand I, Lang M, Ziegler R, Seibel MJ. New serum assays for bone resorption. Results of a cross-sectional study. J Bone Miner Res. 1999;14:792–801. [Google Scholar]
- 190.Delmas PD. Markers of bone turnover for monitoring treatment of osteoporosis with antiresorptive drugs. Osteoporos Int. 2000;11 (Suppl 6):S66–6. doi: 10.1007/s001980070007. [DOI] [PubMed] [Google Scholar]
- 191.Bauer DC, Black DM, Garnero P, et al. Change in bone turnover and hip, non-spine, and vertebral fracture in alendronate-treated women: the fracture intervention trial. J Bone Miner Res. 2004;19:1250–8. doi: 10.1359/JBMR.040512. [DOI] [PubMed] [Google Scholar]
- 192.Sambrook PN, Geusens P, Ribot C, et al. Alendronate produces greater effects than raloxifene on bone density and bone turnover in postmenopausal women with low bone density: results of EFFECT (Efficacy of Fosamax versus Evista Comparison Trial) International J Intern Med. 2004;255:503–11. doi: 10.1111/j.1365-2796.2004.01317.x. [DOI] [PubMed] [Google Scholar]
- 193.Ju HS, Leung S, Brown B, et al. Comparison of analytical performance and biological variability of three bone resorption assays. Clin Chem. 1997;43:1570–6. [PubMed] [Google Scholar]