Abstract
Background
Anaemia is highly prevalent in children of developing countries. It is associated with impaired physical growth and mental development. Palmar pallor is recommended at primary level for diagnosing it, on the basis of few studies. The objective of the study was to systematically assess the accuracy of clinical signs in the diagnosis of anaemia in children.
Methods
A systematic review on the accuracy of clinical signs of anaemia in children. We performed an Internet search in various databases and an additional reference tracking. Studies had to be on performance of clinical signs in the diagnosis of anaemia, using haemoglobin as the gold standard. We calculated pooled diagnostic likelihood ratios (LR's) and odds ratios (DOR's) for each clinical sign at different haemoglobin thresholds.
Results
Eleven articles met the inclusion criteria. Most studies were performed in Africa, in children underfive. Chi-square test for proportions and Cochran Q for DOR's and for LR's showed heterogeneity. Type of observer and haemoglobin technique influenced the results. Pooling was done using the random effects model. Pooled DOR at haemoglobin <11 g/dL was 4.3 (95% CI 2.6–7.2) for palmar pallor, 3.7 (2.3–5.9) for conjunctival pallor, and 3.4 (1.8–6.3) for nailbed pallor. DOR's and LR's were slightly better for nailbed pallor at all other haemoglobin thresholds. The accuracy did not vary substantially after excluding outliers.
Conclusion
This meta-analysis did not document a highly accurate clinical sign of anaemia. In view of poor performance of clinical signs, universal iron supplementation may be an adequate control strategy in high prevalence areas. Further well-designed studies are needed in settings other than Africa. They should assess inter-observer variation, performance of combined clinical signs, phenotypic differences, and different degrees of anaemia.
Background
The global prevalence of anaemia is estimated in 2 billion people, that is, in about 30% of the worldwide population[1]. An even larger number of people present iron deficiency [1]. Every 9 of 10 persons affected of anaemia live in developing countries [2]. Anaemia prevalence in Latin America is 46% in children [3], with differences within countries. In Peru and Chile it is 50% and 8%, respectively [4,5].
Anaemia is related to impaired physical growth and mental development [6]. It is also associated to a higher risk of infant and child mortality, particularly when it co-exists with malnutrition and other risk factors [7].
It is therefore important to make a timely and accurate diagnosis and initiate an early intervention to reduce the negative impact of anaemia. The laboratory diagnosis of anaemia through any of several techniques is not widely available and its cost is often unaffordable in poor areas of the world. This stimulated several studies to assess the accuracy of clinical signs for screening of anaemia.
The Integrated Management of Childhood Illness (IMCI) strategy developed by the World Health Organization recommends the use of palmar pallor as the initial screening tool [8]. This recommendation is based mainly on the interpretation of results of studies performed in the Gambia [9], Kenya [10], and Malawi [11]. None of these studies showed in fact a clear superiority of palmar pallor. Only the Kenya study showed that palmar pallor performed better than conjunctival pallor when used by health workers but not by study physicians [10]. One of them used packed red cells volume as the gold standard [9]. Packed red cells volume is a controversial gold standard for anaemia, as it varies with different physiologic and pathologic conditions such as hydration status, and its correlation with haemoglobin is not optimal [12].
Thus we were prompted to perform a systematic review to assess the accuracy of clinical pallor in the diagnosis of anaemia. The specific objective of the study was to answer the question of whether there is a clinical sign that best predicts the presence or absence of anaemia in children. The signs most frequently assessed in primary studies are conjunctival, palmar and nailbed pallor. The review did not include respiratory and cardiovascular signs as they are unspecific for anaemia and are furthermore related to severe anaemia with haemodynamic repercussion.
Methods
The review was aimed to include all studies performed in children aged 0 through 18 years old fulfilling pre-established inclusion criteria.
Inclusion criteria
1. Studies on individual or combined accuracy of conjunctival, palmar or conjunctival pallor in the clinical diagnosis of anaemia.
2. Studies performed in children 0 through 18 years old.
3. Original articles. Review articles and letters to editors were not considered, except when they had enough information to assess the diagnostic performance of clinical signs of anaemia.
4. Prospective or retrospective studies performed in outpatient or inpatient children.
5. Articles with enough information to assess the diagnostic performance of clinical signs of anaemia, namely sensitivity, specificity, likelihood ratios and predictive values.
6. Studies in which haemoglobin was used as the gold standard.
Exclusion criteria
1. Studies not related to assessment of clinical signs in the diagnosis of anaemia.
2. Studies with insufficient information for deriving the diagnostic performance of clinical signs.
3. Studies in which it was not used a gold standard or those in which haemoglobin was not the gold standard
Search strategies
Two independent reviewers (JPC, CA) made an Internet search of the literature. The databases searched were the National Library of Medicine database from 1966 through January, 2002 and EMBASE from 1986 through January, 2002. In addition we searched the American and Caribbean Health Sciences Literature (Literatura Americana y del Caribe en Ciencias de la Salud, LILACS) database from 1986 through February, 2002 and the African Health Anthology database from 1924 through July, 2002. This search was combined with a manual tracking of articles deemed relevant and found in the references section of primary and qualitative review articles. Details of the key words used are presented as an appendix [See Additional File 1].
The abstracts of the primarily identified articles were read by the same two independent reviewers to assess whether they were related to the clinical diagnosis of anaemia. Those deemed to be relevant were then retrieved and read as full papers. Any discrepancy between the reviewers was solved by consensus.
Methodological quality of primary studies
We assessed the methodological quality of primary studies according to modified published recommendations [13]. The quality score was derived by ascribing 2 points for each of the major criteria related to systematic and blind application of clinical signs and gold standard to all patients, and 1 point for each of the remaining criteria. The maximum possible score was 16 and the minimum was 0. The final validity rating was reached by consensus. The quality criteria details are presented as an appendix [see Additional File 2].
Methods for calculating the diagnostic performance of index tests
Table 2 × 2 were reconstructed from the original data. Sensitivity, specificity, predictive values, and likelihood ratios with their corresponding 95% CIs were calculated for each primary study. Calculations were performed separately for each clinical sign and by different haemoglobin thresholds used in the primary studies. Whenever the 2 × 2 tables contained a 0 cell, 0.5 was added to all cells to avoid undefined results.
The diagnostic odds ratio (DOR) of each primary study was calculated according to the following formula [14]:
DOR = [Sensitivity/(1-sensitivity]/[(1-specificty)/specificity]
The DOR represents the ratio of the odds of a positive test result in subjects with the disease to the odds of a positive test result in subjects without the disease. A DOR of 1 means that the test has no discriminative power. When the DOR is more than one, the odds of a positive test result are higher in the diseased group.
Methods of homogeneity assessment
Studies were analyzed separately for homogeneity of results by clinical sign and by haemoglobin threshold through chi-square test for proportions (sensitivity and specificity), through Cochran Q for LR's and DOR's [15] and through DOR graphic plotting of individual studies, along with their 95% CI graphs [16].
Mathematical pooling
Pooled proportions (sensitivity and specificity) were calculated through the weighted averages taking into account the sample size of each study. Likewise, DOR's and LR's were pooled. The Mantel-Haenszel fixed effects model was planned to use if the studies were homogeneous for the diagnostic performance indexes and the DerSimonian Laird random effect model if they showed heterogeneity [17]. The 95% CIs were also calculated for all the pooled diagnostic indexes [16]. LR's and DOR's were recalculated after outlier's exclusion.
Diagnostic performance and 95% CIs of individual studies, homogeneity assessment, mathematical pooling and weighing were performed through the use of Metadisc software version Beta 1.1.1 [18].
Exploration of heterogeneity
Potential sources of heterogeneity on diagnostic performance were assessed through Metaregression [18]. Pre-specified potential influential covariates included clinical setting (outpatients or inpatients), continent of study (Africa, Asia, Latin America), age group (children up to 5 years old, children older than 5 years old), technique of haemoglobin measurement (Hemocue®, spectrophotometry, Coulter®), whether or not the study setting was endemic for malaria or for intestinal worms, type of observer (physician, nurse, technician, parents), and methodological quality score (continuous variable). For each haemoglobin threshold category and for each test, multivariate metaregression was run including the above signaled covariates to assess whether any of them showed a significant influence on lnDOR. The metaregression was weighted by study size and the threshold effect was not considered, as there were not additional cutoff points within each pre-specified haemoglobin threshold.
Post-test probabilities of anaemia
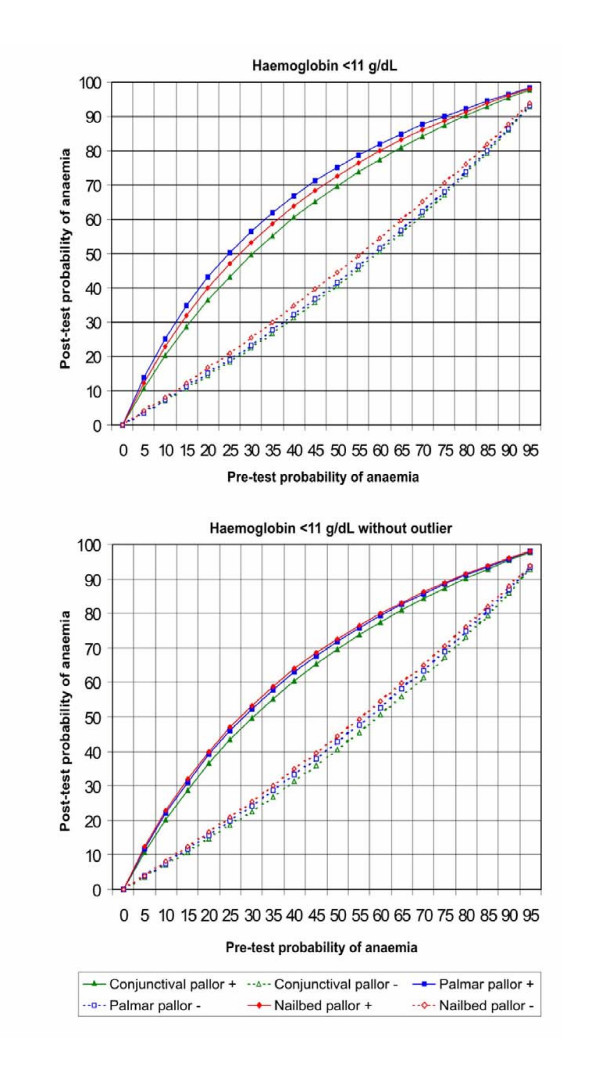
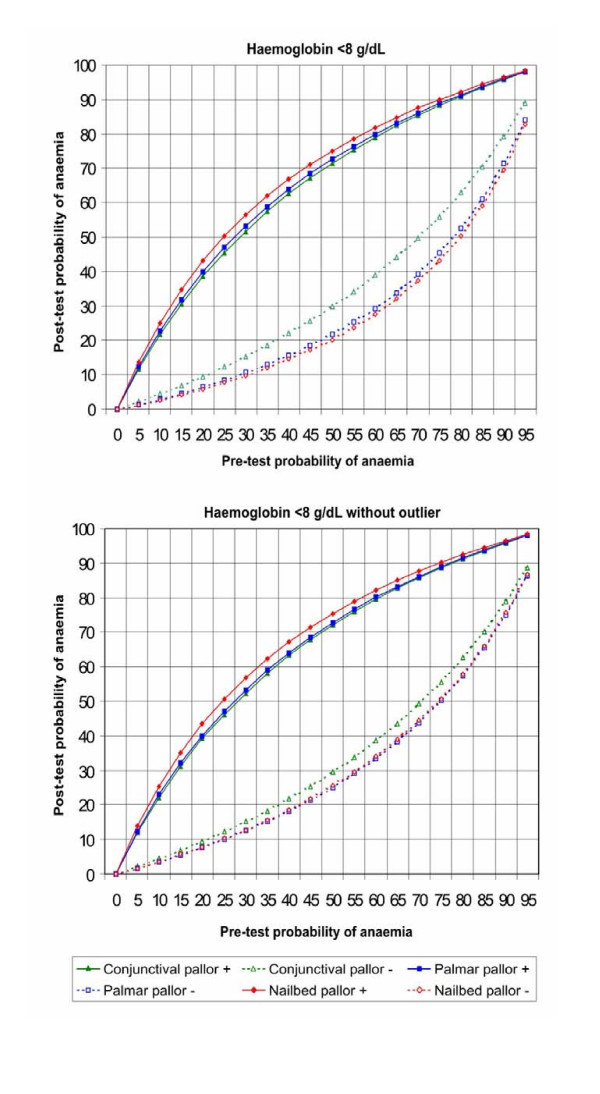
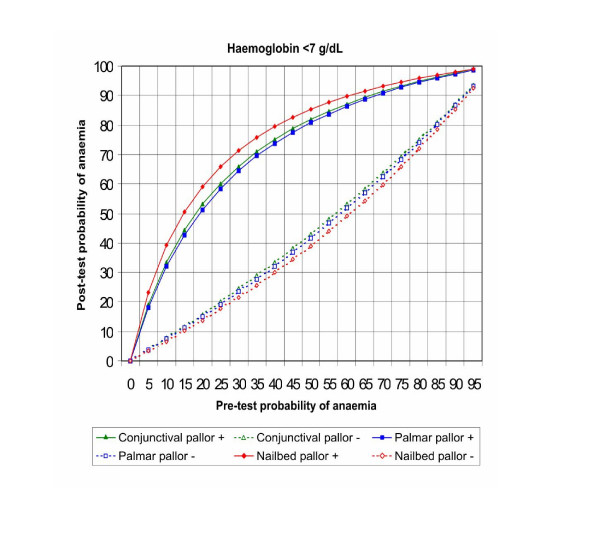
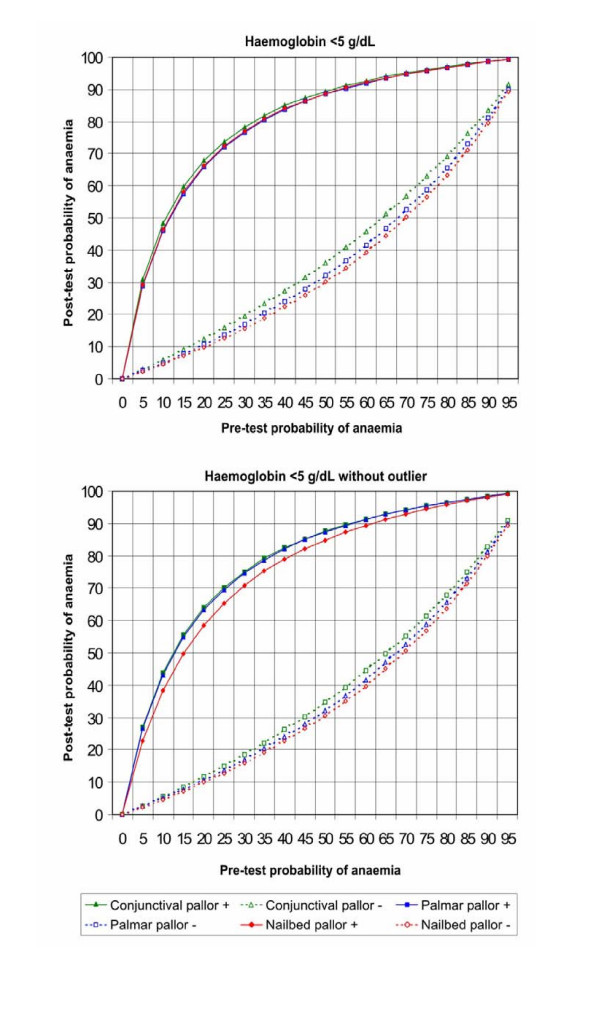
To graphically illustrate the relative usefulness of each particular clinical sign of anaemia at each haemoglobin threshold, different pre-test probability values were plotted against post-test probability values for both positive (LR+) and negative (LR-) results, before and after outlier's exclusion. The post-test probability for a disorder is another way to assess the value of a diagnostic test. It represents the chances that your patient has a disease. It incorporates information about the disease prevalence, the patient pool, and specific patient risk factors (pre-test probabilities) and information about the diagnostic test itself (the LR). The LR is used to assess how good a diagnostic test is and to help in selecting an appropriate diagnostic test(s) or sequence of tests. The LRs have advantages over sensitivity and specificity because they are less likely to change with the prevalence of the disorder, they can be calculated for several levels of the symptom/sign or test, they can be used to combine the results of multiple diagnostic test and they can be used to calculate the post-test probability for a target disorder. Post-test probabilities can be calculated for different clinical scenarios or settings with various possible pre-test probabilities (disease prevalence), using positive (LR+) and negative (LR-) results for the interest tests.
Results
Adapted QUORUM statement checklist and flow diagram of the study are included as an appendix [see Additional File 3].
Literature search
The number of primarily found articles was 225. Two hundred and two papers were excluded after abstract reading because they were nor relevant to the study objective. Twelve studies were excluded after reading them as full papers, because they were not performed in children (8 studies) [19-26], did not use haemoglobin as reference test (1) [27], did not assess individual signs of anaemia (1) [28], did not present separately results for children (1) [29], or did not perform clinical assessment of pallor (1) [30]. Finally, eleven articles were included in the meta-analysis [10,11,31-39].
All the studies we found had been performed in developing countries, mostly in children underfive. Eight were performed in Africa[10,11,31,35-39], one in Pakistan[32], one in Bangladesh and Uganda [34] and one in Brazil [33]. The Uganda component of one study was excluded as it used packed red cells volume as gold standard [34].
Most studies reported their results using pre-specified thresholds. All used one or more of the following haemoglobin categories: <11 g/dL, <8 g/dL, 7 g/dL, and < 5 g/dL. Only one study reported the results for 7 thresholds [36]. In this case, we re-constructed the results in the above noted 4 categories to allow the comparison of results with the other primary studies.
Table 1 summarizes main characteristics of primary studies, including the scores of methodological quality. There were studies that evaluated more than one sub-group of subjects and such results are shown separately.
Table 1.
Summary of primary studies characteristics
| Author | Year | Country | Location | Ages | Number | Setting | Pallor | Haemoglobin cut-off assessed (g/dL) |
| Wurapa FK31 | 1986 | Zambia | Rural | < 4 y | 12 | Outpatient | C | <11 |
| Thaver IH32 | 1994 | Pakistan | Urban | 6 m-5 y | 947 | Outpatient | C,N,P,T | <11 |
| Luby SP11 | 1995 | Malawi | Rural | < 6 y | 1104 | Outpatient | C,N,P,T | <11, <8, <5 |
| Sdepanian VL33 | 1996 | Brazil | Urban | 6 m-5 y | 143 | Outpatient | C,G,N,P,T | <11 |
| Kalter HD34 | 1997 | Bangladesh | Urban | 2 m-5 y | 482 | Emergency | C,P | <11, <8, <5 |
| Zucker JR10 | 1997 | Kenya | NS | 2 m-5 y | 1666 | Outpatient | C,N,P,T | <8, <5 |
| NS | 2 m-5 y | 1048 | Inpatient | C,N,P,T | <8, <5 | |||
| Stoltzfus RJ35 | 1999 | Tanzania | Urban | < 5 ya | 613 | Outpatient | C,N,P | <7, |
| Urban | < 5 yb | 537 | Outpatient | C,N,P | <7 | |||
| Urban | > 5 y | 3302 | Outpatient | C,N,P | <7 | |||
| Getaneh T36 | 2000 | Ethiopia | Urban | 2 m-5 y | 574 | Outpatient | C,N,P,T | <11, <8, <7, <5 |
| Muhe L37 | 2000 | Ethiopia | Rural | 2 m-5 y | 2540 | Outpatient | C,N,P,T | <8, <5 |
| Wamae CN38 | 2000 | Kenya | Rural | 2–4 y | 574 | Outpatient | P | <11 |
| Desai MR 29 | 2002 | Kenya | Rural | < 5 y | 3782 | Outpatient | C,G,N,P,T | <7, <5 |
| Observers | Kappa | Anaemia Prev. | Malaria area | Worm area | Haemoglobin Technique | Quality Score | ||
| Physicians | No | 16% | NS | NS | Coulter | 12 | ||
| Physicians | No | 78% | NS | NS | Hemocue | 12 | ||
| Health workers | No | 82% | NS | NS | Spectrophotometer | 13 | ||
| Paediatricians/Res. | No | 41% | NS | NS | Coulter | 11 | ||
| Paediatricians | No | 81% | No | NS | Hemocue | 11 | ||
| Physicians | No | 59% | NS | NS | Hemocue | 12 | ||
| Physicians | No | 91% | NS | NS | Hemocue | |||
| Health workers | No | 81% | NS | Yes | Hemocue | 14 | ||
| Health workers | No | 52% | NS | Yes | Hemocue | |||
| Health workers | No | 32% | NS | Yes | Hemocue | |||
| Nurses | Yes | 46% | Yes | Yes | Hemocue | 12 | ||
| Physicians | Yes | 61% | Yes | Ns | Hemocue | 13 | ||
| Health workers | No | 61% | Yes | Yes | Spectrophotometer | 12 | ||
| Parents | No | 66% | NS | NS | Hemocue | 14 | ||
NS: Not stated, C: Conjunctiva, N: Nailbed, P: Palm, T: Tongue, G: General, Res.: residents, Prev.: prevalence. a and b are referred to cohorts studied in 1996 and 1997, respectively.
Homogeneity assessment
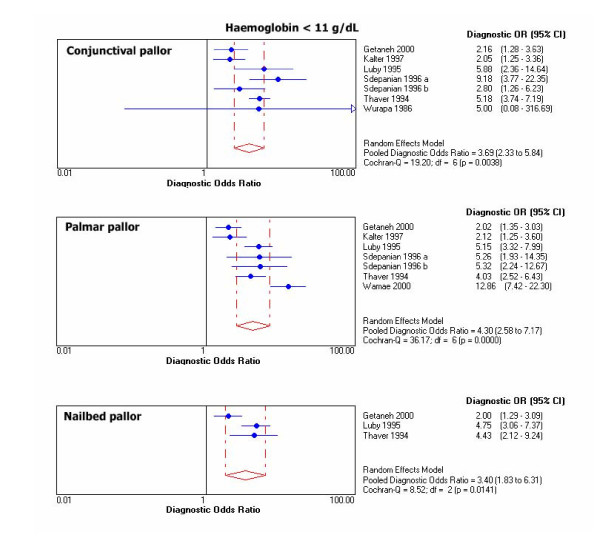
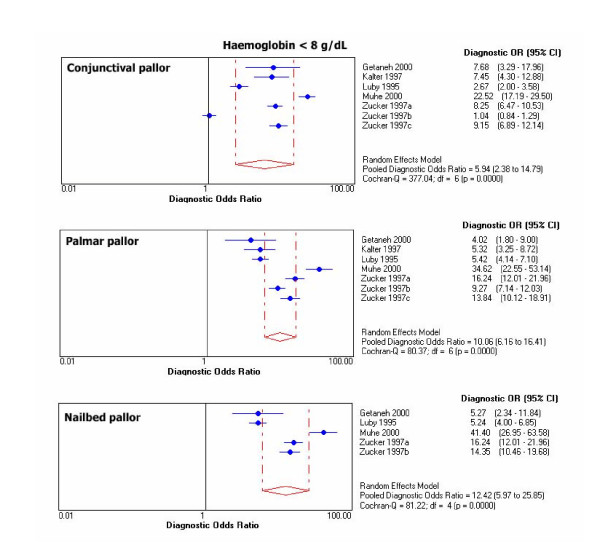
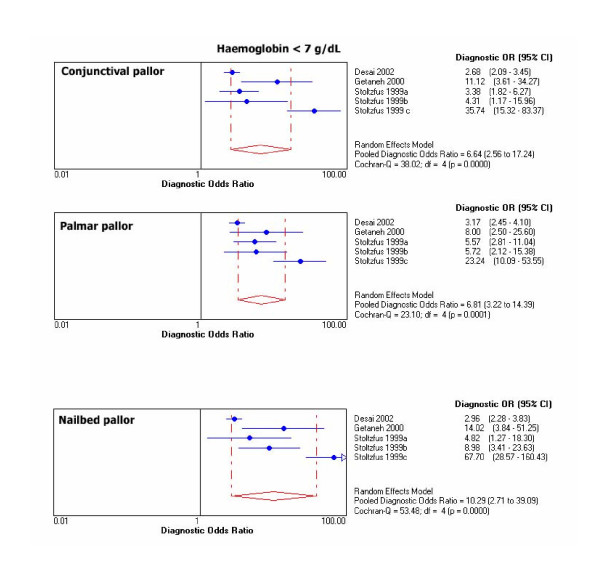
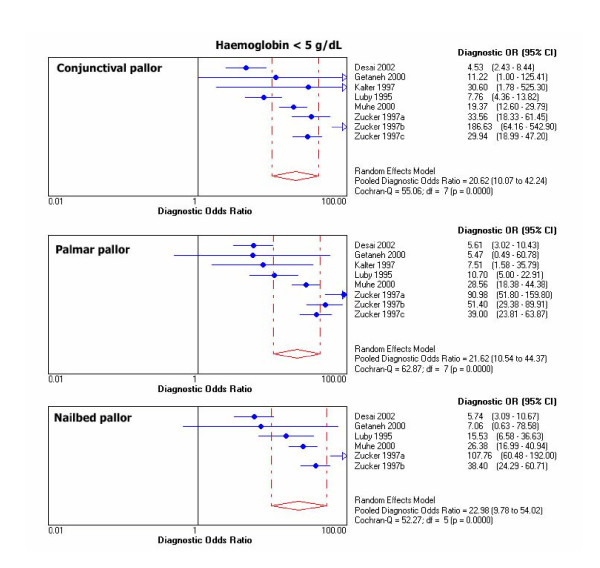
Chi-square test for proportions and Cochran Q for LR's and DOR's showed heterogeneity for results of primary studies within each threshold. For graphical display of the heterogeneity, 95% CIs for DOR's of individual studies are shown in Figure 1, 2, 3, 4.
Figure 1.
Individual and pooled DOR's at Hb <11 g/dL.
Figure 2.
Individual and pooled DOR's at Hb <8 g/dL.
Figure 3.
Individual and pooled DOR's at Hb <7 g/dL.
Figure 4.
Individual and pooled DOR's at Hb <5 g/dL.
Outliers at each haemoglobin category were identified through the DOR's graphs. Point estimates with confidence limits were plotted for each individual study. Those studies or results whose DOR's graphs were outside the 95% bounds of the pooled DOR were considered outliers. At haemoglobin <11 g/dL there was one outlier for palmar pallor [38]. At haemoglobin <8 g/dL there were 2 outliers for conjunctival pallor [10,37], one for nailbed [37], and one for palmar pallor [37]. At haemoglobin <5 g/dL there was 1 outlier for conjunctival pallor [39], 2 for palmar pallor [10,39], and one for nailbed pallor [39].
Mathematical pooling
As diagnostic performance of primary tests showed heterogeneity, mathematical pooling for them was calculated using the DerSimonian Laird random effects model, to incorporate variation among studies. With this method the weighted average of LR's and DOR's logs are calculated. Tables 2, 3, 4, 5 show the pooled sensitivities, specificities, LR's, DOR's with their 95% CIs. Table 6 shows the pooled LR's and DOR's after exclusion of outliers.
Table 2.
Pooled diagnostic performance markers at Hb <11 g/dL
| Clinical Pallor | Total N | Diseased | Sensitivity (95% IC) | Specificity (95% IC) | Likelihood Ratio+(CI, 95%) | Likelihood Ratio-(CI, 95%) | DOR (CI, 95%) | AUC* SROC** |
| Conjunctiva | 3195 | 2367 | 43.6(41.7–45.6) | 81.4(78.6–83.9) | 2.3(1.7–3.1) | 0.7(0.5–0.9) | 3.7(2.3–5.9) | 0.7058 |
| Palm | 3885 | 2731 | 39.2(37.4–41.1) | 86.7(84.6–88.5) | 3.0(2.0–4.6) | 0.7(0.6–0.8) | 4.3(2.6–7.2) | 0.7270 |
| Nailbed | 2534 | 1867 | 29.2(27.2–31.3) | 88.5(85.8–90.7) | 2.7(1.6–4.5) | 0.8(0.7–0.9) | 3.4(1.8–6.3) | 0.6942 |
*AUC: area under the curve, **SROC: Summary receiver operating characteristics curve.
Table 3.
Pooled diagnostic performance markers at Hb <8 g/dL
| Clinical Pallor | Total N | Diseased | Sensitivity (95% IC) | Specificity (95% IC) | Likelihood Ratio+(CI, 95%) | Likelihood Ratio-(CI, 95%) | DOR (CI, 95%) | AUC* SROC** |
| Conjunctiva | 8867 | 2711 | 70.8(69–72.5) | 69(67.8–70.1) | 2.5(1.5–4.1) | 0.4(0.3–0.7) | 5.9(2.4–14.8) | 0.7687 |
| Palm | 8998 | 2713 | 80.9(79.4–82.3) | 67.7(66.5–68.8) | 2.7(2.3–3.0) | 0.3(0.2–0.4) | 10.1(6.2–16.4) | 0.8274 |
| Nailbed | 6841 | 2043 | 79.7(77.9–81.4) | 71.2(69.9–72.4) | 3.0(2.5–3.6) | 0.3(0.1–0.5) | 12.4(5.9–25.9) | 0.8477 |
*AUC: area under the curve, **SROC: summary receiver operating characteristics curve.
Table 4.
Pooled diagnostic performance markers at Hb <7 g/dL
| Clinical Pallor | Total N | Diseased | Sensitivity (95% IC) | Specificity (95% IC) | Likelihood Ratio+(CI, 95%) | Likelihood Ratio-(CI, 95%) | DOR (CI, 95%) | AUC* SROC** |
| Conjunctiva | 8693 | 428 | 36.9(32.5–41.6) | 88.7(88–89.4) | 4.5(1.9–1.1) | 0.8(0.6–0.9) | 6.6(2.6–17.2) | 0.7821 |
| Palm | 8726 | 429 | 35.7(31.3–40.3) | 89.2(88.5–89.8) | 4.2(2.3–7.7) | 0.7(0.6–0.9) | 6.8(3.2–14.4) | 0.7851 |
| Nailbed | 8716 | 428 | 32.2(28–36.8) | 90.8(90.1–91.4) | 5.8(2.2–15.2) | 0.6(0.5–0.9) | 10.3(2.7–39.1) | 0.8297 |
*AUC: area under the curve, **SROC: summary receiver operating characteristics curve
Table 5.
Pooled diagnostic performance markers at Hb <5 g/dL
| Clinical Pallor | Total N | Diseased | Sensitivity (95% IC) | Specificity (95% IC) | Likelihood Ratio+(CI, 95%) | Likelihood Ratio-(CI, 95%) | DOR (CI, 95%) | AUC* SROC** |
| Conjunctiva | 12649 | 603 | 47.6(43.6–51.7) | 88.1(87.5–88.7) | 8.4(3.9–18.5) | 0.6(0.5–0.7) | 20.6(10.1–42.2) | 0.8889 |
| Palm | 12780 | 603 | 56.6(52.5–60.5) | 87.9(87.3–88.5) | 7.7(3.1–19.0) | 0.5(0.4–0.5) | 21.6(10.5–44.4) | 0.8922 |
| Nailbed | 10623 | 494 | 61.1(56.7–65.4) | 87.7(87.1–88.4) | 7.9(2.7–22.7) | 0.4(0.4–0.5) | 22.9(9.8–54.0) | 0.8964 |
*AUC: area under the curve, **SROC: summary receiver operating characteristics curve.
Table 6.
Pooled likelihood ratios and diagnostic odds ratios for index tests after excluding outliers
| Hb <11 g/dL | Hb <8 g/dL | Hb <5 g/dL | |||||||
| Clinical pallor | LR+ | LR- | DOR | LR+ | LR- | DOR | LR+ | LR- | DOR |
| Conjunctiva | --- | --- | --- | 2.6 | 0.4 | 6.4 | 7.1 | 0.5 | 19.7 |
| --- | --- | --- | (2.2 – 3.0) | (0.2 – 0.7) | (3.7 – 11.0) | (2.8 – 17.6) | (0.4 – 0.7) | (11.5 – 33.5) | |
| Palmar | 2.6 | 0.8 | 3.5 | 2.7 | 0.3 | 8.3 | 6.9 | 0.5 | 23.8 |
| (1.8 – 3.6) | (0.7 – 0.8) | (2.3 – 5.1) | (2.2 – 3.2) | (0.2 – 0.5) | (5.5 – 12.7) | (2.3 – 20.4) | (0.4 – 0.6) | (13.4 – 42.3) | |
| Nailbed | --- | --- | --- | 3.1 | 0.3 | 9.3 | 5.6 | 0.4 | 16.6 |
| --- | --- | --- | (2.3 – 4.2) | (0.2 – 0.6) | (4.9 – 17.7) | (2.1 – 15.3) | (0.4 – 0.6) | (7.7 – 35.9) | |
Numbers in parenthesis denote 95% CIs. Dotted lines (---) denote absence of outliers. Hb <7 g/dL did not have outliers.
Pooled DOR at haemoglobin <11 g/dL was 4.3 (95% CI 2.6–7.2) for palmar pallor, 3.7 (2.3–5.9) for conjunctival pallor, and 3.4 (1.8–6.3) for nailbed pallor. For the same haemoglobin threshold, pooled LR+ was 3.0 (95% CI 2.0–4.6) for palmar pallor, 2.7 (1.6–4.5) for nailbed pallor, 2.3 (1.7–3.1) for conjunctival pallor. Also for haemoglobin <11 g/dL, pooled LR- was 0.7 (CI 95% 0.6–0.8) for palmar pallor, 0.7 (0.5–0.9) for conjunctival pallor, and 0.8 (0.7–0.9) for nailbed pallor. DOR's and LR's were slightly better for nailbed pallor at all other haemoglobin thresholds. The pooled diagnostic parameters did not vary substantially after excluding outliers, except that the modest DOR superiority for palmar pallor at haemoglobin <11 g/dL disappeared and improved over the other signs at haemoglobin <5 g/dL (Table 6).
Exploration of heterogeneity
Method of haemoglobin measurement, type of examiner, continent, clinical setting (outpatients or inpatients) and quality score entered as covariates for most studies. Multivariate metaregression revealed that the only influential covariates on LnDOR for palmar pallor were type of observer (β = 3.16, p = 0.04; RDOR = 23.6, 95% CI = 1.05–531) and haemoglobin technique (β = -5.02, p = 0.03; RDOR = 0.01, 95% CI = 0.00–0.4) at haemoglobin <8 g/dL. There was not any other covariate significantly influencing on LnDOR for the other index clinical signs at any other haemoglobin threshold.
Post-test probabilities of anaemia
Figures 5, 6, 7, 8 show the post-test probabilities for each particular sign at different haemoglobin thresholds before and after exclusion of outliers. Mild anaemia accounts for the greatest burden of disease in the world. Thus, considering different possible settings according to anaemia prevalence (pre-test probability), we illustrate here some post-test probabilities for positive and negative results of clinical signs of anaemia at haemoglobin <11 g/dL (Figure 5). For a clinical sign present and at 8% of anaemia prevalence, the post-test probability of disease increased to 21% for palmar pallor, to 19% for nailbed pallor, and to 17% for conjunctival pallor. For the same threshold and at 50% of anemia prevalence, the post-test probability increased to 75% for palmar pallor, to 73% for nailbed pallor, and to 70% for conjunctival pallor. And at 80% of anemia prevalence, the post-test probability of disease increased to 92% for palmar and nailbed pallor, and to 90% for conjunctival pallor. Like for DOR's and LR's, the discrete superiority of palmar pallor disappeared when outliers were excluded (Figure 5). At the same haemoglobin threshold (<11 g/dL), when a sign was absent, the post-test probability decrease was modest for any of the clinical signs of anaemia (Figure 5). The same trend was observed at other haemoglobin thresholds (Figures 6, 7, 8). Again, the exclusion of outliers did not change substantially the post-test probabilities.
Figure 5.
Post-test probabilities of positive and negative results of clinical signs of anaemia for different pre-test probabilities, at Hb<11 g/dL, with and without outliers.
Figure 6.
Post-test probabilities for positive and negative results of clinical signs of anaemia for different pre-test probabilities, at Hb<8 g/dL, with and without outliers.
Figure 7.
Post-test probabilities of positive and negative results of clinical signs of anaemia for different pre-test probabilities, at Hb<7 g/dL (no outliers were found).
Figure 8.
Post-test probabilities of positive and negative results of clinical signs of anaemia for different pre-test probabilities, at Hb<5 g/dL, with and without outliers.
Discussion
We did not find a highly accurate clinical sign for diagnosing anaemia. Palmar pallor was modestly superior at haemoglobin less than 11 g/dL and nailbed was slightly superior at all other haemoglobin thresholds. After exclusion of outliers, nailbed pallor performed slightly better than the other signs, except at haemoglobin less than 5 g/dL, where palmar pallor improved somewhat over conjunctival and nailbed pallor.
Sensitivity of clinical signs ranged widely from 29.2% through 80.9% at different haemoglobin thresholds. Only palmar pallor showed 80.9% of sensitivity at haemoglobin less than 8 g/dL. And only nailbed pallor reached a 90.8% of specificity at haemoglobin less than 7 g/dL. This means that the rates of false positive and false negative results are unacceptably high for the clinical diagnosis of anaemia. The prevalence of asymptomatic anaemia in children may be as high as 87% in some areas of the world such south-eastern Tanzania [40]. Iron supplementation for all children in such a setting with a silent burden of anaemia has been suggested as a control strategy [40]. This can be associated with periodical deworming in tropical and subtropical countries [41].
A technical document supporting the use of palmar pallor as part of IMCI guidelines states that for detection of severe anaemia clinical signs should be as sensitive and specific as possible, to avoid missing referral for a potentially life-saving blood transfusion, and to avoid unnecessary referrals which would burden the families and the health facilities [8]. We did not find high values of sensitivity and specificity for any of the clinical signs of anaemia. Palmar pallor, the recommended sign, did not perform particularly better. The pooled sensitivities are higher and the pooled specificities lower than those for more severe anaemia. This is due to the fact that different studies did not assess necessarily the same haemoglobin cut-offs, which is shown in Table 1. By contrast, the diagnostic odds ratio, which constitutes a single test performance indicator, increases at lower haemoglobin cut-off values. This is one of the reasons we chose to include DOR's as another summary statistics for pooling accuracy of clinical signs in our study. In addition, DOR offers the advantage of overcoming the under-estimation of diagnostic accuracy that often occurs if one pools the results of primary studies just in terms of sensitivity and specificity.
We further explored whether the post-test probabilities of anaemia changed substantially when clinical signs were present or absent for different prevalences of the condition (pre-test probabilities). Pre-test probabilities of 50% and 8% represent the anaemia prevalence of Peru and Chile, respectively [4,5], and 80% is close to prevalence recently reported in southern Tanzania [40]. At haemoglobin less than 11 g/dL, post-test probabilities of anaemia did not show a substantial change in presence or absence of clinical signs, except in a scenario with 8% of prevalence. On an individual basis, a good clinical sign would lead correctly, when present, to prescribe iron and conversely, when absent, to withhold it. On the other side, an accurate diagnosis of severe anaemia should lead to a prompt referral for blood transfusion and additional interventions depending on the underlying causes of anaemia. However, at haemoglobin less than 5 g/dL, post-test probabilities of disease when a clinical sign was present increased up to 5 times only in a scenario with 8% of anaemia prevalence, but less than the double in scenarios with 50% and 80% of prevalence. The post-test probabilities decreased only slightly when a clinic sign was absent, at both haemoglobin less than 11 and 5 g/dL, irrespective of anaemia prevalence. Thus, this meta-analysis does not support the recommendation of taking a management decision on the basis of presence or absence of any of the clinical signs of anaemia assessed.
There are some limitations of primary studies included that may have influenced on the results of the meta-analysis. First, most studies did not assess inter-observer variation. Due to the subjective component in the appreciation of clinical pallor, it is important to quantify this factor. Second, most studies were performed in Africa, limiting their generalizability to other regions of the world due to phenotypic differences, varying anaemia prevalence and different causes such as malaria and intestinal parasitosis. For instance, it has been documented that a greater palmar pigmentation in Bangladesh was associated with a decreased sensitivity of palmar pallor [34]. In addition, high rates of blepharoconjunctivitis may obscure conjunctival pallor and also decrease its sensitivity [42]. Third, the diagnostic accuracy of combined signs was rarely performed [32,34]. Combining signs may increase the performance of clinical signs, even if such an evaluation may also increase in complexity. Trade-offs between combination of clinical signs and complexity of evaluation should be considered if combined signs display better diagnostic accuracy.
Conclusion
We did not find a highly accurate clinical sign of anaemia. In view of poor performance of clinical signs, universal iron supplementation of children may be an adequate control strategy at public health level, particularly in high prevalence areas, as was recently suggested [40]. Further well-designed studies are needed for settings other than Africa.
They should assess inter-observer variation, performance of combined clinical signs, phenotypic differences and different degrees of anaemia.
Competing interests
Luis Huicho is one of the principal investigators of the Multi-Country Evaluation of Integrated Management of Childhood Illness (IMCI), coordinated by the Department of Child and Adolescent Health of WHO and supported by the Bill and Melinda Gates Foundation and the US Agency for International Development. This project is aimed at evaluating the impact, cost and effectiveness of IMCI.
No other conflict of interest declared by any other author.
Authors' contributions
J.PC took part in conception, design, data collection, management and analysis; LH in conception, design, data management and analysis; CA in data collection and analysis; NYC and CAB in data analysis. All authors contributed to interpretation of the data and writing of the report.
Pre-publication history
The pre-publication history for this paper can be accessed here:
Supplementary Material
Key words used in the search. details of key words used in the search
Criteria for the assessment of the methodological quality of primary studies. Details of the quality criteria and scores ascribed for each of them
Adapted QUORUM statement checklist and flow diagram of the systematic review. It includes the completed QUORUM statement checklist and the flowchart
Acknowledgments
Acknowledgements
Thanks are due to Juan José Chalco and Bertha Huarez for assistance in edition of figures.
Contributor Information
Juan P Chalco, Email: jpcho33@yahoo.com.
Luis Huicho, Email: lhuicho@viabcp.com.
Carlos Alamo, Email: alamosolis@yahoo.com.
Nilton Y Carreazo, Email: yhuro@hotmail.com.
Carlos A Bada, Email: ifocar@yahoo.com.
References
- International Nutritional Anemia Consultative Group . INACG Symposium 12 March 1999, Durban, South Africa. ILSI Research Foundation, Washington, D.C; pp. 1–60. [Google Scholar]
- WHO . Turning the tide of malnutrition: responding to the challenge of the 21st century. Geneva: WHO (WHO/NHD.007); 2000. http://www.who.int/nut/documents/nhd_brochure.pdf (accessed Oct 17, 2005) [Google Scholar]
- International Nutritional Anemia Consultative Group Report of the 2003 International Nutritional Anemia Consultative Group Symposium Integrating programs to move iron deficiency and anemia control forward. http://inacg.ilsi.org/file/INACGfinal.pdf (accessed Oct 17, 2005)
- Instituto Nacional de Estadistica e Informatica . Encuesta Demográfica y de Salud Familiar 2000. Lima, Perú; 2001. [Google Scholar]
- Olivares M, Pizarro F, Hertrampf E, Walter T, Arredondo M, Letelier A. Fortificación de alimentos con hierro en Chile. Rev Chil Nutr. 2000;27:340–44. [Google Scholar]
- Pollit E. The developmental and probabilistic nature of the functional consequences of iron-deficiency anemia in children. J Nutr. 2001;131:S669–75. doi: 10.1093/jn/131.2.669S. [DOI] [PubMed] [Google Scholar]
- Brabin BJ, Premji Z, Verhoeff F. An analysis on anemia and child mortality. J Nutr. 2001;131:S636–45. doi: 10.1093/jn/131.2.636S. [DOI] [PubMed] [Google Scholar]
- WHO Division of Child and Development Integrated management of childhood illness: conclusions. Bull World Health Org. 1997;75:S119–28. [PMC free article] [PubMed] [Google Scholar]
- Weber MW, Kellingray SD, Palmer A, Jaffar S, Mulholland EK, Greenwood BM. Pallor as a clinical sign of severe anaemia in children: an investigation in the Gambia. Bull World Health Org. 1997;75:S113–18. [PMC free article] [PubMed] [Google Scholar]
- Zucker JR, Perkins BA, Jafari H, Otieno J, Obonyo C, Campbell CC. Clinical signs for the recognition of severe anaemia in western Kenya. Bull World Health Org. 1997;75:S97–102. [PMC free article] [PubMed] [Google Scholar]
- Luby SP, Kasembe PN, Redd CZ, Ciba C, Nwanyanwu OC, Hightower AW, Franco C, Chitsulo L, Wirima JJ, Olivar MA. Using clinical signs to diagnose anaemia in African children. Bull World Health Organ. 1995;73:477–82. [PMC free article] [PubMed] [Google Scholar]
- Graitcer PL, Goldsgy JB, Nichaman MZ. Hemoglobins and hematocrits: are they equally sensitive in detecting anemias? Am J Clin Nut. 1981;34:61–4. doi: 10.1093/ajcn/34.1.61. [DOI] [PubMed] [Google Scholar]
- Mulrow CD, Linn WD, Gaul MK, Pugh JA. Assessing quality of a diagnostic test evaluation. J Gen Intern Med. 1989;4:288–95. doi: 10.1007/BF02597398. [DOI] [PubMed] [Google Scholar]
- Moses LE, Shapiro D, Littenberg B. Combining independent studies of a diagnostic test into a summary ROC curve: data-analytic approaches and some additional considerations. Stat Med. 1993;12:1293–1316. doi: 10.1002/sim.4780121403. [DOI] [PubMed] [Google Scholar]
- Devillé WL, Buntinx F, Bouter LM, Montori VM, de Cet HCW, vander Windt AWM, Bezemer PD. Conducting systematic reviews of diagnostic studies: didactic guidelines. BMC Med Res Methodol. 2002;2:9. doi: 10.1186/1471-2288-2-9. [DOI] [PMC free article] [PubMed] [Google Scholar]
- Leemis LM, Trivedi KS. A Comparison of approximate interval estimators for the Bernoulli parameter. Am Stat. 1996;50:63–8. [Google Scholar]
- DerSimonian R, Laird N. Meta-analysis in clinical trials. Controlled Clin Trials. 1986;7:177–88. doi: 10.1016/0197-2456(86)90046-2. [DOI] [PubMed] [Google Scholar]
- Zamora J, Muriel A, Abraira V. Meta-DiSc for Windows. A Software package for the Meta-analysis of Diagnostic Tests. XI Cochrane Colloquium Barcelona. 2003. http://www.hrc.es/investigacion/metadisc_en.htm (accessed Oct 17, 2005)
- Gjorup T, Bugge PM, Hendriksen C, Jensen AM. A critical evaluation of the clinical diagnosis of anemia. Am J Epidemiol. 1986;124:657–65. doi: 10.1093/oxfordjournals.aje.a114438. [DOI] [PubMed] [Google Scholar]
- Strobach RS, Anderson SK, Doll DC, Ringenberg QS. The value of the physical examination in the diagnosis of anemia. Correlation of the physical findings and the hemoglobin concentration. Arch Intern Med. 1988;148:831–2. [PubMed] [Google Scholar]
- Sanchez-Carrillo CI, Ramirez-Sanchez TJ, Zambrana-Castaneda M, Selwyn BJ. Test of a noninvasive instrument for measuring hemoglobin concentration. Int J Technol Assess Health Care. 1989;5:659–67. doi: 10.1017/s0266462300008527. [DOI] [PubMed] [Google Scholar]
- Sanchez-Carrillo CI. Bias due to conjunctiva hue and the clinical assessment of anemia. J Clin Epidemiol. 1989;42:751–4. doi: 10.1016/0895-4356(89)90071-1. [DOI] [PubMed] [Google Scholar]
- Nardone DA, Roth KM, Mazur DJ, McAfee JH. Usefulness of physical examination in detecting the presence or absence of anemia. Arch Intern Med. 1990;150:201–4. [PubMed] [Google Scholar]
- Wallace DE, McGreal GT, O'Toole G, Holloway P, Wallace M, McDermott EW, Blake J. The influence of experience and specialisation on the reliability of a common clinical sign. Ann R Coll Surg Engl. 2000;82:336–8. [PMC free article] [PubMed] [Google Scholar]
- Hung OL, Kwon NS, Cole AE, Dacpano GR, Wu T, Chiang WK, Goldfrank LR. Evaluation of the physician's ability to recognize the presence or absence of anemia, fever, and jaundice. Acad Emerg Med. 2000;7:146–56. doi: 10.1111/j.1553-2712.2000.tb00518.x. [DOI] [PubMed] [Google Scholar]
- Ingram CF, Lewis SM. Clinical use of WHO haemoglobin colour scale: validation and critique. J Clin Pathol. 2000;53:933–7. doi: 10.1136/jcp.53.12.933. [DOI] [PMC free article] [PubMed] [Google Scholar]
- Weber MW, Kellingray SD, Palmer A, Jaffar S, Mulholland EK, Greenwood BM. Pallor as a clinical sign of severe anaemia in children: an investigation in the Gambia. Bull World Health Org. 1997. pp. S113–8. [PMC free article] [PubMed]
- Montresor A, Albonico M, Khalfan N, Stoltzfus RJ, Tielsch JM, Chwaya HM, Savioli L. Field trial of a haemoglobin colour scale: an effective tool to detect anaemia in preschool children. Trop Med Int Health. 2000;5:129–33. doi: 10.1046/j.1365-3156.2000.00520.x. [DOI] [PubMed] [Google Scholar]
- Ekunwe EOA. Predictive value of conjunctival pallor in the diagnosis of anaemia. West Afr J Med. 1997;16:246–50. [PubMed] [Google Scholar]
- Kent AR, Elsing SH, Hebert RL. Conjunctival vasculature in the assessment of anemia. Ophthalmology. 2000;107:274–7. doi: 10.1016/s0161-6420(99)00048-2. [DOI] [PubMed] [Google Scholar]
- Wurapa FK, Bulsara MK, Boatin BA. Evaluation of conjunctival pallor in the diagnosis of anaemia. J Trop Med Hyg. 1986;89:33–6. [PubMed] [Google Scholar]
- Thaver IH, Baig L. Anaemia in children: Part I. Can simple observations by primary care provider help in diagnosis? J Pak Med Assoc. 1994;44:282–84. [PubMed] [Google Scholar]
- Sdepanian VL, Silvestrini WS, de Morais MB. Diagnostic limitations of the physical examination in the identification of children with anemia. Rev Assoc Med Bras. 1996;42:169–74. [PubMed] [Google Scholar]
- Kalter HD, Burnham G, Kolstad PR, Hossain M, Schillinger JA, Khan NZ, Saha S, Kednya-Mugisha N, Schwartz B, Black RE. Evaluation of clinical signs to diagnose anaemia in Uganda and Bangladesh, in areas with and without malaria. Bull World Health Organ. 1997;75:S103–11. [PMC free article] [PubMed] [Google Scholar]
- Stoltzfus RJ, Edward-Raj A, Dreyfuss ML, Albonico M, Montresor A, Dhoj Thapa M, West KP, Jr, Chwaya HM, Savioli L, Tielsch J. Clinical pallor is useful to detect severe anemia in populations where anemia is prevalent and severe. J Nutr. 1999;129:1675–81. doi: 10.1093/jn/129.9.1675. [DOI] [PubMed] [Google Scholar]
- Getaneh T, Girma T, Belachew T, Teklemariam S. The utility of pallor detecting anemia in under five years old children. Ethiop Med J. 2000;38:77–84. [PubMed] [Google Scholar]
- Muhe L, Oljira B, Degefu H, Jaffar S, Weber MW. Evaluation of clinical pallor in the identification and treatment of children with moderate and severe anaemia. Trop Med Int Health. 2000;5:805–10. doi: 10.1046/j.1365-3156.2000.00637.x. [DOI] [PubMed] [Google Scholar]
- Wamae CN, Mwanza J, Makama S. Palmar Pallor as an Indicator for Anthelminthic Treatment Among Ill Children Aged 2–4 Years – Western Kenya, 1998. MMWR. 2000;49:278–81. [PubMed] [Google Scholar]
- Desai MR, Philips-Howard PA, Terlouw DJ, Wannemuehler KA, Odhacha A, Kariuki SK, Nahlen BL, ter Kuile FO. Recognition of pallor associated with severe anaemia by primary caregivers in western Kenya. Trop Med Int Health. 2002;7:831–39. doi: 10.1046/j.1365-3156.2002.00942.x. [DOI] [PubMed] [Google Scholar]
- Schellenberg D, Schellenberg JR, Mushi A, Savigny D, Mgalula L, Mbuya C, Victora CG. The silent burden of anaemia in Tanzanian children: a community-based study. Bull World Health Organ. 2003;8:581–90. [PMC free article] [PubMed] [Google Scholar]
- INACG/WHO/UNICEF . In: Guidelines for the Use of Iron Supplements to Prevent and Treat Iron Deficiency Anaemia 2000 International Life Sciences Institute Washington, DC) Stoltzfus RJ, Dreyfuss ML, editor. 2000. [Google Scholar]
- Simoes EAF, Desta T, Tessema T, Gerbresellassie T, Dagnew M, Gove S. Performance of health workers after training in integrated management of childhood illness in Gondar, Ethiopia. Bull World Health Organ. 1997;75:S43–53. [PMC free article] [PubMed] [Google Scholar]
Associated Data
This section collects any data citations, data availability statements, or supplementary materials included in this article.
Supplementary Materials
Key words used in the search. details of key words used in the search
Criteria for the assessment of the methodological quality of primary studies. Details of the quality criteria and scores ascribed for each of them
Adapted QUORUM statement checklist and flow diagram of the systematic review. It includes the completed QUORUM statement checklist and the flowchart


