

Abstract
The hypertensive effect observed with most cell-free haemoglobins has been proposed to result from NO scavenging. However, a newly developed PEG [poly(ethylene glycol)]-conjugated haemoglobin, MalPEG-Hb [maleimide-activated PEG-conjugated haemoglobin], is non-hypertensive with unique physicochemical properties: high O2 affinity, low co-operativity and large molecular radius. It is therefore of interest to compare the ligand-binding properties of MalPEG-Hb with unmodified cell-free HbA (stroma-free human haemoglobin). NO association rates for deoxy and oxyMalPEG-Hb and HbA were found to be identical. These results confirm the lack of correlation between hypertension and NO for a similar modified haemoglobin with high molecular radius and low p50 (pO2 at which haemoglobin is half-saturated with O2) [Rohlfs, Bruner, Chiu, Gonzales, Gonzales, Magde, Magde, Vandegriff and Winslow (1998) J. Biol. Chem. 273, 12128–12134]. The R-state O2 association kinetic constants were also the same for the two haemoglobins. However, even though the p50 of MalPEG-Hb is approx. half of that of HbA, the biphasic O2 dissociation rates measured at relatively high pO2 (150 Torr) were 2-fold higher, giving rise to a 2-fold lower R-state equilibrium association constant for MalPEG-Hb compared with HbA. Thus the O2 affinity of MalPEG-Hb is higher only at pO2 values lower than the intersection point of the O2 equilibrium curves for MalPEG-Hb and HbA. In summary, the present studies found similar rates of NO binding to HbA and MalPEG-Hb, eliminating the possibility that the lack of vasoactivity of MalPEG-Hb is simply the result of reduced molecular reactivity with NO. Alternatively, the unique O2-binding characteristics with low p50 and co-operativity suggest that the ‘R-state’ conformation of MalPEG-Hb is in a more T-state configuration and restricted from conformational change.
Keywords: altered conformational states, haemoglobin, ligand-binding kinetics, O2 equilibrium binding, poly(ethylene glycol), poly(ethylene glycol)-modified haemoglobin
Abbreviations: HbA, stroma-free human haemoglobin; PEG, poly(ethylene glycol); MalPEG-Hb, maleimide-activated PEG-conjugated haemoglobin; pMB, p-hydroxymercuribenzoate; NEM, N-ethylmaleimide; UVRR, UV resonance Raman
INTRODUCTION
Chemical and/or genetic modifications of haemoglobins are being investigated for use as O2-carrying plasma expanders, and a number of products have been or are currently under clinical development. First-generation products have shown adverse effects due to vasoconstriction, which raised concern about the safety and/or efficacy of cell-free haemoglobins [1,2]. Recently, we have developed a novel haemoglobin product, MalPEG-Hb [maleimide-activated poly(ethylene glycol)-conjugated haemoglobin], made from human haemoglobin conjugated to maleimide-activated PEG [3]. MalPEG-Hb has an average of six PEG chains (molecular mass, 5 kDa each) per haemoglobin tetramer, creating a shell of water surrounding the protein. The surface-modification chemistry is associated with unique physicochemical properties of the product, including increased molecular radius, high O2 affinity and low co-operativity. Interestingly, MalPEG-Hb does not exhibit the typical hypertensive response observed with most cell-free haemoglobin solutions.
Since the discovery of haemoglobin-induced vasoactivity, mechanisms of vasoconstriction have been the focus of interest because vasoconstriction was implicated in the failure of clinical trials [2]. Two theories for the mechanism of haemoglobin-induced vasoconstriction directly involve the binding of haemoglobin ligands: NO (nitric oxide) and O2. NO is both a potent haem ligand [4] and an endothelium-derived relaxing factor [5]. Therefore an obvious concern has been that cell-free haemoglobins scavenge NO, inducing vasoconstriction and hypertension [6]. In support of this theory, recombinant haemoglobin mutants that impede haem-NO binding kinetics have shown attenuated pressor responses in rats [7]. However, another study using several different types of chemically modified haemoglobins showed no correlation between NO-binding kinetics and the blood pressure response in rats [8].
A second theory proposes that O2 itself controls vessel tone. O2 delivery is matched to meet O2 demand [9], and blood flow to the tissue is controlled by the diameter of arteriolar vessels [10]. Hyperoxia causes vasoconstriction in arterioles [11], and high O2 off-loading in precapillary vessels by a cell-free polymerized haemoglobin has been correlated with decreased capillary flow [12]. Unlike haemoglobin that is trapped inside red blood cells, cell-free haemoglobins can enhance O2 delivery by facilitated diffusion [13,14]. The large molecular mass and high O2 affinity of MalPEG-Hb has been predicted to slow its facilitated diffusion [14], although the kinetics of O2 off-loading had not been determined.
Clearly, the mechanism(s) of haemoglobin-induced vasoconstriction and O2 delivery are complex and may involve reactions between haemoglobin and haem ligands. Since infusion of MalPEG-Hb does not cause the typical cell-free haemoglobin-induced hypertensive response [3], we measured the ligand (NO and O2)-binding kinetics of MalPEG-Hb to compare with those of unmodified haemoglobin, HbA (stroma-free human haemoglobin).
Maleimide reacts specifically with thiol groups, and for unmodified HbA there are two reactive groups at the βCys-93 residues. With MalPEG-Hb, there are an additional four thiols as a result of thiolation. An extensive body of literature exists on the effects of maleimide modification on HbA, using the more simple NEM (N-ethylmaleimide) compound or more complex maleimide–PEG conjugates [15–21]. Attachment of the rigid, bulky maleimide group to the βCys-93 displaces the βHis-146 residue and prevents it from forming a salt bridge with βAsp-94, thus destabilizing the T-state conformation [16,22]. This shift in the quaternary conformation equilibrium towards the R state results in higher oxygen affinity, impaired co-operativity and a reduced Bohr effect [15,17,22]. In addition to the destabilization of the T quaternary state, R-state NEM-HbA exists in a constrained configuration. This has been demonstrated through O2 equilibrium-binding experiments, showing that K4 for NEM-modified HbA is lower than that for unmodified HbA [17]. More recent results with carbon monoxymaleimide-modified HbAs, including MalPEG-modified HbAs, show that maleimide modification does not alter the R-state kinetics of ligand recombination from the solvent, but it does reduce the geminate yield of CO binding, confirming that R-state maleimide-modified HbAs exist in a more deoxy-like structure, which allows the ligand more time to escape from the haem pocket [20].
In the present study, we show that the association kinetics of the diatomic gases, NO and O2, are also not altered by maleimide modification or hindered by diffusion through the shell of PEG-bound water surrounding the MalPEG-Hb tetramer. However, we also determined that even though the O2 affinity of MalPEG-Hb is higher than that for HbA, the rates of O2 dissociation from R-state MalPEG-Hb are also 2-fold higher than the off rates for HbA. Thus our results with MalPEG-Hb are consistent with the interpretation that maleimide modification lowers p50 (pO2 at which haemoglobin is half-saturated with O2) as a result of a destabilized T state and/or decreased R-state O2 affinity.
EXPERIMENTAL
Haemoglobin solutions
HbA and MalPEG-Hb were prepared as described previously [3]. Haemoglobin concentrations were measured using a diode array spectrophotometer (Agilent HP 8453) and a molar absorption coefficient of 7.12 mM−1·cm−1 at 523 nm [23]. Methaemoglobin levels were ≤3% in both the haemoglobin solutions as calculated by multicomponent analysis.
Buffer solution
All reactions were performed using 0.1 M Hepes buffer (Sigma–Aldrich Chemicals, St. Louis, MO, U.S.A.), 0.1 M Cl− at pH 7.4 and 23 °C.
Sample preparation for NO-binding studies
The buffer solution was equilibrated under 1 atm (where 1 atm =101.325 kPa) of NO gas at 25 °C, giving a stock NO solution of 2 mM. This solution was then diluted with degassed buffer to obtain the final NO concentration for the kinetic studies.
NO association reactions
The kinetics of NO association to the deoxyhaemoglobins was measured by a stopped-flow, rapid mixing apparatus (MV17; Applied Photophysics Leatherhead, U.K.). The haemoglobin solutions were prepared by diluting the protein in deoxygenated buffer and adding approx. 0.1 mg/ml of sodium dithionite immediately before the measurements to ensure complete removal of O2 from the buffer. Haemoglobin samples were mixed with the NO solution, and the reactions were monitored for the disappearance of deoxyhaemoglobin at 436 nm. The bimolecular rate constant for this reaction is very large, of the order of 10 μM−1·s−1 [24], and so the concentration of NO after mixing was kept low to minimize loss of the reaction time course during the mixing time of the stopped-flow apparatus (2–3 ms). After mixing, the NO and haemoglobin concentrations were 7.5 and 1 μM (in haem) respectively to maintain pseudo-first-order conditions. Given the low haemoglobin concentration, absorbance changes were small, and three kinetic traces were averaged per run. The 3 ms dead time was subtracted from the raw data, and the time course was fitted for approx. 20 ms to a single-exponential equation using MATLAB (The Math Works, Natick, MA, U.S.A.). The bimolecular rate constants were obtained by dividing the observed rate constants by the NO concentration (k′=kobs/[NO]).
NO oxidation reactions
The kinetics of NO oxidation of the oxyhaemoglobins were also measured using the stopped-flow apparatus. Solutions of air-equilibrated HbA and MalPEG-Hb were mixed against anaerobic solutions of NO, and the conversion of oxyhaemoglobin into methaemoglobin was monitored by the absorbance change at 419 nm. The bimolecular rates of NO-induced oxidation have been reported to be the same as the NO association rate constants [8,24], and so the same concentrations of NO and haemoglobins described above, i.e. 7.5 and 1 μM (in haem) respectively were used. Under these conditions, the rate of oxidation of NO by dissolved O2 is negligible compared with the rate of reaction of NO with oxyhaemoglobin [25]. Three kinetic traces were averaged per run. The 3 ms dead time was subtracted from the raw data, and the time course was fitted for approx. 20 ms to a single-exponential expression using MATLAB. The bimolecular rate constants were obtained as mentioned above.
O2 association kinetics
Bimolecular O2 association kinetics were measured using a Nd:YAG solid-state laser (Quanta System HIL 101) with a 5 ns light pulse at 80 mJ/pulse at 532 nm. The observation light was provided by a 100 W lamp, and transmittance was monitored using a Spex 1681 monochromator, a Hamamatsu H6780 photomultiplier tube and a digital Tektronix TDS 360 oscilloscope. The haemoglobin concentrations for HbA and MalPEG-Hb were 8 μM (in haem) diluted in air-equilibrated Hepes buffer at room temperature (23 °C) ([O2]=260 μM). Time courses were monitored at 436 nm and fitted to a double-exponential expression in which the spectral amplitudes of the two phases were forced to be equal:
 |
1 |
where ΔAt is the absorbance change at time t, ΔA0 the total change in absorbance at t=∞, and kf and ks are the observed fast and slow first-order rate constants. All fitting was performed using an iterative, non-linear least-squares algorithm provided by MATLAB. Bimolecular association rate constants were obtained by dividing the observed rates by the O2 concentration (k′=kobs/[O2]).
O2 dissociation kinetics
Rates of O2 dissociation were measured in the stopped-flow, rapid mixing apparatus. Approx. 1 mg of solid sodium dithionite was added to a 20 ml syringe containing buffer equilibrated at 20 °C with 1 atm of CO gas ([CO]=1 mM). This solution was mixed against oxyhaemoglobin solutions at concentrations of 2.5 μM (in haem) after mixing. The disappearance of oxyhaemoglobin was monitored by absorbance changes at 412 nm. Three kinetic traces were averaged per run. To eliminate the mixing time, 3 ms of data were subtracted from the raw data. The time courses were fitted to the double-exponential expression in eqn (1).
Oxygen equilibrium curves
Haemoglobin–oxygen equilibrium curves were measured as described previously [26], using the same buffer, pH and temperature conditions as described above. Briefly, the haemoglobin solutions were deoxygenated using the protocatechuic acid/protocatechuic acid 3,4-dioxygenase system (Sigma–Aldrich Chemicals). The deoxygenation reaction was followed by simultaneous measurements of haemoglobin visible spectra and pO2 using an Agilent diode array spectrophotometer (HP 8453) and a micro-oxygen electrode (Microelectrodes, Londonderry, NH, U.S.A.) respectively. Results were analysed as haemoglobin fractional saturation versus pO2 and fitted for Adair constants, the pO2 at half-saturation (p50) and the Hill coefficient at half-saturation (h50).
RESULTS
NO association kinetics
Representative time courses for the combination of NO to deoxygenated HbA and MalPEG-Hb are shown in Figure 1, and the corresponding bimolecular rate constants (k′) are given in Table 1. Since the NO concentration, after mixing, was 7.5-fold higher than the haemoglobin concentration (i.e. 1 μM in haem), a pseudo-first-order approximation was used to determine the rates. Plots of the time courses on a semi-logarithmic scale are linear (see Figure 1, inset), showing that the pseudo-first-order assumption is valid. Both haemoglobins exhibited rate constants of approx. 20 μM−1·s−1. This value is similar to that reported earlier for HbA (25 μM−1·s−1) [27], and also to values reported by Rohlfs et al. [8] for a number of haemoglobins, including unmodified human HbA0, intramolecularly cross-linked human haemoglobin, intermolecularly polymerized human haemoglobin and PEG-conjugated bovine haemoglobin (i.e. 30 μM−1·s−1).
Figure 1. Time courses of NO association to deoxyhaemoglobin
 .
.

Symbols show data points measured at 436 nm. Experimental conditions: 0.1 M Hepes buffer containing 0.1 M NaCl (pH 7.4) and temperature 23 °C. Solid lines are single-exponential fits to the time courses, assuming pseudo-first-order reaction conditions. Zero time is set to 3 ms to account for the dead time of the rapid-mixing apparatus. The time courses were normalized to give the same amplitude. The bimolecular association rate, k′, is calculated using the pseudo-first-order approximation in NO: k′=kobs/[NO]. The inset shows the same data on a semi-logarithmic plot; the straight lines indicate that the pseudo-first-order hypothesis holds true.
Table 1. Rate constants for the reactions of NO with HbA and MalPEG-Hb.
The kinetics of NO reactions with haemoglobin were measured using a stopped-flow, rapid-mixing spectrophotometer. For rates of NO association to deoxyhaemoglobin, the haemoglobin solutions were diluted to 2 μM (in haem) in deoxygenated buffer with approx. 0.1 mg/ml sodium dithionite added immediately before the measurements. The haemoglobin samples were mixed with a NO solution (15 μM), and the reactions were monitored for the disappearance of deoxyhaemoglobin at 436 nm. For rates of NO oxidation of oxyhaemoglobin, solutions of air-equilibrated HbA and MalPEG-Hb (2 μM in haem) were mixed against anaerobic solutions of NO (15 μM), and the conversion of oxyhaemoglobin into methaemoglobin was monitored by the absorbance change at 419 nm. k′, rate constant for NO association to deoxyhaemoglobin; kox, rate constant for NO-induced oxidation of oxyhaemoglobin.
| Haemoglobins | k′ (μM−1·s−1) | kox (μM−1·s−1) |
|---|---|---|
| HbA | 21 | 18 |
| MalPEG-Hb | 22 | 23 |
NO-driven oxidation kinetics
NO-driven oxidation of oxyhaemoglobin is an irreversible, bimolecular reaction between NO and O2 bound to haemoglobin [24]. Representative time courses of the reaction of NO with the oxygenated forms of HbA and MalPEG-Hb are shown in Figure 2, and the corresponding second-order rate constants of NO oxidation (kox) are given in Table 1. Given the 7.5-fold excess of NO over HbO2, a pseudo-first-order approximation was used, which yielded linear semi-logarithmic time courses (see Figure 2, inset). Both haemoglobins exhibited rate constants of approx. 20 μM−1·s−1, i.e. very similar to the bimolecular association of NO to deoxy Hb.
Figure 2. Time courses of NO oxidation of oxyhaemoglobin
 .
.

Symbols show data points measured at 419 nm. Solid lines are single-exponential fits to the time courses, assuming pseudo-first-order reaction conditions. Zero time is set to 3 ms to account for the dead time of the rapid-mixing apparatus. The time courses were normalized to give the same amplitude. Experimental conditions were as described in Figure 1. The bimolecular oxidation rate, kox, is calculated using the pseudo-first-order approximation in NO: kox=kobs/[NO]. The inset details are same as described in Figure 1.
O2 association kinetics
Rate constants for the bimolecular recombination of O2 were determined by laser flash photolysis of the oxygenated haemoglobins. For native oxyhaemoglobin at high O2 concentration (i.e. [O2]≅1.25 mM), ligand rebinding occurs at approximately the same speed as the protein conformational change from the R to the T quaternary states [28]; moreover, the small photochemical yield and extensive geminate rebinding of O2 ensure that the bimolecular-rebinding reaction occurs on a partially saturated and prevalently R-state Hb derivative. After completion of the geminate rebinding (i.e. t>250 ns), our experimental set-up produces a fraction of unliganded haems of 5–10%, and thus the most populated Hb R-state derivatives are Hb(O2)4 and Hb(O2)3. Under these experimental conditions, the observed rebinding time course can be ascribed almost entirely to the latter chemical species and hence to R-state Hb.
Representative time courses for the O2 association to HbA and MalPEG-Hb are shown in Figure 3. Using site-directed mutants, Mathews et al. [29] and Philo and Lary [30] employed partial photolysis to assign the faster rate of O2 rebinding to R-state β subunits and the slower rate to R-state α subunits. Our data were fitted using eqn (1), and the two rate constants for O2 association (k′) are given in Table 2. For HbA, the fast and slow phases have been assigned to β and α subunits respectively. The values observed in the present study for the R-state HbA are similar to several previously reported estimates for this reaction [31]. For MalPEG-Hb, assignment of the two rate constants to the subunits is uncertain, and the dilemma cannot be resolved by measuring the kinetics in the presence of pMB (p-hydroxymercuribenzoate), because the βCys-93 residue is already conjugated to the maleimide-activated PEG [21]; nevertheless, we observe that the fast and slow rates are similar, within the experimental error, for HbA and MalPEG-Hb (see Table 2). Therefore we have tentatively kept the assignments for the rates for the two chains to be the same as for HbA.
Figure 3. Time courses of O2 association to deoxyhaemoglobins following laser flash photolysis (hν)
 .
.

Symbols show data points measured at 436 nm. Experimental conditions were as described in Figure 1. The photochemical yield at the beginning of the bimolecular recombination of O2 was 5–10% due to the low photochemical yield of HbO2 and the geminate recombination occurring on a much faster time scale than that reported in the Figure. Solid lines are double-exponential fits to the time courses, forcing equal amplitudes for the two phases according to eqn (1) to obtain pseudo-first-order rates for β [fast phase (f)] and α [slow phase (s)] subunits using kβ,α=kobs(f,s)/[O2].
Table 2. R-state kinetic constants for O2 binding to HbA and MalPEG-Hb.
Bimolecular O2 association kinetics was measured using laser photolysis. The haemoglobins were diluted to 8 μM (in haem) in air-equilibrated buffer at room temperature ([O2]=260 μM). Time courses were monitored at 436 nm. Rates of O2 dissociation were measured using a stopped-flow, rapid-mixing spectrophotometer. Approx. 1 mg of solid sodium dithionite was added to a syringe containing buffer equilibrated at 20 °C with 1 atm of CO ([CO]=1 mM). This solution was mixed against oxyhaemoglobin (5 μM in haem). The disappearance of oxyhaemoglobin was monitored by absorbance changes at 412 nm. Time courses were fitted to a double-exponential expression with fixed, equal amplitudes. k′, rate constants for O2 association; k, rate constants for O2 dissociation. Errors were estimated at ±20% based on the results of Mathews et al. [29].
| Haemoglobins | k′ (μM−1·s−1) | k (s−1) | KR (×10−6·M−1) |
|---|---|---|---|
| HbA (β) | 76±15 | 26±5 | 2.9±1.4 |
| HbA (α) | 26±5 | 13±3 | 2.0±1.1 |
| MalPEG-Hb (β)* | 85±17 | 49±10 | 1.7±0.9 |
| MalPEG-Hb (α)* | 19±4 | 21±4 | 0.9±0.5 |
* Fast and slow phases have not been assigned specifically to the subunits in MalPEG-Hb. In this evaluation, we have made the assumption that assignment of the fast and slow phases of MalPEG-Hb are the same as those for HbA.
O2 dissociation kinetics
Representative time courses for O2 dissociation in the presence of excess CO are shown in Figure 4 for HbA and MalPEG-Hb. Under these conditions, the kinetics provide information about O2 dissociation from R-state Hb. The data were fitted using eqn (1), and the two rate constants for O2 dissociation (k) are given in Table 2. Olson et al. [32] assigned the fast and slow components observed for O2 displacement reactions of HbA to dissociation from the β and α subunits respectively. These assignments have since been confirmed by Mathews et al. [29] using genetically engineered human haemoglobins.
Figure 4. Time courses of O2 dissociation from oxyhaemoglobin maintained in the R-state conformation by saturation with CO
 .
.

Symbols show data points measured at 412 nm. Experimental conditions were as described in Figure 1. Solid lines are fits to the time courses. Zero time is set to 3 ms to account for the dead time of the rapid-mixing apparatus. The time courses were fitted to the double-exponential expression in eqn (1).
The two kinetic phases of O2 dissociation from MalPEG-Hb were approx. 1.5–2-fold higher than the corresponding processes observed in HbA. Two interpretations are possible. Either the dissociation rates from both the α and β subunits of MalPEG-Hb are nearly doubled or maleimide-PEG modification increases the rate of O2 release from the α chains at a rate that is 4-fold greater than that for HbA, with little change in the rate from the β subunits. The latter explanation is the least probable; modification of βCys-93 residues with pMB significantly increases the O2 dissociation constant for the fast phase (assigned to the β chains) and has only a small effect on the rate constant for the slow phase [32,33]. Unfortunately, the pMB experiment cannot be repeated with MalPEG-Hb because, as stated above, βCys-93 residue is already reacted with maleimide-PEG. However, a reasonable assumption can be made that modification of βCys-93 by maleimide-PEG most probably influences the ligand-binding properties of the β chains, and so the most probable interpretation is that the fast and slow phases for MalPEG-Hb can be assigned to the rates of O2 release from β and α subunits respectively.
O2 equilibrium binding
Oxygen equilibrium curves for HbA and MalPEG-Hb are shown in Figure 5. MalPEG-Hb has a lower p50 and significantly decreased co-operativity as indicated by the decrease in h50 (Table 3). Adair constants were evaluated by fitting the data to the Adair equation as described previously [34]; only the fourth equilibrium constant is relevant in the present comparison and is presented in Table 3.
Figure 5. Oxygen equilibrium curves for HbA and MalPEG-Hb measured in 0.1 M Hepes, 0.1 M Cl−, 0.1 M EDTA and catalase at pH 7.4 and 23 °C.

The experiment was performed by enzymic deoxygenation as described previously [26]. The fitted curves were determined by Adair analysis as described previously [34].
Table 3. O2 equilibrium parameters.
The haemoglobin solutions were deoxygenated using the protocatechuic acid/protocatechuic acid 3,4-dioxygenase system, and the reaction was followed by simultaneous measurements of the haemoglobin visible spectra and pO2. Equilibrium values for K4 were calculated from fitted Adair constants; kinetic values for K4 were calculated according to eqn (2) from the measured rate constants given in Table 2.
| K4 (μM−1) | ||||
|---|---|---|---|---|
| Haemoglobins | p50 (Torr) | h50 | Equilibrium | Kinetic |
| HbA | 5.5 | 3.0 | 2.6 | 2.4 |
| MalPEG-Hb | 3.0 | 1.0 | 1.2 | 1.2 |
DISCUSSION
In the present study, we have described the rate constants for NO association to deoxyhaemoglobins, HbA and MalPEG-Hb, and the rate constants for the NO-induced oxidation of oxy-HbA and MalPEG-Hb. The bimolecular rate constants for the two reactions (i.e. association and oxidation) are very similar to one another, and also similar to or slightly smaller than those reported by others for HbA (usually in the range of 30–50 μM−1·s−1; see [8,24]). More importantly, in the context of blood substitutes, there is no difference between HbA and MalPEG-Hb; the rate constants for NO reaction with both the deoxy and oxy forms, measured under identical reaction conditions, are the same.
The mechanism of haemoglobin-induced hypertension is controversial. McCarthy et al. [14] have hypothesized that a predominant mechanism is autoregulatory in nature, whereas other groups have proposed mechanisms that involve scavenging of the endothelium-derived relaxing factor, NO, by haemoglobin. Doherty et al. [7] dealt directly with the issue of NO binding at the haem site of haemoglobin by designing α-subunit fused, site-directed mutant haemoglobins with altered haem pockets such that the bimolecular reactions with NO were modified. Using these mutants, Doherty et al. [7] reported that the infusion of recombinant haemoglobin molecules with lower rates for NO binding decreased the hypertensive response in rats. These results suggested a causal relationship between NO reactivity and the vasopressor response for haemoglobins matched in molecular mass (64 kDa). However, a primary difference between MalPEG-Hb and the 64 kDa mutant haemoglobins is the larger molecular mass of the former.
It has also been suggested that O2-linked S-nitrosylation reactions of haemoglobin may be important in the regulation of vascular tone and blood flow [35]. It is possible that different blood pressure responses may be due to differences in the abilities of chemically modified haemoglobins to participate in these reactions. However, it is still not clear if S-nitrosylation reactions are relevant to extracellular haemoglobin and control of blood flow; so far this reaction has been found to be valid only in the presence of red cell membranes. In the present study, maleimide-PEG is bound to the βCys-93 thiols so that S-nitrosylation at the βCys-93 residues is prevented.
Physiological control of vascular tone is probably multifaceted, and several factors may be affected by the presence of cell-free haemoglobin, including molecular mass and extravasation, interstitial scavenging of NO and O2 delivery to specific vascular beds. Autoregulatory control of O2 delivery is a significant factor in the control of vascular tone and blood flow [9]. McCarthy et al. [14] hypothesized that facilitated diffusion by cell-free haemoglobin controls the rate of O2 transport to tissue, and O2 affinity is an important factor in the control of facilitated diffusion.
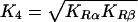
In the kinetic experiments described here, differences in the rates of O2 dissociation of the α and β subunits were determined, and the rate parameters were assigned to the R-state quaternary conformation. Equilibrium constants for the binding of O2 to R-state HbA and MalPEG-Hb were computed from the ratios KRα=k′Rα/kRα and KRβ=k′Rβ/kRβ (see Table 2). If the subunits are not equivalent, the intrinsic value of K4 for equilibrium binding can be calculated as:
 |
(2) |
Since K4 can be computed from the ratio of the kinetic association and dissociation rate constants, we compared the values determined by equilibrium measurements with those determined kinetically (Table 3). The kinetic values determined for K4 for HbA and MalPEG-Hb were 2.4 and 1.2 μM−1 respectively and, within error, identical with the values determined from the equilibrium measurements (2.6 and 1.2 μM−1 respectively). The finding that K4 is decreased by MalPEG modification of HbA is consistent with the earlier findings of Imai [17] using NEM-modified HbA.
NO and O2 association rates were the same for both HbA and MalPEG-Hb and approach the rate limit of diffusion. For O2 dissociation measured under R-state conditions at a pO2 of approx. 150 Torr, the O2 off-rates were approx. 2-fold higher for MalPEG-Hb compared with HbA. The oxygen equilibrium curve for MalPEG-Hb, measured under the same conditions as the kinetic experiments, displayed no co-operativity and intersected the HbA curve at approx. 80% saturation at a pO2 of approx. 10 Torr (see Figure 5). Above the intersection point, the non-co-operative protein displays a lower O2 affinity, probably due to a constrained R-state, until the two curves converge towards complete saturation. It is only at pO2 values below this intersection point where MalPEG-Hb displays a higher O2 affinity. This probably reflects the ability of HbA to undergo transition to the low-affinity T-state quaternary structure, whereas this conformation is destabilized in MalPEG-Hb. This conclusion is supported by a study of proton NMR spectra that shows that deoxy NEM-HbA displays an altered tertiary structure in the proximal β-chain haem pocket that is propagated along the surface of the molecule [19]. Thus the high O2 affinity of MalPEG-Hb, as defined by its low p50, is not the result of decreased O2 off-rates, but rather to an intrinsically low-affinity R-state conformation and loss of co-operative O2 binding. This property of MalPEG-Hb may facilitate O2 off-loading at high pO2 in vivo.
In the present study, we cannot evaluate the differential effects of maleimide versus MalPEG modification of HbA. However, these effects have been studied by Friedman and co-workers [20], who used NEM-modified HbA compared with maleimide PEG-modified HbAs, which differed in the group linking the reactive maleimide group to the PEG polymer (i.e. ethyl versus phenyl carbamate linkers) and in the number of PEGs attached to the HbA tetramer [21]. Regardless of the presence or absence of PEG or type of linker, all types of maleimide modifications of the βCys-93 residues showed similar changes on the Fe-proximal histidine stretching frequency compared with unmodified HbA, suggesting that maleimide modification shifts the R-state tertiary structure towards the T state [20]. However, additional experiments using UVRR (UV resonance Raman) delineated differences between linkers but not between number of PEGs attached to the HbA tetramer [21]. Whereas the phenyl carbamoyl-linked maleimide-PEG HbAs showed similar UVRR spectral results compared with NEM-modified HbA, the ethyl-linked maleimide-PEG HbAs showed enhancement of designated UVRR spectral bands, associated with a compaction, dehydration or alteration of the hydration shell of the haemoglobin tetramer [21]. These researchers hypothesize that this may be due to an osmotic effect of PEG on haemoglobin, which is sensitive to the spacing between the haemoglobin tetramer and the PEG polymer. It is interesting, however, that no effects were observed due to the degree of PEG substitution with either type of linker.
Except for the different linker chemistry in MalPEG-Hb, i.e. propyl versus phenyl carbamoyl or ethyl, the MalPEG-Hb studied here is similar to the maleimide-PEG HbAs studied by Friedman and co-workers [21] with six PEGs attached per tetramer. On the basis of similarity of the alkyl linker chemistries (ethyl versus propyl, i.e. –CH2CH2– versus –CH2CH2CH2– respectively), we might expect the conformation or hydration shell of MalPEG-Hb to be more similar to that of the ethyl linked-maleimide PEG as opposed to the phenyl carbamoyl-linked molecule. The additional methylene group in the propyl linker might offer better spacing between the protein and the attached PEG polymers compared with the ethyl linker, but it is unlikely to be comparable with the more rigid and bulky phenyl carbamoyl linker.
In conclusion, compared with unmodified cell-free HbA, MalPEG-Hb displays identical NO association rates with both the deoxy and oxy forms and identical R-state O2 association kinetic constants despite lower p50. The higher O2 dissociation rate at high pO2 implies a lower R-state equilibrium association constant for MalPEG-Hb when compared with HbA. These findings argue against the role of NO reactivity in determining Hb-driven vasoconstriction. Low p50 and co-operativity in MalPEG-Hb suggest that the ‘R-state’ conformation is in a more restricted configuration when compared with that of HbA. Probably, the unique physicochemical properties whereby MalPEG-Hb does not exhibit the hypertensive response typical of most cell-free HbA solutions are conferred by structural and functional changes to the Hb molecule associated with a shell of water surrounding the protein created by the PEG chains linked to MalPEG-Hb.
Acknowledgments
This work was supported by Grants R01 HL 64579-04 from the NIH, NHLBI, and by Research Project L. 95/95 ‘Biomolecole per la salute umana’, Consiglio Nazionale delle Ricerche, Italy. R. M. W. and K. D. V. are employees of Sangart Inc. K. D. V. holds stock options in the company. R. M. W. is President, CEO and Chairman of the Board of Sangart.
References
- 1.Sloan E. P., Koenigsberg M., Gens D., Cipolle M., Runge J., Mallory M. N. R. G. Diaspirin cross-linked hemoglobin (DCLHb) in the treatment of severe traumatic hemorrhagic shock. JAMA, J. Am. Med. Assoc. 1999;282:1857–1864. doi: 10.1001/jama.282.19.1857. [DOI] [PubMed] [Google Scholar]
- 2.Winslow R. αα-Crosslinked hemoglobin: was failure predicted by preclinical testing? Vox Sang. 2000;79:1–20. doi: 10.1159/000031200. [DOI] [PubMed] [Google Scholar]
- 3.Vandegriff K., Malavalli A., Wooldridge J., Lohman J., Winslow R. MP4, a new nonvasoactive PEG-Hb conjugate. Transfusion. 2003;43:509–516. doi: 10.1046/j.1537-2995.2003.00341.x. [DOI] [PubMed] [Google Scholar]
- 4.Gibson Q. H., Roughton F. J. W. The kinetics and equilibria of the reactions of nitric oxide with sheep haemoglobin. J. Physiol. (Cambridge, U.K.) 1957;136:507–526. doi: 10.1113/jphysiol.1957.sp005777. [DOI] [PMC free article] [PubMed] [Google Scholar]
- 5.Ignarro L. J. Endothelium-derived nitric oxide: actions and properties. FASEB J. 1989;3:31–36. doi: 10.1096/fasebj.3.1.2642868. [DOI] [PubMed] [Google Scholar]
- 6.Loscalzo J. Nitric oxide binding and the adverse effects of cell-free hemoglobins: what makes us different from earthworms. J. Lab. Clin. Med. 1997;129:580–583. doi: 10.1016/s0022-2143(97)90191-8. [DOI] [PubMed] [Google Scholar]
- 7.Doherty D. H., Doyle M. P., Curry S. R., Vali R. J., Fattor T. J., Olson J. S., Lemon D. D. Rate of reaction with nitric oxide determines the hypertensive effect of cell-free hemoglobin. Nat. Biotechnol. 1998;16:672–676. doi: 10.1038/nbt0798-672. [DOI] [PubMed] [Google Scholar]
- 8.Rohlfs R. J., Bruner E., Chiu A., Gonzales A., Gonzales M., Magde D., Magde M. D., Vandegriff K. D., Winslow R. M. Arterial blood pressure responses to cell-free hemoglobin solutions and the reaction with nitric oxide. J. Biol. Chem. 1998;273:12128–12134. doi: 10.1074/jbc.273.20.12128. [DOI] [PubMed] [Google Scholar]
- 9.Richmond K. N., Shonat R. D., Lynch R. M., Johnson P. C. Critical PO2 of skeletal muscle in vivo. Am. J. Physiol. 1999;277:H1831–H1840. doi: 10.1152/ajpheart.1999.277.5.H1831. [DOI] [PubMed] [Google Scholar]
- 10.Intaglietta M., Johnson P. C., Winslow R. M. Microvascular and tissue oxygen distribution. Cardiovasc. Res. 1996;32:632–643. [PubMed] [Google Scholar]
- 11.Lindbom L., Tuma R. F., Arfors K. E. Influence of oxygen on perfused capillary density and capillary red cell velocity in rabbit skeletal muscle. Microvasc. Res. 1980;19:197–208. doi: 10.1016/0026-2862(80)90040-0. [DOI] [PubMed] [Google Scholar]
- 12.Tsai A. Influence of cell-free Hb on local tissue perfusion and oxygenation in acute anemia after isovolemic hemodilution. Transfusion. 2001;41:1–10. doi: 10.1046/j.1537-2995.2001.41101290.x. [DOI] [PubMed] [Google Scholar]
- 13.Page T. C., Light W. R., McKay C. B., Hellums J. D. Oxygen transport by erythrocyte/hemoglobin solution mixtures in an in vitro capillary as a model of hemoglobin-based oxygen carrier performance. Microvasc. Res. 1998;55:54–64. doi: 10.1006/mvre.1997.2055. [DOI] [PubMed] [Google Scholar]
- 14.McCarthy M., Vandegriff K., Winslow R. The role of facilitated diffusion in oxygen transport by cell-free hemoglobins: implications for the design of hemoglobin-based oxygen carriers. Biophys. Chem. 2001;92:103–117. doi: 10.1016/s0301-4622(01)00194-6. [DOI] [PubMed] [Google Scholar]
- 15.Riggs A. The binding of N-ethylmaleimide by human hemoglobin and its effect upon the oxygen equilibrium. J. Biol. Chem. 1961;236:1948–1954. [PubMed] [Google Scholar]
- 16.Perutz M., Ladner J., Simon S., Ho C. Influence of globin structure on the state of the heme. I. Human deoxyhemoglobin. Biochemistry. 1974;13:2163–2173. doi: 10.1021/bi00707a026. [DOI] [PubMed] [Google Scholar]
- 17.Imai K. Analyses of oxygen equilibria of native and chemically modified human adult hemoglobins on the basis of Adair's stepwise oxygenation theory and the allosteric model of Monod, Wyman, and Changeux. Biochemistry. 1973;12:798–807. doi: 10.1021/bi00729a003. [DOI] [PubMed] [Google Scholar]
- 18.Kilmartin J., Hewitt J., Wootton J. Alteration of functional properties associated with the change in quaternary structure in unliganded haemoglobin. J. Mol. Biol. 1975;93:203–218. doi: 10.1016/0022-2836(75)90128-x. [DOI] [PubMed] [Google Scholar]
- 19.Cheng Y., Shen T.-J., Simplaceanu V., Ho C. Ligand binding properties and structural studies of recombinant and chemically modified hemoglobins altered at β93 cysteine. Biochemistry. 2002;41:11901–11913. doi: 10.1021/bi0202880. [DOI] [PubMed] [Google Scholar]
- 20.Khan I., Dantsker D., Samuni U., Friedman A., Bonaventura C., Manjula B., Acharya S., Friedman J. β93 Modified hemoglobin: kinetic and conformational consequences. Biochemistry. 2001;40:7581–7592. doi: 10.1021/bi010051o. [DOI] [PubMed] [Google Scholar]
- 21.Juszczak L., Manjula B., Bonaventura C., Acharya S., Friedman J. UV resonance Raman study of β93-modified hemoglobin A: chemical modifier-specific effects and added influences of attached poly(ethylene glycol) chains. Biochemistry. 2002;41:376–385. doi: 10.1021/bi011212r. [DOI] [PubMed] [Google Scholar]
- 22.Perutz M., Muirhead H., Mazzarella L., Crowther R., Greer J., Kilmartin J. Identification of residues responsible for the alkaline Bohr effect in haemoglobin. Nature (London) 1969;222:1240–1243. doi: 10.1038/2221240a0. [DOI] [PubMed] [Google Scholar]
- 23.Snell S. M., Marini M. A. A convenient spectroscopic method for the estimation of hemoglobin concentrations in cell-free solutions. J. Biochem. Biophys. Methods. 1988;17:25–33. doi: 10.1016/0165-022x(88)90075-9. [DOI] [PubMed] [Google Scholar]
- 24.Eich R. F., Li T., Lemon D. D., Doherty D. H., Curry S. R., Aitken J. F., Mathews A. J., Johnson K. A., Smith R. D., Phillips G. N., et al. Mechanism of NO-induced oxidation of myoglobin and hemoglobin. Biochemistry. 1996;35:6976–6983. doi: 10.1021/bi960442g. [DOI] [PubMed] [Google Scholar]
- 25.Kharitonov V. G., Sundquist A. R., Sharma V. S. Kinetics of nitric oxide autoxidation in aqueous solution. J. Biol. Chem. 1994;269:5881–5883. [PubMed] [Google Scholar]
- 26.Vandegriff K. D., Rohlfs R. J., Magde M. D., Winslow R. M. Hemoglobin–oxygen equilibrium curves measured during enzymatic oxygen consumption. Anal. Biochem. 1998;256:107–116. doi: 10.1006/abio.1997.2487. [DOI] [PubMed] [Google Scholar]
- 27.Cassoly R., Gibson Q. Conformation, co-operativity and ligand binding in human hemoglobin. J. Mol. Biol. 1975;91:301–313. doi: 10.1016/0022-2836(75)90382-4. [DOI] [PubMed] [Google Scholar]
- 28.Sawicki C. A., Gibson Q. H. Quaternary conformational changes in human oxyhemoglobin studied by laser photolysis. J. Biol. Chem. 1977;252:5783–5788. [PubMed] [Google Scholar]
- 29.Mathews A. J., Rohlfs R. J., Olson J. S., Tame J., Renaud J. P., Nagai K. The effects of E7 and E11 mutations on the kinetics of ligand binding to R-state human hemoglobin. J. Biol. Chem. 1989;264:16573–16583. [PubMed] [Google Scholar]
- 30.Philo J. S., Lary J. W. Kinetic investigations of the quaternary enhancement effect and α/β differences in binding the last oxygen to hemoglobin tetramers and dimers. J. Biol. Chem. 1990;265:139–143. [PubMed] [Google Scholar]
- 31.Mathews A. J., Olson J. S. Assignment of rate constants for O2 and CO binding to α and β subunits within R- and T-state human hemoglobin. Methods Enzymol. 1994;232:363–386. doi: 10.1016/0076-6879(94)32055-1. [DOI] [PubMed] [Google Scholar]
- 32.Olson J. S., Andersen M. E., Gibson Q. H. The dissociation of the first oxygen molecule from some mammalian oxyhemoglobins. J. Biol. Chem. 1971;246:5919–5923. [PubMed] [Google Scholar]
- 33.Vandegriff K. D., Le Tellier Y. C., Winslow R. M., Rohlfs R. J., Olson J. S. Determination of the rate and equilibrium constants for oxygen and carbon monoxide binding to R-state human hemoglobin cross-linked between the α subunits at lysine 99. J. Biol. Chem. 1991;266:17049–17059. [PubMed] [Google Scholar]
- 34.Vandegriff K. D., Medina F., Marini M. A., Winslow R. M. Equilibrium oxygen binding to human hemoglobin cross-linked between the α chains by bis(3,5-dibromosalicyl) fumarate. J. Biol. Chem. 1989;264:17824–17833. [PubMed] [Google Scholar]
- 35.Stamler J. S., Jia L., Eu J. P., McMahon T. J., Demchenko I. T., Bonaventura J., Gernert K., Piantadosi C. A. Blood flow regulation by S-nitrosohemoglobin in the physiological oxygen gradient. Science. 1997;276:2034–2037. doi: 10.1126/science.276.5321.2034. [DOI] [PubMed] [Google Scholar]