

Abstract
Background: The geographical distribution of general practitioners (GPs) is a persistent policy concern within the National Health Service. Maldistribution across family health service authorities in England and Wales fell between 1974 and the mid-1980s but then remained, at best, constant until the mid-1990s.
Aim: To estimate levels of maldistribution over the period 1994–2003 and to examine the long-term trend in maldistribution from 1974–2003.
Design: Annual snapshots from the GP census.
Setting: One hundred 2001 ‘frozen’ health authorities in England and Wales for 1994–2003 and 98 family health service authorities for 1974–1995.
Method: Ratios of GPs to raw and need-adjusted populations were calculated for each health authority for each year using four methods of need adjustment: age-related capitation payments, national age- and sex-specific consultation rates, national age- and sex-specific limiting long-term illness rates, and health authority-specific mortality. Three summary measures of maldistribution across health authorities in the GP to population ratio — the decile ratio, the Gini coefficient, and the Atkinson index — were calculated for each year.
Results: Maldistribution of GPs as measured by the Gini coefficient and Atkinson index increased from the mid-1980s to 2003, but the decile ratio showed little change over the entire 1974–2003 period. Unrestricted GP principals and equivalents were more equitably distributed than other types of GP.
Conclusion: The 20% increase in the number of unrestricted GPs between 1985 and 2003 did not lead to a more equal distribution.
Keywords: general practitioner, health services needs and demands, maldistribution, need adjustment
Introduction
GEOGRAPHICAL maldistribution of general practitioners (GPs) has been a persistent policy concern since the founding of the National Health Service (NHS).1,2 An earlier study found that maldistribution across family health service authorities (FHSAs) in England and Wales decreased between the mid-1970s and mid-1980s but then increased up to the mid-1990s.3 Areas that were relatively under- provided for in 1974 were still under-provided for in 1995.
Major changes in the organisation of the NHS have occurred since 1995 and there has been greater policy emphasis on equity. We, therefore, investigated whether GP maldistribution continued to increase between 1995 and 2003.
Method
A summary measure of maldistribution of GPs across geographical areas in England and Wales requires information on the supply of GPs and the need-adjusted population in each area. We provide a brief account of the methods used to measure maldistribution between 1994 and 2003 (a fuller description is given in Supplementary Appendix 1). The calculation of FHSA-based measures of maldistribution for the period 1974–1995 has been described previously.3
Geography
The geographical units of analysis from 1974–1995 were family practitioner committees (FPCs) and FHSAs, whose boundaries changed little over the period. FHSAs were abolished in 1996 and their primary care functions were transferred to health authorities. Only 59 health authorities remained coterminous with FHSAs, and there were sub-sequent health authority splits and mergers up until their abolition in April 2002. To minimise the effect of the changing numbers of geographical areas on the measures of maldistribution, we assigned GPs and patient populations for each year from 1994–2003 to the health authority that they would have been in if the boundaries of the 100 health authorities in existence in 2001 had applied over the whole period. We refer to these geographical units as ‘frozen health authorities’.
GP distribution
Data on GPs were available from the annual (October) GP census, undertaken by the Department of Health. We used three definitions of the supply of whole-time-equivalent GPs in each area:
unrestricted GP principals and equivalents,
all GPs (unrestricted GP principals and equivalents, restricted principals, GP assistants, GP registrars, GP retainers [1999 onwards only] and salaried GPs [1998 onwards only]), and
all GPs except GP registrars and GP retainers.
HOW THIS FITS IN
What do we know?
Levels of maldistribution of general practitioners (GPs) increased between the mid-1980s and the mid-1990s.
What does this paper add?
Levels of maldistribution did not fall and, on two out of three measures, continued to increase between 1994 and 2003, despite an increase in the number of GPs.
The third measure is used in the 1999 NHS Plan4 and is perhaps the most useful measure of supply as GP registrars are trainee GPs.
Patient population need adjustment
The raw populations for 1994–2001 for each health authority were the Office of National Statistics estimates based on the 2001 census. For 2002 and 2003 we used the 2001 estimates. Any need adjustment had to be applicable over the entire period, thus ruling out recently developed measures such as those used in the new GP contract.5 Four different methods of need-adjusting the raw populations were employed, reflecting different concepts of need:
age-related capitation payments,
national age- and sex-specific consultation rates,
national age- and sex-specific limiting long-term illness rates, and
health authority-specific all-cause mortality.
Capitation payments are, in part, intended to reflect workload generated by different population groups, but use relatively crude groupings and, for this reason, are less appealing than the other adjustments. It is possible that patients in areas with more GPs have better access to, and therefore make more use of, GPs. To avoid the possibility that the measure of need used was influenced by the supply of GPs, we used national age–sex specific consultation rates rather than area-specific rates. Limiting long-term illness and mortality are direct measures of population health. The mortality adjustment has the advantage that it uses area-specific mortality rates and so directly reflects differences in health across areas, as well as differences in health due to differences in demography. However, mortality is less obviously related to chronic conditions that are important in general practice, such as asthma.
Measures of maldistribution
Three summary measures of maldistribution in England and Wales were constructed from the ratios of GP supply to population in the 100 health authorities:
The decile ratio is the simplest of the three measures, but suffers from using only two pieces of information — the 10th and 90th centiles of the distribution of GPs per head. The Gini coefficient and the Atkinson index make use of all the information in the distribution and are commonly used to examine maldistribution in income.6 The Atkinson index has a firmer foundation in economic theory but the Gini coefficient may be more familiar to GPs.
The alternative definitions of GP supply, need adjustment, and maldistribution yield 45 possible summary measures. There are arguments for and against each of the alternatives and one of the aims of the paper is to investigate how sensitive conclusions about maldistribution are to the method of measurement. We have a mild preference for the Gini measure applied to the distribution of the ratio of all GPs (except registrars and retainers) to the consultation rate adjusted population. However, sufficient alternatives are presented here and in Supplementary Appendix 2 so that readers may examine the consequences of different methodological choices.
Results
Geographical maldistribution of GPs in 2001
In Tables 1 and 2 we present estimates of the maldistribution of GPs in 2001 and investigate how sensitive the three summary measures are to the method of need adjustment and to the measure of GP supply.
Table 1.
The effect of alternative need-adjusters on measures of the maldistribution of all GPs (except GP registrars and GP retainers) in 2001.
| Decile ratio | Gini coefficient | Atkinson index | |
|---|---|---|---|
| Raw population | 1.2175 | 0.0417 | 0.0053 |
| Population adjusted by: | |||
| Age-related capitation payment | 1.2194 | 0.0417 | 0.0054 |
| Consultation rate | 1.2165 | 0.0418 | 0.0054 |
| Limiting long-term illness rate | 1.2725 | 0.0507 | 0.0085 |
| Mortality rate | 1.4522 | 0.0875 | 0.0247 |
Table 2.
The effect of GP supply measures on the consultation rate-adjusted maldistribution measures in 2001.
| Decile ratio | Gini coefficient | Atkinson index | |
|---|---|---|---|
| All GPs | 1.2697 | 0.0492 | 0.0074 |
| GPs (excluding GP registrars and GP retainers) | 1.2165 | 0.0418 | 0.0054 |
| Unrestricted principals and equivalents only | 1.2132 | 0.0415 | 0.0054 |
Table 1 shows the effect of different methods of need adjustment when GP supply is all GPs except registrars and retainers. The levels of the decile ratio, Gini coefficient, and Atkinson index are not comparable since they are constructed in different ways, but the effects of the different need adjustments on them are qualitatively similar. Need-adjusting by the age-related capitation payments or by consultation rates made little difference compared to using the raw population. Need-adjusting by limiting long-term illness increased all three summary maldistribution measures and need-adjusting by mortality yielded even greater levels of maldistribution.
Table 2 investigates the effects of different definitions of GP supply on summary maldistribution measures with needs adjustment by consultation rates. The effects of the definition of GP supply are qualitatively similar across the summary measures. The ‘all GPs’ definition of supply produced greater levels of maldistribution than the other two definitions, which included only subsets of GPs.
Trends in geographical maldistribution: 1974–2003
Figure 1 plots the trend in maldistribution as measured by the Gini coefficient over the entire period 1974–2003. We have used the consultation rate need adjustment, but other combinations of need adjustment and maldistribution measure present a broadly similar pattern (see Supplementary Appendix 2). The series from 1974–1995 summarises maldistribution across FPC/FHSA areas and those from 1994–2003 summarise maldistribution at health authority level. The 1974–1995 series is based on the supply of numbers of unrestricted GP principals and equivalents (the only definition available for that period). Comparison with the 1994–2003 series, based on whole-time equivalent unrestricted GP principals and equivalents, shows that the change in geographical unit and the use of whole-time equivalents rather than numbers makes little difference to the level of measured maldistribution and has relatively little effect on the trend. The broadly upward trend in mal-distribution from the mid-1980s, shown in the 1974–1995 series, is continued in the 1995–2003 series. The figure also shows that, although the level of maldistribution depends on the definition of GP supply, the temporal pattern of maldistribution from 1994–2001 is not greatly affected. Maldistribution increased between 1994 and 1997, fell between 1997 and 2001 and then increased again from 2001 onwards. Maldistribution was higher in 2003 than in 1994 on all definitions of GP supply.
Figure 1.
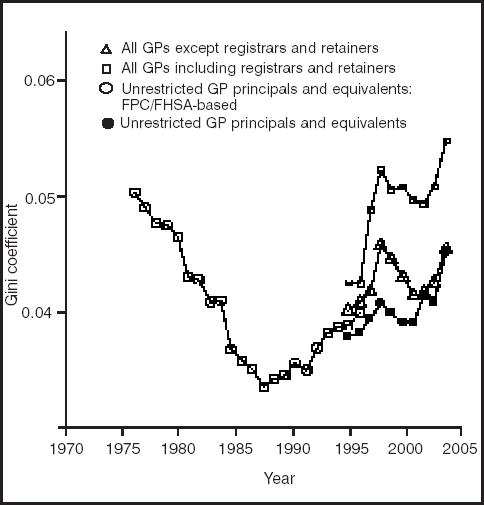
Trends in the Gini coefficient. Needs adjustment = consultation rates. Series are health authority-based unless otherwise specified.
Trends in the three summary maldistribution measures for unrestricted GP principals and equivalents are shown in Figure 2. The figure also compares the effects of using raw populations, and of need-adjusting by consultation-rates, limiting long-term illness-rates, and mortality. The summary measures of maldistribution were scaled relative to the level of maldistribution in 1974 (which was set to 100). The health authority-based series (1994–2003) were scaled multiplic-atively to the FPC/FHSA-based series using the 1994 and 1995 data. The number (not whole-time equivalents) of un-restricted GP principals and equivalents rose from 21 510 in 1974 to 30 351 in 2003 and is also plotted in the figure, with the number for 1974 scaled to 100.
Figure 2.
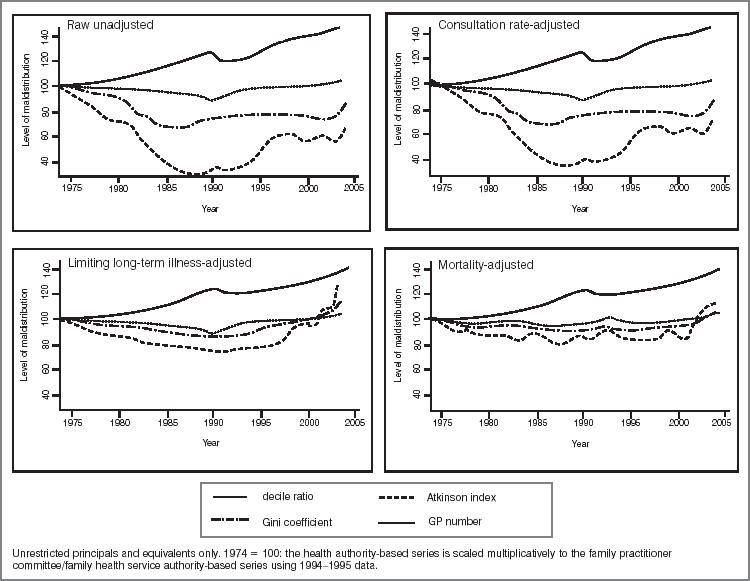
Need-adjusted maldistribution measures.
The three different needs adjusters (national age- and sex-specific consultation rates, national age- and sex-specific limiting long-term illness rates, and health authority-specific all-cause mortality) gave rise to broadly similar general trends in the three maldistribution measures (that is, the decile ratio, Gini coefficient, and Atkinson index). The long-term illness- and mortality-adjusted measures were less variable (their range was 80–100 rather than 40–100). The Atkinson index showed the greatest relative change in maldistribution over the period, whereas the decile ratio was virtually constant.
Persistence of maldistribution
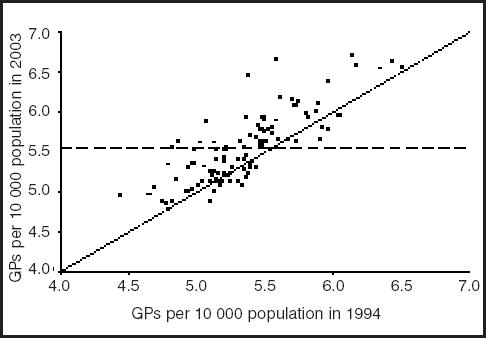
Figure 3 is a scatter plot of the total number of GPs (excluding GP registrars and GP retainers) per 10 000 consultation-rate adjusted population in 1994 and 2003. A health authority with the same number of GPs per population in 1994 and 2003 would lie on the solid line. A quarter of health authorities had a reduction in their GP:population ratio. The two dashed lines indicate the national average (mean) levels in 1994 (vertical: 5.35 GPs per 10 000 population) and 2003 (horizontal: 5.55 per 10 000). The vast majority of health authorities were either in the north-east quadrant, indicating that they had above average provision in both years, or the south-west quadrant, indicating below average provision in both years.
Figure 3.
GPs per 10 000 population in 1994 and 2003.
Discussion
The level of maldistribution in any given year was sensitive to the method of need adjustment and also to the definition of GP supply used (see Tables 1 and 2 and Figure 1). Age-related capitation payment and consultation rate adjustments gave rise to very similar levels of maldistribution to those using unadjusted (raw) populations, regardless of the summary maldistribution measure and GP supply definition. Adjusting for levels of limiting long-term illness slightly increased the level of maldistribution in any given year. The mortality need adjustment led to greater levels of the three maldistribution measures for all GP supply definitions in any given year. This is likely to be due to the fact that the mortality need adjustment is the only one to use area-specific age and sex rates, rather than applying national rates to the area age and gender distributions. Thus, both the differences in health and differences in population structure can lead to differences in the mortality adjusted populations.
The two health-related need adjustments (limiting long-term illness and mortality) produced indices of maldistrib-ution that showed much less movement over time than the consultation rate-adjusted and raw population-based maldistribution measures (Figure 2). The results for the period 1994–2003 suggest that, although levels of geographical maldistribution of GPs, however defined, have fluctuated since 1994, the general trend was a continuation of the increase observed from the mid-1980s. Maldistribution appeared to be persistent (see Figure 3): very few health authorities changed from having a below average GP:pop-ulation ratio to having an above average ratio. Gravelle and Sutton3 found that areas were underprovided for in 1974 were also underprovided for in 1995.
There was a greater level of maldistribution among all GPs than among GPs excluding registrars and retainers, who, in turn, were generally more maldistributed than unrestricted GP principals and equivalents only. This implies that areas with good provision of unrestricted GP principals and equivalents also attracted a disproportionately large share of those who are not unrestricted GP principals and equivalents. For example, registrars are training to be GPs and are more likely to be placed in practices in better provided areas with a higher doctor:population ratio.
Strengths and limitations
The general trend in maldistribution was robust to the definition of GP supply, the method of need adjustment, and the summary measure of maldistribution. Weaknesses in the study arise from the changes in the geographical unit, the use of numbers of GPs rather than whole-time equivalents for the period 1974–1995, and the use of national age- and sex-specific, rather than area age- and sex-specific, data for calculating the need adjustments based on consultations and long-term illness. Finally, we have not attempted to ‘quality adjust’ the measures of GP supply. There are few direct measures of GP quality and the current limited set of practice performance indicators8 are not available historically. There are also considerable difficulties in adjusting such indicators for factors outside GP control.9
Implications for future research
If the level and trend in maldistribution is seen as cause for concern, what policies might lead to a reduction in maldistribution? It is apparent from the fact that the rise in maldistribution was accompanied by an increase in total number of GPs, that merely increasing the supply of GPs will not necessarily reduce maldistribution. Nor will entry control: from 1948–2002 entry by GPs into areas deemed to be over-doctored was regulated by the Medical Practices Committee.10 Targeted incentives to practice in under-doctored areas may be a more cost-effective means of reducing maldistribution. One example is the ‘golden hello’ scheme, introduced in 2001, which makes a one-off payment (initially £5 000, later increased to £7 000) to GPs locating in under-doctored areas.11 Another example is educational loan repayment in return for service in under-served areas.12 Such ‘one-off’ payments are, however, small relative to the lifetime income of GPs, and ongoing incentives may be required in order to keep GPs in under-doctored areas. It should be possible to undertake trials to inform the level and form of such area-based incentives. Such trials should be complimented with studies of the determinants of maldistribution to ensure that incentives are soundly based.
Supplementary information
Additional information accompanies this paper at: http://www.rcgp.org.uk/journal/index.asp
Supplementary Material
Acknowledgments
The National Primary Care Research and Development Centre receives funding from the Department of Health. The views expressed are not necessarily those of the Department of Health. We are grateful for data provided by the General Medical Services Statistics Division at the NHS Executive, Andrew Wagner (National Primary Care Research and Development Centre) and Matthew Sutton (University of Aberdeen).
References
- 1.Butler JR, Bevan JM, Taylor RC. Family doctors and public policy. London: Routledge and Kegan Paul; 1973. [Google Scholar]
- 2.Audit Commission. General practice in England. London: Audit Commission; 2002. http://www.audit-commission.gov.uk/reports/MANAGEMENT-PAPER.asp?CategoryID=&ProdID=AB73DAF2-F18B-49ac-8009-0EF55D21A146 (accessed 1 Nov 2004) [Google Scholar]
- 3.Gravelle H, Sutton M. Inequality in the geographical distribution of general practitioners in England and Wales 1974–1995. J Health Serv Res Policy. 2001;6(1):6–13. doi: 10.1258/1355819011927143. [DOI] [PubMed] [Google Scholar]
- 4.Department of Health. The NHS plan: a plan for investment, a plan for reform. London: HMSO; 2000. [Google Scholar]
- 5.Department of Health. Global sum allocation formula. London: Department of Health; 2004. http://www.dh.gov.uk/assetRoot/04/07/64/75/04076475.pdf (accessed 1 Nov 2004) [Google Scholar]
- 6.Cowell FA. Measuring inequality. (2nd edn) London: Harvester Wheatsheaf; 1995. [Google Scholar]
- 7.Atkinson AB. On the measurement of income inequality. J Econ Theory. 1970;2:244–263. [Google Scholar]
- 8.Houghton G, Rouse A. Are NHS primary care performance indicator scores acceptable as markers of general practitioner quality? Br J Gen Pract. 2004;54(502):341–344. [PMC free article] [PubMed] [Google Scholar]
- 9.Giuffrida A, Gravelle H, Roland M. Measuring quality of care with routine data: avoiding confusion between performance indicators and health outcomes. BMJ. 1999;319(7202):94–98. doi: 10.1136/bmj.319.7202.94. [DOI] [PMC free article] [PubMed] [Google Scholar]
- 10.General Medical Services Committee Medical Workforce Subcommittee. Report on medical workforce Planning. London: BMA; 1998. [Google Scholar]
- 11.Department of Health. NHS GP ‘golden hello’ scheme. London: Department of Health; 2002. [Google Scholar]
- 12.Sibbald B, Slater J, Gosden T, et al. Solving inequalities in provider distribution: loan repayment. Health Soc Care Community. 2002;10(3):162–167. doi: 10.1046/j.1365-2524.2002.00354.x. [DOI] [PubMed] [Google Scholar]
Associated Data
This section collects any data citations, data availability statements, or supplementary materials included in this article.