

Abstract
Background: The inverse care law proposing that medical services are distributed inversely to population health needs, and that this law operates more completely where medical care is most exposed to market forces, was first suggested by Tudor Hart in 1971. This paper considers whether an inverse care law can be observed for the provision of informal care as well as for medical care.
Aim: Using data from the 2001 census we sought to investigate the contemporary relevance of the inverse care law.
Design of study: Cross-sectional study.
Setting: England and Wales.
Method: Data from the 2001 census for the population of England and Wales were analysed at the county, unitary, or former metropolitan authority level. The prevalence of the conjunction of general health status and limiting long-term illness was correlated with the percentage of the local population who were working as qualified healthcare workers (nurses, qualified medical practitioners, dentists, and other health professionals and therapists) and with the percentage of the population providing 50 or more hours of unpaid care per week.
Results: In 2001, 7.6% of people reported that their health was not good and that they had a limiting long-term illness (the need for care). Over one million people reported providing 50 or more hours of unpaid care per week. An inverse care law was found at the ecological level between the need for care and the proportion of the population who were working as qualified medical practitioners, dentists, and other health professionals. Informal care was almost perfectly positively correlated with the need for care (r = 0.97). These relationships were more marked for areas in the north of the country compared with the south. In the north more people provide unpaid care as more people need that care and because there are fewer working qualified medical professionals, other than nurses, providing such care per head.
Conclusions: Medical care is distributed inversely to need, whereas the provision of informal care is positively related to need — where care is most needed, informal care is most likely to be provided. The greater the market forces that are allowed to intervene in the relationships between the need for care and its provision, the more likely the inverse care law is to be found to apply. Where no market forces apply, where people give up their time for free to provide care, an almost perfectly positive care law is found to apply.
Keywords: censuses, delivery of health care, dentists, nurses, physicians
Introduction
The ‘inverse care law’ was first suggested by Tudor Hart in 1971, stating that medical services were distributed inversely to population health needs and, moreover, that this law operates more completely where medical care is most exposed to market forces:
‘In areas with most sickness and death, general practitioners [GPs] have more work, larger lists, less hospital support, and inherit more clinically ineffective traditions of consultation, than in the healthiest areas; and hospital doctors shoulder heavier case-loads with less staff and equipment, more obsolete buildings, and suffer recurrent crises in the availability of beds and replacement staff. These trends can be summed up as the inverse care law: that the availability of good medical care tends to vary inversely with the need of the population served.’1
This inverse care law has subsequently been found to apply to a range of health service provision; for example, the uptake of childhood immunisations, the use of child health services, the provision of coronary artery revascularisation and waiting times for cardiac surgery, transport accessibility in rural areas, the management of depression in primary care, the provision of health promotion clinics, GP consultation times in relation to the presence of psychological symptoms, advice giving in community pharmacies, and the take-up of annual health checks for the elderly.2-12 As Tudor Hart himself commented in 2000: ‘You name it, there's now some inverse law for it, or soon will be. The world never runs out of injustice’.13
Three decades on from the original paper, as the debate over the role of market forces in the National Health Service (NHS) intensifies, this observation continues to ring true. Here we consider the inverse care law in a new context: a) with data covering the whole of England and Wales, and b) considering not only medical care but also informal care. We ask the question ‘does empirical evidence support the notion that those most in need receive the least care?’.
Method
Our analysis is based on data for England and Wales from the 2001 census,14 aggregated to county, unitary, or former metropolitan authority level. These areas were used in this analysis to minimise the influence of cross-border commuting. For the first time, the census in 2001 asked questions on general health status as well as limiting long-term illness, on the qualifications and current employment status of healthcare workers (nurses, qualified medical practitioners, dentists, and other health professionals and therapists), and on the care provided by the population as a whole (those providing 50 or more hours of unpaid care per week). We calculated unweighted and weighted (for pop-ulation size) correlation coefficients for these variables, to investigate the relationship between health and care.
HOW THIS FITS IN
What do we know?
An ‘inverse care law’, stating that medical services are distributed inversely to population health needs, has been repeatedly demonstrated since it was first suggested in 1971.
What does this paper add?
Data from the 2001 census allow us for the first time to analyse the need for care in conjunction with the provision of both formal and informal care. This study demonstrates a ‘positive care law’, whereby formal medical care is provided inversely to need, but informal care is provided in direct proportion to need.
Results
In England and Wales in 2001, 3 894 870 people (7.6% of the population) stated that their health was not good and that they also lived with a limiting long-term illness (defined by the census as an ‘illness, health problem, or disability which limits your daily activities or the work you can do’).14 Although these are self-reported and hence subjective assessments of health, and some of these answers will have been imputed from forms that were not completed, the 2001 census is the most accurate and comprehensive source of information on this topic to date.15 For the purposes of this article we consider this group (7.6% of the population) as being those most in need of health care. Of this group of almost 4 million people, 54% are women (women make up 51% of the population as a whole), 54% live in the north compared with 44% of the population (Table 2; notes to Figure 1 and the discussion below give the definition of the north), one-third are aged over 70 years, a sixth are over 85 years, but 10% are aged under 40 years. Other than mothers giving birth, children in the first few months of life, and adults suffering an accident or injury, this group clearly includes the bulk of healthcare need in England and Wales.
Table 2.
Proportion of the population reporting limiting long-term illness and poor health (‘ill-health’), percentage of population providing 50+ hours care per week, percentage working in various healthcare professions, and unweighted and weighted correlations of those variables with ill health, England and Wales, 2001.
| Percentage of total population | Percentage female | Percentage in north | Correlation with ill health | P-value | Weighted correlationsa | P-value | |
|---|---|---|---|---|---|---|---|
| Total population (n = 51 107 639) | 51.3 | 44.4 | |||||
| Limiting long-term illness and poor health | 7.6 | 54.2 | 53.8 | 1.0 | 1.0 | ||
| Carers 50+hours unpaid per week | 2.1 | 60.0 | 52.9 | 0.968 | <0.001 | 0.961 | <0.001 |
| Working nurses | 0.8 | 90.6 | 46.5 | 0.310 | 0.001 | 0.275 | <0.001 |
| Working medical practitioner | 0.2 | 35.3 | 39.2 | −0.219 | 0.022 | 00.171 | <0.001 |
| Working dentists | 0.04 | 32.2 | 41.5 | −0.415 | <0.001 | −0.414 | <0.001 |
| Other working health professionals and therapists | 0.2 | 76.0 | 39.8 | −0.480 | <0.001 | −0.598 | <0.001 |
aWeighted for population size in 2001. Units of analysis are county, unitary or former metropolitan authorities.
Figure 1.
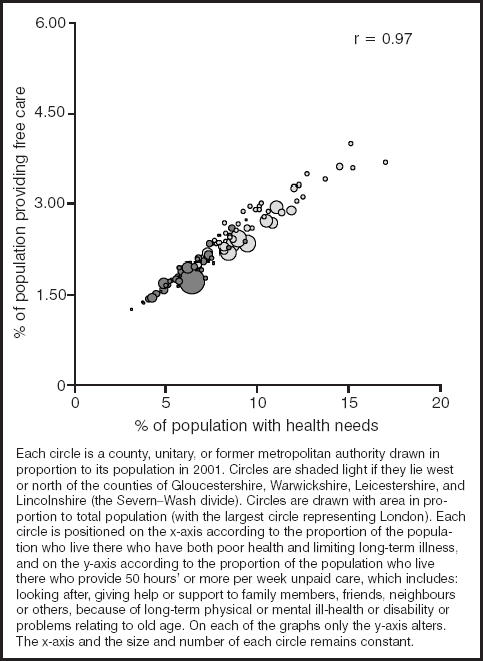
The relationship between the population with health needs and those providing care.
Over 1 million people in England and Wales stated on their census form that they provided at least 50 hours a week of unpaid care. This care was principally for people's health needs and included looking after and giving help or support to family members, friends, neighbours or others because of long-term physical or mental ill-health or disability or health problems relating to old age. Of these million carers, 7269 were aged 5–15 years; 8683 aged 16–19 years; 120 969 aged 20–34 years; 269 440 aged 35–49 years; 337 813 aged 50–64 years; 199 266 aged 65–74 years; 121 371 aged 75–84 years (for a complete age breakdown see Table 1); 20 513 were aged over 85 years; 60% were women; 21% were not in good health themselves but provided care to someone else in spite of that.
Table 1.
Number and rates of people providing 50+ hours of care per week, by age, in England and Wales, 2001.
| Age (years) | n(%) | Total population |
|---|---|---|
| 0–4 | – | 3 091 047 |
| 5–7 | 792 (0.04) | 1 945 633 |
| 8–9 | 863 (0.06) | 1 358 612 |
| 10–11 | 1360 (0.10) | 1 380 278 |
| 12–14 | 2982 (0.15) | 2 014 759 |
| 15 | 1272 (0.20) | 650 764 |
| 16–17 | 3684 (0.29) | 1 273 506 |
| 18–19 | 4999 (0.44) | 1 127 392 |
| 20–24 | 18 262 (0.61) | 2 969 687 |
| 25–34 | 102 707 (1.40) | 7 328 760 |
| 35–44 | 178 359 (2.32) | 7 701 510 |
| 45–49 | 91 081 (2.78) | 3 278 446 |
| 50–54 | 116 178 (3.25) | 3 572 315 |
| 55–59 | 113 027 (3.84) | 2 945 765 |
| 60–64 | 108 608 (4.29) | 2 530 113 |
| 65–74 | 199 266 (4.61) | 4 321 768 |
| 75–84 | 121 371 (4.33) | 2 806 237 |
| 85–89 | 16 785 (2.90) | 578 595 |
| 90 and over | 3728 (1.60) | 232 452 |
| Total | 1 085 324 (2.12) | 51 107 639 |
Figure 1 shows the remarkably close relationship, at the ecological level, between the provision of unpaid care and the need for that care. On average, one person provided 50 or more hours of unpaid care a week for every 3.58 people with the health needs described above. This ratio hardly varies at all across England and Wales. Clearly, some individuals in need of care will find that friends and family are more generous with their time than others, and this care is more likely to be provided by women. On a population level, however, there is no evidence that people are more or less altruistic in their care, when given for free, within any particular area of the country — it is provided (geographically) on the basis of need. We term this the ‘positive care law’, whereby informal care is provided in direct proportion to the degree that care is needed; the correlation coefficient for these two variables is 0.97 (P<0.001) (see Table 2 for all correlations calculated).
Figures 2, 3, 4 to 5 are similar to Figure 1 except that the y-axis of each graph is the proportion of qualified health professionals, from various specialisations, in employment in that occupation and living in each area. Obviously, many people commute, and so any disparity between need and care might be caused by commuting patterns. However, the vast majority of the disparities shown occur over the north–south divide. Doctors and nurses do not live in Oxford and Bristol and commute to Easington or Salford to work. The health professionals shown are, respectively: nurses, medical practitioners, dentists, and other health professionals with a professional qualification. Of these four groups only nurses (the largest in number and predominantly female) are geographically distributed roughly in proportion to need (r = 0.31, P = 0.001). Weighting the correlations for population size does not alter their rank order. An inverse care law applies (correlation coefficients are negative) to the distribution of people working in all of the more highly paid forms of healthcare, with that distribution being strongest for the fourth group — the group most likely to be providing private services (such as chiropractors and osteopaths).
Figure 2.
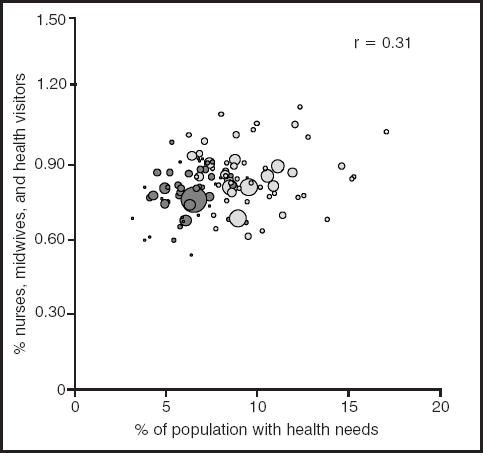
The relationship between the population with health needs and working qualified nurses, midwives, and health visitors.
Figure 3.
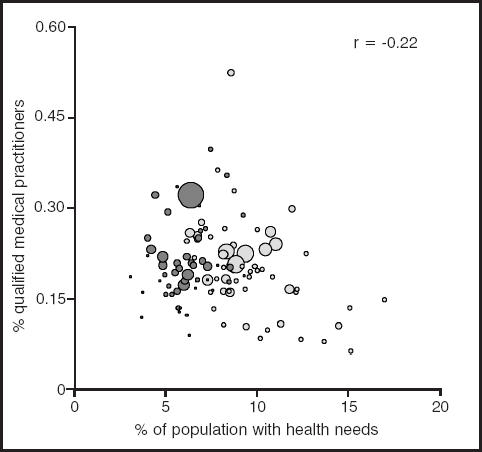
The relationship between the population with health needs and working qualified medical practitioners.
Figure 4.
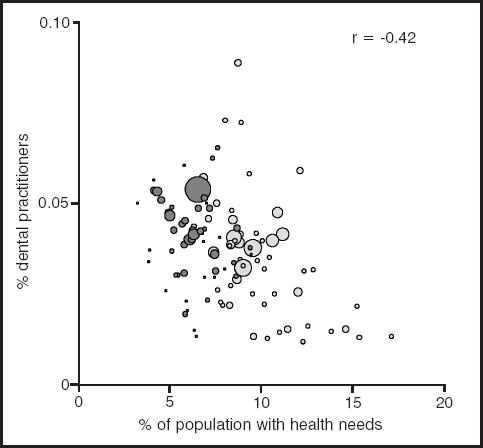
The relationship between the population with health needs and working qualified dental practitioners.
Figure 5.
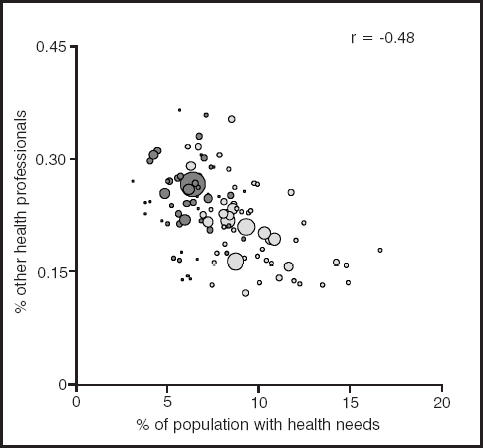
The relationship between the population with health needs and other working health professionals and therapists.
If formal care were distributed according to need, as with informal care, each circle in each figure would lie on the diagonal line running from the bottom left to the top right of the graph. Instead there is a large amount of deviation from that line. It is notable that those in the southern part of England (dark grey circles) tend to be positioned above the line and those elsewhere below the line.
Discussion
The census reveals that a considerable amount of care is provided by the friends and families of those in need. This care is provided at no cost to the state save the benefit payments and allowances that are paid to some carers. This care is provided in almost direct and exact proportion to need — defined here as the geographical distribution of people both suffering poor health and living with a limiting long-term illness. The observation of the ‘inverse care law’, as originally stated, can thus now be supplemented with additional data referring to the provision of informal care. We propose that an additional regularity, observed from analysis of the 2001 census data, can be stated as a ‘positive care law’, a law that takes into account not only medical care in the formal sector of paid work, but health care in its broadest sense. We suggest that the ‘positive care law’ can be stated thus:
‘In contemporary society, both informal and professional care are provided to those in need. When we consider these very different types of care, informal and formal, we observe that in those areas with most people in need, people disproportionately receive even more care from the informal, unpaid sector — the least skilled form of care. This is also the cheapest form of care (for the state) and const-itutes a group of carers without power or representation. Conversely, those people living in areas least in need of care (as defined here) receive the most specialised and skilled medical care through the formal paid sector. Between these two extremes there is a continuum. Formal medical care is thus distributed inversely to need whereas informal care is positively related to need — where care is most needed it is informal care that is most likely to be provided. Where market forces are allowed to intervene in the relationships between the need for care and its provision, the more likely the inverse care law is found to apply.’
These findings concern the motivations that underpin human actions, and the value that we ascribe to the services that we provide for each other. A key motivation for the provision of personal or medical care is traditionally considered to be altruism. The issue of whether the fundamental basis of human relationships operates through altruism or exchange, and the consequences of that, was central to the analysis in The Gift Relationship.16 Titmuss' analysis of the donation of human blood in the United Kingdom and the selling of human blood in the United States, has relevance for understanding ‘gift relationships’ — or how and why people help one another — more generally. When someone gives their blood to another person the act is altruistic, unselfish and unconditional. When a donor sells their blood, however, then the relationship is mechanical, impersonal and responsive to pressures of demand and supply.
However, the truly altruistic act, such as the gift relationship of giving blood, appears to be rare and is not easily measured, as Murray points out.17 Altruism implies a lack of connection and lack of reciprocation between the carer and the cared for, which characterises the giving of blood, and to some extent the provision of medical services, but is unlikely to be the case with informal care. In fact, it may be because people are connected, because they experience reciprocation, that they care for each other. Conversely, there are many collective actions that suggest that the population may be more altruistic than this simple reciprocal model would suggest, and that altruism is partly learnt behaviour. In the north of England more middle-class people tend to vote for left-wing politicians advocating redistributive policies, despite the implementation of these policies being to their direct immediate disadvantage. Perhaps the more you can see the benefits of altruistic behaviour, the more likely you are to act altruistically. On the other hand, the greater the role of the market, the more likely people are to be driven by motives other than altruism; the contrast between nurses and doctors, in terms of their choice of occupation, their salaries and in our results presented here, are an example of this.
It is important to note that this paper is only concerned with ecological data: the number of medical practitioners per head of the population as they vary between areas, the number of informal carers as a proportion of the population and the number in need of medical care. Within any area it is almost certainly the case that those most in need of care will be cared for by medical practitioners more than those who are in less need of care. It is important not to invoke the ecology fallacy and suggest that the sickest people in England and Wales are not cared for by paid carers. Nevertheless, this analysis does reveal that where there are more ill people there are fewer people, per head, being paid to provide medical care. There are also very large geographical distances between the areas where more doctors and dentists live and where the popul-ation is most in need of their services. Thus it is certainly the case that, by area, there is less paid care available overall where it is most needed, and most paid care available where it is least needed. Conversely, and everywhere in England and Wales, almost exactly the same proportions of people give up 50 or more hours per week of their time to care for those in need, unpaid. Altruism is found everywhere, but in greatest quantities where it is most needed.
This geographical division of England and Wales revealed through the data used in this paper is a division familiar to those who have studied the human geography of these countries over the last century. As the land rises to the north and west of Gloucestershire, Warwickshire, Leicestershire, and Lincolnshire, more people are ill and fewer medical professionals (other than nurses) are in work. People of all professions are more likely to live in the southeast of England; they are more likely to have achieved access to university from there, to return there if they trained in the north, or to move there later in their working lives. What is unusual about medical professionals is that, as a group, they manage to achieve this same south-eastern bias despite the majority of their most needy client group living in the north and despite the large majority of them working for the NHS, which partly allocates resources in relation to the needs of area populations. The 2001 census figures would suggest that a greater proportion of those resources are used to employ nurses in the north and doctors in the south of England.
Acknowledgments
We thank Julian Tudor Hart, Helena Tunstall, and two anonymous referees for their constructive comments on earlier drafts of this paper. Mary Shaw is funded by the South West Public Health Observatory, Bristol.
References
- 1.Hart JT. Inverse care law. Lancet. 1971;1:405–412. doi: 10.1016/s0140-6736(71)92410-x. [DOI] [PubMed] [Google Scholar]
- 2.Lynch M. Effect of practice and patient population characteristics on the uptake of childhood immunisations. Br J Gen Pract. 1995;45:205–208. [PMC free article] [PubMed] [Google Scholar]
- 3.Webb E, Naish J, Macfarlane A. Planning and commissioning of health services for children and young people. J Public Health Med. 1996;18(2):217–220. doi: 10.1093/oxfordjournals.pubmed.a024482. [DOI] [PubMed] [Google Scholar]
- 4.Payne N, Saul C. Variations in use of cardiology services in a health authority: comparison of coronary artery revascularisation rates with prevalence of angina and coronary mortality. BMJ. 1997;314:257–261. doi: 10.1136/bmj.314.7076.257. [DOI] [PMC free article] [PubMed] [Google Scholar]
- 5.Black N, Langham S, Petticrew M. Coronary revascularisation: why do rates vary geographically in the UK? J Epidemiol Community Health. 1995;49:408–412. doi: 10.1136/jech.49.4.408. [DOI] [PMC free article] [PubMed] [Google Scholar]
- 6.Pell JP, Pell AC, Norrie J, et al. Effect of socioeconomic deprivation on waiting time for cardiac surgery: retrospective cohort study. BMJ. 2000;320:15–18. doi: 10.1136/bmj.320.7226.15. [DOI] [PMC free article] [PubMed] [Google Scholar]
- 7.Lovett A, Haynes R, Sunnenberg G, Gale S. Car travel time and accessibility by bus to general practitioner services: a study using patient registers and GIS. Soc Sci Med. 2002;55(1):97–111. doi: 10.1016/s0277-9536(01)00212-x. [DOI] [PubMed] [Google Scholar]
- 8.Chew-Graham CA, Mullin S, May CR, et al. Managing depression in primary care: another example of the inverse care law? Fam Pract. 2002;19(6):632–637. doi: 10.1093/fampra/19.6.632. [DOI] [PubMed] [Google Scholar]
- 9.Gillam S. Provision of health promotion clinics in relation to population need: another example of the inverse care law? Br J Gen Pract. 1992;42:54–56. [PMC free article] [PubMed] [Google Scholar]
- 10.Stirling AM, Wilson P, McConnachie A. Deprivation, psychological distress, and consultation length in general practice. Br J Gen Pract. 2001;51:456–460. [PMC free article] [PubMed] [Google Scholar]
- 11.Rogers A, Hassell K, Noyce P, Harris J. Advice-giving in community pharmacy: variations between pharmacies in different locations. Health Place. 1998;4(4):365–373. doi: 10.1016/s1353-8292(98)00031-8. [DOI] [PubMed] [Google Scholar]
- 12.Chew C, Wilkin D, Glendinning C. Annual assessments of patients aged 75 years and over: views and experiences of elderly people. Br J Gen Pract. 1994;44:567–570. [PMC free article] [PubMed] [Google Scholar]
- 13.Hart JT. Commentary: three decades of the inverse care law. BMJ. 2000;320:18–19. [PubMed] [Google Scholar]
- 14.Office for National Statistics. Census 2001: national report for England and Wales. London: HMSO; 2003. [Google Scholar]
- 15.Dorling D, Rees P. A nation still dividing: the British census and social polarisation 1971-2001. Environ Plan A. 2003;35(7):1287–1313. [Google Scholar]
- 16.Titmuss RM. The gift relationship: from human blood to social policy. Harmondsworth: Penguin Books; 1970. [Google Scholar]
- 17.Murray TH. Are we better than we can say? Altruism in general practice. Br J Gen Pract. 2003;53:355–357. [PMC free article] [PubMed] [Google Scholar]