Abstract
Microbial biodegradation of environmental pollutants is a field of growing importance because of its potential use in bioremediation and biocatalysis. We have studied the characteristics of the global biodegradation network that is brought about by all the known chemical reactions that are implicated in this process, regardless of their microbial hosts. This combination produces an efficient and integrated suprametabolism, with properties similar to those that define metabolic networks in single organisms. The characteristics of this network support an evolutionary scenario in which the reactions evolved outwards from the central metabolism. The properties of the global biodegradation network have implications for predicting the fate of current and future environmental pollutants.
Introduction
The thousands of tonnes of petroleum that were discharged off the coasts of Galicia, Spain, by the oil tanker Prestige in 2002 is just one of the many examples of environmental catastrophes caused by the spillage of toxic chemicals in natural ecosystems. The ultimate fate of such compounds, as well as the natural capacity of the afflicted sites to respond to environmental insults, is a matter of growing concern. Some microorganisms and microbial communities have developed the ability to process recalcitrant, often xenobiotic compounds that do not form part of their central metabolism (CM) by transforming them into compounds that can enter into their CM (Parales et al., 2002). Such biodegradation processes have enormous potential for environmental cleanup (bioremediation; Dua et al., 2002) and in biocatalysis (green chemistry; Schmid et al., 2001).
The increasing knowledge about individual metabolic reactions and protein interactions has allowed the assembly of complete metabolic and protein-interaction networks (Gavin et al., 2002; Ho et al., 2002; Ito et al., 2000; Kanehisa et al., 2002; Rain et al., 2001; Uetz et al., 2000). In the same way, the increasing amount of information available about the strains, compounds, enzymes and reactions implicated in microbial biodegradation of toxic pollutants provides us with the building blocks for formulating a 'biodegradation network'. This issue is directly connected to systems biology, which complements the traditional study of genes and proteins as isolated entities with a new perspective that regards biological systems as consisting of components in a network of complex relationships. In these systems, the whole is more than the sum of the parts, and some of the properties of the system cannot be understood from the properties of its individual components, thus requiring the study of the network as a whole. The first studies of the properties of biological networks, for example, metabolic networks, protein-interaction networks and genetic control networks (Jeong et al., 2000, 2001; Ravasz et al., 2002), revealed new facets of living systems (Alves et al., 2002; Fraser et al., 2002; Guelzim et al., 2002; Ideker et al., 2001; Jeong et al., 2001; Maslov & Sneppen, 2002; Rison & Thornton, 2002). One of the main ideas to come out of this research is that the topology of these biological networks is not random, but has a typical structure, known as 'scale-free'. In these networks, the distribution of connectivity is not homogeneous, but follows a power law: there are a few highly connected nodes (hubs) and the rest have low connectivity (Barabási & Albert, 1999). This is in contrast with random networks, where connectivity follows a Poisson distribution. Scale-free networks have two main properties: the pathway between any two nodes is always short because the hubs act as shortcuts, and they are tolerant against random perturbations (elimination of components) because there are always alternative pathways through the hubs.
Here, we present the first systematic study of the microbial biodegradation of environmental pollutants from a systems-biology perspective. We examined the structure of the biodegradation network, its connectivity, the characteristics of chemical compounds and enzymes depending on their network context, and other descriptors of the network.
Results
Topology of the network
We put together the chemical reactions that are implicated in biodegradation in a single graph, in which the reactions are the edges and the chemical compounds are the nodes (see the Methods section for details of construction; see http://pdg.cnb.uam.es/biodeg_net for representations of the graph). When the graph is assembled, it is possible to study its topological characteristics. The log–log plots of connectivity against the number of nodes (chemical compounds in this case) at each level of connectivity reveal a clear scale-free structure (Fig. 1). This behaviour is seen when all the connections are considered and also when the plots are limited to the incoming or outgoing connections. In all three cases, the relationship between the number of compounds (p(k)) and the number of connections (k) can be expressed as p(k) ≈ k−γ. This indicates the non-random structure of the network and the presence of a few highly connected compounds connecting the bulk of poorly connected compounds.
Figure 1.
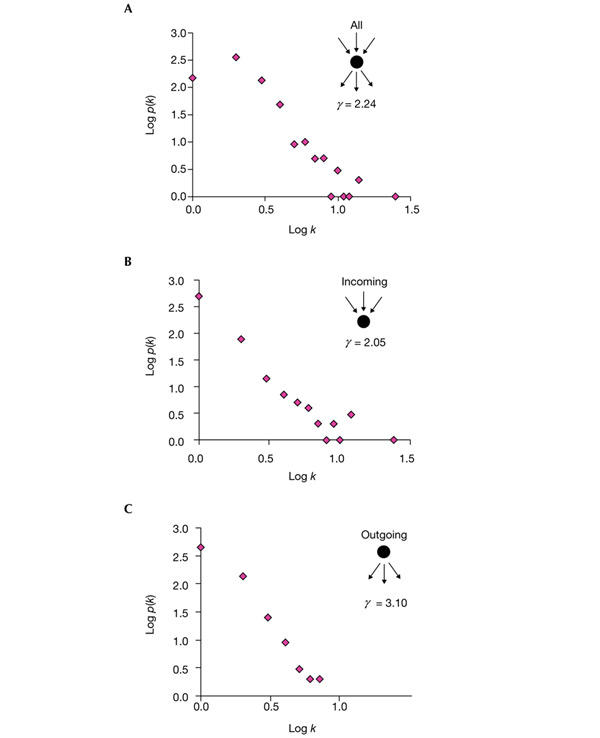
Log–log plots of the number of compounds versus connectivity. (A) All connections in which the chemical compound is implicated (either as a substrate or as a product) are counted. (B) Only the incoming connections (with the compound as a product) are counted. (C) Only the outgoing connections (with the compound as a substrate) are counted. The exponents of the power law distributions are shown (γ). k, connectivity; p(k), number of compounds.
The 'exponent' of the network (γ) ranges between 2 and 3 (Fig. 1) and is similar to that reported for metabolic networks (γ = 2.2; Jeong et al., 2000). The diameter of the network (average distance between compounds; see Methods) is 5.5, which is also similar to that reported for metabolic networks (between 2 and 5; Jeong et al., 2000). An interesting parameter is the distance to the CM, the length of the shortest biodegradative pathway for a given compound. This distance ranges from 0 (compounds that already belong to the CM) to 14 (compounds that need many transformation steps to enter the CM). The average is 3.3, indicating that most of the compounds need just 3 or 4 steps to be biodegraded. These short pathways are possible because of the scale-free structure of the network.
Other topological properties are specific to the biodegradation network. The relationship between the number of incoming (ci) and outgoing (co) connections for each compound reveals a 'concentrating' structure, in which several key compounds have many more incoming than outgoing connections (Fig. 2A). There are no nodes with high ci and high co, in contrast with metabolic networks in which there are metabolites such as pyruvate that participate in many reactions as reactants or as products. The network acts as a 'funnel', concentrating the 'flux' of compounds to the CM. There is a clear tendency for the highly connected compounds (hubs) to be close to the CM, whereas poorly connected compounds are distributed throughout the whole network (Fig. 2B). Compounds that cannot reach the CM have few connections (Fig. 2B).
Figure 2.
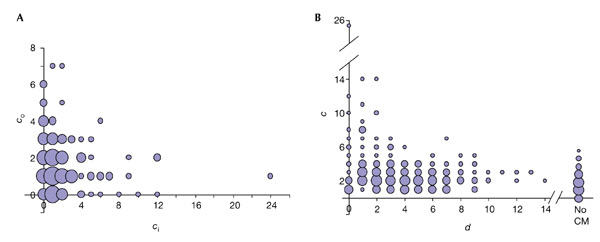
Connections of the chemical compounds. (A) Relationship between the number of incoming connections (ci) and the number of outgoing ones (co) for the chemical compounds. (B) Relationship between the total number of connections for a compound (c) and its distance (d) to the central metabolism (CM). 'No CM' indicates that there is no pathway to the CM. In both cases, the radii of the circles are proportional to the number of elements (in a logarithmic scale).
Properties of the chemical compounds
We studied the properties of the compounds that are present at different distances to the CM. There is a relationship between the molecular weight and water solubility of the compounds and their distance to the CM. Large and insoluble compounds tend to be far away from the CM (Fig. 3). This obvious fact, known before and quantified here, is related to the difficulty in degrading large and poorly soluble compounds. In other words, there are no reactions that can connect them directly to the highly connected nodes because of their chemical structure and properties, and hence more complex pathways are needed.
Figure 3.
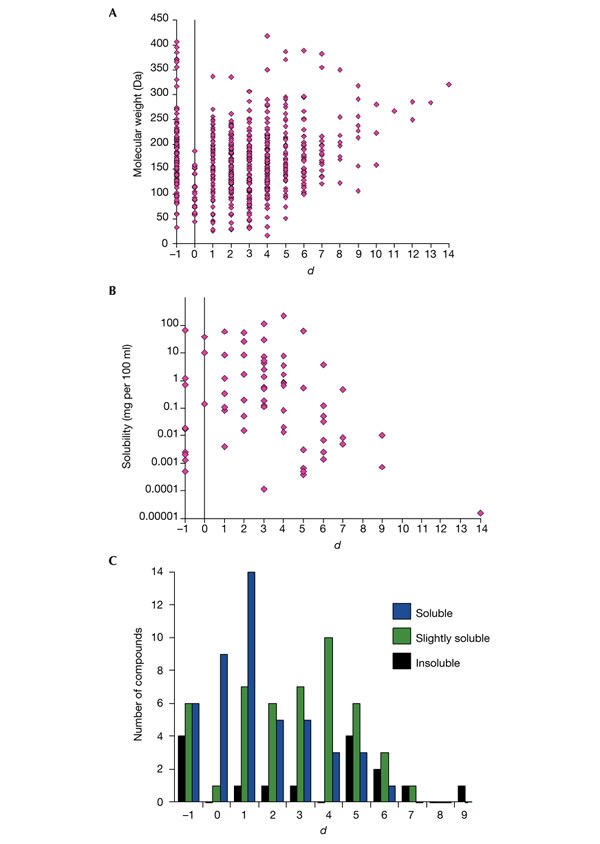
Relationship between chemical properties of the compounds and their position in the network. (A) Relationship between molecular weights of the compounds and their distance to the central metabolism (CM). (B,C) Relationship between water solubility of the compounds and their distance to the CM. (B) Compounds for which it was possible to obtain a numerical value for solubility. (C) Compounds for which the solubility was described qualitatively (soluble, slightly soluble and insoluble). The bars represent the number of compounds in each category of solubility, at a given distance from the CM. (d = −1 indicates that there is no pathway to the CM).
Properties of the enzymes
We have studied the relationship between the distance of the enzymes to the CM and their enzymatic activities (represented by the first number of their Enzyme Commission (EC) codes). Ligases (EC 6.-.-.-) are only present close to the CM, mainly because of the many reactions that involve coenzyme A (CoA) binding. Three other activities, transferases (EC 2.-.-.-), isomerases (EC 5.-.-.-) and, to a lesser extent, hydrolases (EC 3.-.-.-) are also mainly concentrated in the region close to the CM (data not shown).
Two hypotheses can explain the scale-free structure of a network. First, the network might have evolved from a random network to a scale-free one (by adding and deleting connections) because of the advantages of the scale-free topology (for example, tolerance to perturbations). Second, the network might have evolved from a seed by adding new connections, not randomly, but in such a way that the probability of a new connection ending in a hub is higher than that of its ending in a poorly connected node (that is the explanation, for example, for the scale-free structure of the World Wide Web connections, in which new links are added preferentially to popular websites). Two observations favour the second model for the generation of the biodegradation network. First, the biodegradation network seems to be less tolerant of errors than the metabolic network (Jeong et al., 2000). This has been simulated by removing up to 200 connections (reactions) randomly (see Methods). On average, the effect of introducing n mutations is that 1.6n compounds lose their pathway to the CM, although the increase in the pathway length for the remaining compounds is small (Fig. 4). Second, the most 'ancient' enzymes (those present in many organisms) are only present close to the CM, suggesting that this is the most ancient part of the network (Fig. 5). 'Newer' enzymes are present both close to and far away from the CM.
Figure 4.
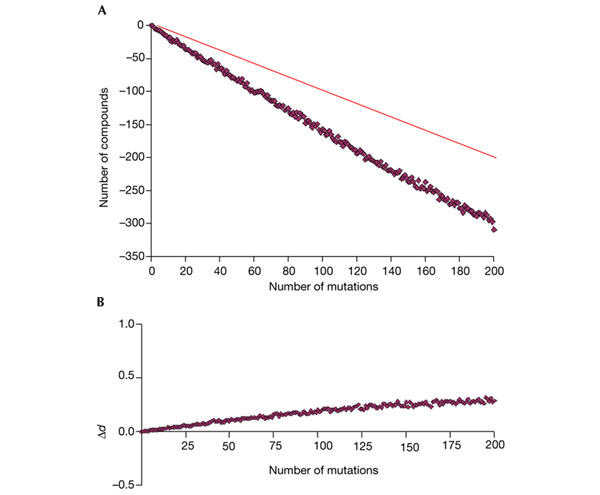
Simulation of perturbations in the network. The x axes represent the number of mutations introduced (reactions removed). (A) Number of compounds that lost their pathways to the central metabolism (CM) after that number of mutations. The continuous line represents the loss of one compound for each mutation introduced. (C) Increase in the distance to the CM for the remaining compounds (Δd).
Figure 5.
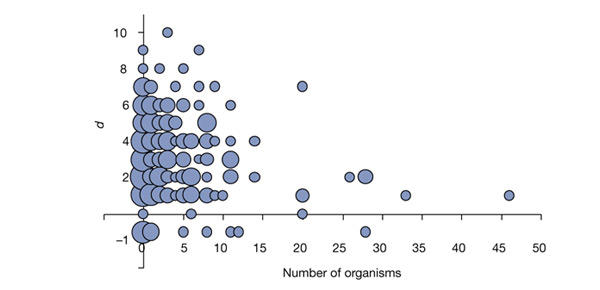
Relationship between the antiquity of the enzymes, measured as the number of organisms in which their genes are present, and their distance to the central metabolism (CM). d = −1 indicates that there are no pathways to the CM. The radii of the circles are proportional to the number of elements (in logarithmic scale).
Thus, the scale-free structure of the biodegradation network seems to be related to its historical evolution: the network evolved from the CM outwards, and the connection of new compounds preferentially to highly connected ones seems to be favoured by the selection of shorter and more efficient pathways to the CM.
Discussion
In this work, we have studied a large set of chemical reactions that are implicated in biodegradation to obtain quantitative insights in its organization and possible mechanism of evolution.
The main properties found include the position of central hubs and basic ancient functions close to the CM, with large and difficult-to-degrade compounds more concentrated in the periphery. All the analyses point to a model of growth from the CM towards the more diversified reactions, a model that may be connected with the history of biodegradation on Earth. These characteristics are summarized in a model for the structure and evolution of the biodegration network (Fig. 6). In this study, we have quantified and given support to many facts that were previously suspected.
Figure 6.
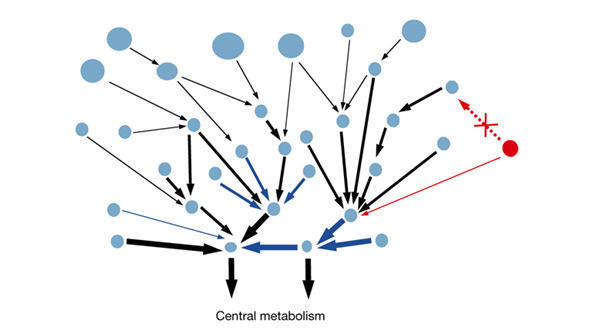
Structure, properties and evolution of the biodegradation network. Chemical compounds are represented by circles, the areas of which are proportional to molecular weight. Reactions are represented by arrows, the widths of which are proportional to the antiquity of the catalysing enzyme. Blue arrows represent the ligase (Enzyme Commission 6.-.-.-) enzymatic activity that is often found close to the central metabolism. The red circle represents a new compound to be degraded. If two possibilities exist for attaching it to the network, it is preferentially connected to a node that is already highly connected (a hub).
This analysis of the biodegradation network has two main differences to equivalent studies of full metabolic or protein-interaction networks. First, we are close to knowing the full metabolic and protein-interaction networks for some model organisms (despite some important limitations (Lakey & Raggett, 1998; Legrain et al., 2001) that are not discussed here), whereas this is not the case for biodegradation, for which only part of the network is known. Moreover, we might have knowledge of as little as 5% of the microbial diversity of the biosphere (Curtis et al., 2002). Second, reactions implicated in biodegradation are carried out by organisms that live in different environments, oxygen tensions and physico-chemical conditions, whereas we mix all of these together in the same network. Although this would be a major problem if such a diversity of carriers were static in space and time, the reality is that microbial communities move and evolve over time, not only in terms of species composition, but also in tems of massive horizontal gene-transfer events (Wilkins, 2002).
The biodegradation network presented in this article is an authentic network only if we consider the whole microbial ecosystem of the biosphere as a non-compartmentalized global reality, thus allowing the free movement of strains. Although this is not entirely true, there is increasing evidence that bacterial species with unexpected degradative abilities can be found in even the most pristine sites (Fulthorpe et al., 1998). The biodegradation of xenobiotic compounds by microbial communities, which transfer substrates and products between each other and cooperate metabolically, has been known for a long time (Abraham et al., 2002; Pelz et al., 1999). In addition, intra-species and inter-species horizontal transfer of DNA is far more frequent than was anticipated (Wilkins, 2002). This is exemplified by the worldwide spread of antibiotic-resistance genes (Leverstein-van Hall et al., 2002) and by the bioaugmentation of the biodegradative abilities of microbial communities through directed catabolic gene transfer (Dejonghe et al., 2000). Finally, atmospheric phenomena mobilize and spread considerable amounts of environmental pollutants to sites far from their original sources (Carrera et al., 2002).
Several models have been proposed for explaining the evolution of metabolism. The main ones are the 'retroevolution' model (Horowitz, 1945), which assumes that enzymes evolved from other enzymes that function at subsequent stages in a pathway to replenish the exhausted substrates of the latter, and the 'recruitment' model (Jensen, 1976), which proposes that new enzymes are created by duplication and adaptation of similar enzymes from other pathways. In most of the cases analysed in detail using whole-genome information, it seems that the most common situation is the assembly of pathways from a series of gene duplication events, followed by their later specialization. The biodegradation network described here seems to fit this model, growing by the recruitment of new enzymes in the periphery of the network to degrade compounds as close as possible to well-connected hubs. This model arises from the partial data that we are dealing with. Further studies and the continuous expansion of databases will provide a clearer picture of the evolutionary scenario.
These facts make our network model an instrument for understanding the evolution of new pathways for the degradation of xenobiotics and the global capacities of the microbial world to face existing and future environmental insults. The properties of the network provide the basis for predicting the abilities of existing (and even not-yet synthesized) chemicals to undergo biological degradation and for quantifying the evolutionary rate for their elimination in the future. The properties presented here could also help in the design of 'biodegradative genomes' from scratch (Zimmer, 2003).
Figure 6 illustrates all the described characteristics of the biodegradation network (see http://pdg.cnb.uam.es/biodeg_net for full representations of the real network, coloured according to some of the parameters discussed).
Methods
The main source of information for constructing the biodegradation network was the University of Minnesota Biocatalysis/Biodegradation Database (UMBBD; March 2002 version; http://umbbd.ahc.umn.edu/; Ellis et al., 2001). Other sources of information on enzymes and compounds were the ENZYME database (http://www.expasy.ch/enzyme/; Bairoch, 2000) and the ChemFinder database (http://chemfinder.cambridgesoft.com/), respectively.
The biodegradation network is a directed graph in which the nodes are the chemical compounds and the edges are the reactions, leading from the substrate to the product. When a reaction has more than one substrate or product, all the possible connections between substrates and products are constructed. Commonly available chemical compounds that are not limiting factors in the reactions, such as water and ions, are not included in the network. The compounds have associated properties (molecular weight, solubility, and so on) as do the reactions (enzyme, EC code, organisms in which that enzyme is present, and so on). All the reactions in UMBBD are included in the network, regardless of their aerobic or anaerobic nature, the organisms in which the enzymes are present, and so on. The final network was composed of 740 compounds connected by 821 reactions, of which 678 had associated enzymatic activity and 308 had specific enzymatic activity (values in the four positions of the EC code, not a generic enzymatic class).
Mutations in the network were simulated by removing reactions randomly. The result for every mutation experiment was averaged for 100 repetitions.
The distance of a given compound to the CM is defined as the minimum number of reactions required for getting from that compound to any compounds that belong to the CM (the shortest biodegradative pathway, or number of edges visited in the directed graph described above). The assignation of compounds to the CM was taken from UMBBD. The distance between two compounds is defined in the same way. The diameter of the network is defined as the average distance for all pairs of compounds. The distance of a given reaction (or enzyme) to the CM is defined as the distance of its substrates to the CM.
Acknowledgments
We acknowledge the maintainers of the databases used in this study, which were invaluable sources of information for this work. We also acknowledge U. Bastolla (Center for Astrobiology (INTA-CSIC)), M. Tress and R. Hoffmann (Protein Design Group (CNB-CSIC)) for critical reading of and suggestions on the manuscript. This work was supported by European contracts QLK3-CT-2002-01933, QLK3-CT-2002-01923, QLRT-2001-00015 and INCO-CT-2002-1001, by grants BIO2001-2274 and BIO2000-1358-C02-01 from the Spanish Comisión Interministerial de Ciencia y Tecnología (CICYT) and by the Strategic Research Groups Program of the Autonomous Community of Madrid.
References
- Abraham W.R., Nogales B., Golyshin P.N., Pieper D.H. & Timmis K.N. ( 2002) Polychlorinated biphenyl-degrading microbial communities in soils and sediments. Curr. Opin. Microbiol., 5, 246–253. [DOI] [PubMed] [Google Scholar]
- Alves R., Chaleil R.A.G. & Sternberg M.J.E. ( 2002) Evolution of enzymes in metabolism: a network perspective. J. Mol. Biol., 320, 751–770. [DOI] [PubMed] [Google Scholar]
- Bairoch A. ( 2000) The ENZYME database in 2000. Nucleic Acids Res., 28, 304–305. [DOI] [PMC free article] [PubMed] [Google Scholar]
- Barabási A.L. & Albert R. ( 1999) Emergence of scaling in random networks. Science, 286, 509–512. [DOI] [PubMed] [Google Scholar]
- Carrera G. et al. ( 2002) Atmospheric deposition of organochlorine compounds to remote high mountain lakes of Europe. Environ. Sci. Technol., 36, 2581–2588. [DOI] [PubMed] [Google Scholar]
- Curtis T.P., Sloan W.T. & Scannell J.W. ( 2002) Estimating prokaryotic diversity and its limits. Proc. Natl Acad. Sci. USA, 99, 10494–10499. [DOI] [PMC free article] [PubMed] [Google Scholar]
- Dejonghe W. et al. ( 2000) Effect of dissemination of 2,4-dichlorophenoxyacetic acid (2,4-D) degradation plasmids on 2,4-D degradation and on bacterial community structure in two different soil horizons. Appl. Environ. Microbiol., 66, 3297–3304. [DOI] [PMC free article] [PubMed] [Google Scholar]
- Dua M., Singh A., Sethunathan N. & Johri A.K. ( 2002) Biotechnology and bioremediation: successes and limitations. Appl. Microbiol. Biotechnol., 59, 143–152. [DOI] [PubMed] [Google Scholar]
- Ellis L.B.M., Hershberger C.D., Bryan E.M. & Wackett L.P. ( 2001) The University of Minnesota Biocatalysis/Biodegradation Database: emphasizing enzymes. Nucleic Acids Res., 29, 340–343. [DOI] [PMC free article] [PubMed] [Google Scholar]
- Fraser H.B., Hirsh A.E., Steinmetz L.M., Scharfe C. & Feldman M.W. ( 2002) Evolutionary rate in the protein interaction network. Science, 296, 750–752. [DOI] [PubMed] [Google Scholar]
- Fulthorpe R.R., Rhodes A.N. & Tiedje J.M. ( 1998) High levels of endemicity of 3-chlorobenzoate-degrading soil bacteria. Appl. Environ. Microbiol., 64, 1620–1627. [DOI] [PMC free article] [PubMed] [Google Scholar]
- Gavin A.C. et al. ( 2002) Functional organisation of the yeast proteome by systematic analysis of protein complexes. Nature, 415, 141–147. [DOI] [PubMed] [Google Scholar]
- Guelzim N., Bottani S., Bourgine P. & Képès F. ( 2002) Topological and causal structure of the yeast transcriptional regulatory network. Nature Genet., 31, 60–63. [DOI] [PubMed] [Google Scholar]
- Ho Y. et al. ( 2002) Systematic identification of protein complexes in Saccharomyces cerevisiae by mass spectrometry. Nature, 415, 180–183. [DOI] [PubMed] [Google Scholar]
- Horowitz N.H. ( 1945) On the evolution of biochemical syntheses. Proc. Natl Acad. Sci. USA, 31, 153–157. [DOI] [PMC free article] [PubMed] [Google Scholar]
- Ideker T. et al. ( 2001) Integrated genomic and proteomic analyses of a systematically perturbed metabolic network. Science, 292, 929–934. [DOI] [PubMed] [Google Scholar]
- Ito T. et al. ( 2000) Toward a protein–protein interaction map of the budding yeast: a comprehensive system to examine two-hybrid interactions in all possible combinations between the yeast proteins. Proc. Natl Acad. Sci. USA, 97, 1143–1147. [DOI] [PMC free article] [PubMed] [Google Scholar]
- Jensen R.A. ( 1976) Enzyme recruitment in evolution of new function. Annu. Rev. Microbiol., 30, 409–425. [DOI] [PubMed] [Google Scholar]
- Jeong H., Tombor B., Albert R., Oltvai Z.N. & Barabási A.L. ( 2000) The large-scale organization of metabolic networks. Nature, 407, 651–653. [DOI] [PubMed] [Google Scholar]
- Jeong H., Mason S.P., Barabási A.L. & Oltvai Z.N. ( 2001) Lethality and centrality in protein networks. Nature, 411, 41–42. [DOI] [PubMed] [Google Scholar]
- Kanehisa M., Goto S., Kawashima S. & Nakaya A. ( 2002) The KEGG databases at GenomeNet. Nucleic Acids Res., 30, 42–46. [DOI] [PMC free article] [PubMed] [Google Scholar]
- Lakey J.H. & Raggett E.M. ( 1998) Measuring protein–protein interactions. Curr. Opin. Struct. Biol., 8, 119–123. [DOI] [PubMed] [Google Scholar]
- Legrain P., Wojcik J. & Gauthier J.M. ( 2001) Protein–protein interaction maps: a lead towards cellular functions. Trends Genet., 17, 346–352. [DOI] [PubMed] [Google Scholar]
- Leverstein-van Hall M.A., Box A.T., Blok H.E., Paauw A., Fluit A.C. & Verhoef J. ( 2002) Evidence of extensive interspecies transfer of integron-mediated antimicrobial resistance genes among multidrug-resistant Enterobacteriaceae in a clinical setting. J. Infect. Dis., 186, 49–56. [DOI] [PubMed] [Google Scholar]
- Maslov S. & Sneppen K. ( 2002) Specificity and stability in topology of protein networks. Science, 296, 910–913. [DOI] [PubMed] [Google Scholar]
- Parales R.E., Bruce N.C., Schmid A. & Wackett L.P. ( 2002) Biodegradation, biotransformation, and biocatalysis (b3). Appl. Environ. Microbiol., 68, 4699–4709. [DOI] [PMC free article] [PubMed] [Google Scholar]
- Pelz O., Tesar M., Wittich R.M., Moore E.R., Timmis K.N. & Abraham W.R. ( 1999) Towards elucidation of microbial community metabolic pathways: unravelling the network of carbon sharing in a pollutant-degrading bacterial consortium by immunocapture and isotopic ratio mass spectrometry. Environ. Microbiol., 1, 167–174. [DOI] [PubMed] [Google Scholar]
- Rain J.C. et al. ( 2001) The protein-protein interaction map of Helicobacter pylori. Nature, 409, 211–215. [DOI] [PubMed] [Google Scholar]
- Ravasz E., Somera L., Mongru D.A., Oltvai Z.N. & Barabási A.L. ( 2002) Hierarchical organization of modularity in metabolic networks. Science, 297, 1551–1555. [DOI] [PubMed] [Google Scholar]
- Rison S.G.C. & Thornton J.M. ( 2002) Pathway evolution, structurally speaking. Curr. Opin. Struct. Biol., 12, 374–382. [DOI] [PubMed] [Google Scholar]
- Schmid A., Dordick J.S., Hauer B., Kiener A., Wubbolts M. & Witholt B. ( 2001) Industrial biocatalysis today and tomorrow. Nature, 409, 258–268. [DOI] [PubMed] [Google Scholar]
- Uetz P. et al. ( 2000) A comprehensive analysis of protein–protein interactions in Saccharomyces cerevisiae. Nature, 403, 623–631. [DOI] [PubMed] [Google Scholar]
- Wilkins B.M. ( 2002) Plasmid promiscuity: meeting the challenge of DNA immigration control. Environ. Microbiol., 4, 495–500. [DOI] [PubMed] [Google Scholar]
- Zimmer C. ( 2003) Tinker, tailor: can Venter stitch together a genome from scratch? Science, 299, 1006–1007. [DOI] [PubMed] [Google Scholar]


