

Abstract
Assembly of the coat protein I (COPI) vesicle coat is controlled by the small GTPase ADP ribosylation factor 1 (ARF1) and its GTPase-activating protein, ARFGAP1. Here, we investigate the diffusional behaviours of coatomer, the main component of the coat, and also those of ARF1 and ARFGAP1. Using fluorescence-correlation spectroscopy, we found that most ARF1 and ARFGAP1 molecules are highly mobile in the cytosol (diffusion constant D ≈ 15 μm2 s−1), whereas coatomer diffuses 5–10 times more slowly than expected (D ≈ 1 μm2 s−1). This slow diffusion causes diffusion-limited binding kinetics to Golgi membranes, which, in FRAP (fluorescence recovery after photobleaching) experiments, translates into a twofold slower binding rate. The addition of aluminium fluoride locks coatomer onto Golgi membranes and also decreases the binding kinetics of both ARF1 and ARFGAP1, suggesting that these proteins function in concert to mediate sorting and vesicle formation.
Introduction
Newly synthesized proteins move through the secretory pathway in membrane-bound structures that originate from the endoplasmic reticulum (ER). Forward movement is offset by the recycling of resident proteins. Two recycling mechanisms exist in mammalian cells, one that is mediated by coat protein I (COPI) vesicles, and another that is independent of known coat proteins (for a review, see Storrie & Nilsson, 2002). Whereas COPI-independent recycling is poorly understood, COPI-dependent recycling has been characterized extensively. After nucleotide exchange (GDP to GTP), the small GTPase ADP ribosylation factor 1 (ARF1) becomes firmly attached to Golgi membranes, whereas on GTP hydrolysis ARF1 is released back into the cytoplasm, an event that requires an activating protein, ARF GTPase-activating protein 1 (ARFGAP1). While it is present on membranes, ARF1 is able to recruit coatomer, the main coat component of COPI. Coatomer, as well as ARF1 and ARFGAP1, can also bind individually to cytosolic domains of resident proteins. The formation of vesicles in vitro requires only ARF1 and coatomer (Ostermann et al., 1993; Spang et al., 1998) when a non-hydrolysable GTP derivative, GTPγS, is used. However, the incorporation of cargo proteins requires GTP hydrolysis by ARF1 (Lanoix et al., 1999, 2001; Malsam et al., 1999; Pepperkok et al., 2000). How GTP hydrolysis by ARF1, which is known to release coatomer, promotes sorting into COPI buds and vesicles can be explained in terms of a kinetic proofreading mechanism (Weiss & Nilsson, 2003).
Despite many advances in the understanding of the biogenesis of COPI vesicles, the binding and assembly kinetics of the COPI-vesicle machinery are poorly characterized. Recent studies of the binding kinetics of ARF1 and coatomer in vivo, using fluorescence recovery after photobleaching (FRAP; Presley et al., 2002), unexpectedly revealed that coatomer shows a twofold slower recovery than ARF1, suggesting that release of coatomer from membranes occurs by mechanisms that do not involve ARF1. This interpretation was supported by the observation that on addition of aluminium fluoride, coatomer was locked onto the membrane, whereas ARF1 detached with unperturbed kinetics.
Here, we have determined the cytosolic mobilities of GFP-tagged COPI components. We find that coatomer is nearly an order of magnitude less mobile in the cytoplasm than would be theoretically expected, whereas ARF1 and ARFGAP1 are highly mobile. However, ARF1 and ARFGAP1 are also found in slow-moving fractions that are likely to represent the formation of complexes with other factors. We also show that the binding kinetics of ARFGAP1 to Golgi membranes are similar to those of ARF1 and confirm the apparent twofold slower binding kinetics of coatomer (Presley et al., 2002). On the basis of computer simulations, however, we suggest that this is due to diffusion-limited kinetics of coatomer.
Results and Discussion
FRAP can be used to determine the diffusional mobilities of fluorescently labelled molecules: on bleaching an area of interest (typically several square micrometres), the diffusion constant of the molecule can be deduced from the recovery of fluorescence. Alternatively, FRAP can be used to monitor the dynamic exchange of peripheral membrane proteins. The fluorescence recovery rate in this case is a combination of attachment and detachment rates of the peripheral protein. This only holds true, however, if the time needed for the molecules to diffuse through the cytoplasm towards the target is short. This can be tested by assessing the diffusion coefficient with FRAP, in which restricting the bleaching to the focal spot gives high temporal and lateral resolution (for a review, see Elson & Qian, 1989). Alternatively, fluorescence-correlation spectroscopy (FCS) can be used to determine the diffusion constant by monitoring the Brownian movement of individual proteins without bleaching the cell. FCS monitors fluctuations of the fluorescence that arise due to the diffusion of single green fluorescent protein (GFP)-tagged molecules in a confocal volume of ∼1 μm3. Calculating the autocorrelation function C(τ) of the recorded fluorescence time series F(t), one can determine from the characteristic decay time of C(τ), the diffusion coefficient D of the protein of interest. FCS provides information more readily about the state of the molecules; that is, if a portion associates with other molecules, this will give both free/fast and bound/slow populations. In this study, we combine FCS and FRAP to analyse the main COPI components: coatomer, ARF1 and ARFGAP1.
Full-length complementary DNAs encoding GFP and GFP-tagged ARF1, ARFGAP1 and ε-COP were expressed in HeLa and Chinese hamster ovary (CHO) cells and monitored by FCS (see Methods). For free GFP in the cytoplasm, the data were best described by a single diffusing component with a diffusion coefficient of D ≈ 25 μm2 s−1, indicating an approximately threefold to fourfold higher viscosity of cytoplasm as compared with buffer (Fig. 1A). For ARF1 (Fig. 1B), we saw two components that contribute to C(τ): a fast and a slow population, with diffusion coefficients D ≈ 15 μm2 s−1 and D ≈ 0.5 μm2 s−1, respectively, being present in average proportions of 85% and 15%, respectively. The faster component is consistent with the expectations for monomeric ARF1–GFP (see Methods), whereas the slower fraction is probably due to complex formation with other proteins. For ARFGAP1 (Fig. 1C), we saw similar curves: that is, a fast population (70%; D ≈ 13 μm2 s−1; consistent with the theor-etical expected value), and a minority of slow molecules (30%; D ≈ 0.5 μm2 s−1). The slow diffusion of the minor ARFGAP1 fraction suggested complex formation of ARFGAP1 with a larger protein complex, such as coatomer. To test this, we increased the level of cytosolic coatomer by applying brefeldin A (BFA), which causes the release of coatomer from Golgi membranes (Helms & Rothman, 1992). In support of our hypothesis, we found that the average fraction of the slow component of ARFGAP1 increased from 30% to about 50% (Fig. 1C), whereas C(τ) for ARF1 was not affected (data not shown).
Figure 1.

Cytoplasmic mobility of COPI proteins. Representative fluorescence-correlation spectroscopy (FCS) curves for (A) green fluorescent protein (GFP) in buffer and cytoplasm, (B) ADP ribosylation factor 1 (ARF1), (C) ARF GTPase-activating protein 1 (ARFGAP1) and (D) ε-COP (ε-coat-protein) in HeLa cells (black lines), with best fits according to equation (1) (red symbols; see Methods). The autocorrelation function C(τ) shown for ARF1 involves a fast (87%; D ≈ 15 μm2 s−1; where D is the diffusion coefficient) and a slow (13%; D ≈ 0.5 μm2 s−1) population, which is probably because of interactions with nucleotide-exchange factors. Similarly, ARFGAP1 shows a large, fast pool (40%; D ≈ 13 μm2 s−1) and a minority of slow molecules (60%; D ≈ 0.5 μm2 s−1), which increased on addition of brefeldin A (BFA). The FCS curve of ε-COP comprises a fast component (73%; D ≈ 16 μm2 s−1), due to monomeric ε -COP, and a slow one (27%; D ≈ 0.5 μm2 s−1), due to ε -COP, which is incorporated into coatomer. (E) In untreated Chinese hamster ovary (CHO) cells, the FCS curve also showed two components (left curve, fast, 45%; D ≈ 16 μm2 s−1; slow, 55%; D ≈ 0.5 μm2 s−1), and applying BFA to release coatomer from Golgi membranes increased the slow component (to 68%). (F) Knocking out the β-COP subunit of coatomer reduced the slow component to less than 20%. This confirms that the slow component is the coatomer complex. RNAi, RNA intereference.
We then determined the mobility of coatomer using GFP-tagged ε-COP stably expressed in HeLa (Fig. 1D) and CHO (Fig. 1E) cells. As expected, we saw a fast component (HeLa cells, 74%; D ≈ 16 μm2 s−1; CHO cells, 48%; D ≈ 16 μm2 s−1), which was consistent with the theoretical expectations for free, mono-meric ε-COP–GFP. The slower component (HeLa cells, 26%; D ≈ 0.5 μm2 s−1; CHO cells, 52%; D ≈ 0.5 μm2 s−1) most probably represents ε-COP–GFP incorporated into the coatomer complex, but its mobility is much slower than expected from the size of coatomer. Consistent with this, the addition of BFA to increase the cytosolic pool of coatomer increased the slow fraction on average from 52% to 70% in CHO cells (Fig. 1E). To confirm that the slower component was indeed coatomer, we removed β-COP by RNA interference (RNAi). This coatomer component is required for the assembly of the coatomer complex (Eugster et al., 2000) and, as expected, its removal resulted in a marked reduction of the slow component (Fig. 1F). We therefore conclude that the slower component of ε-COP–GFP corresponds to coatomer. As the slower fraction of ARFGAP1 has the same diffusion constant as the slower component of coatomer and its levels are increased on BFA treatment, we suggest that ARFGAP1 and coatomer might exist as a complex in the cytosol. Further experiments to test coatomer association with ARFGAP1 and other proteins are underway.
A possible explanation for the unexpectedly slow diffusion of coatomer and a portion of ARFGAP1 is that coatomer is involved in coat formation on peripheral ER exit sites (Stephens et al., 2000). To test this, we microinjected cells with a plasmid encoding a GDP-restricted mutant of Sar1 (0.1 mg ml−1; incubation for 6 h), which leads to the disassembly of ER exit sites (Ward et al., 2001). At most, the mobility of coatomer increased about twofold as determined by FCS (data not shown), which is clearly insufficient to explain the slow diffusion of coatomer. A more likely explanation is provided by the fact that the large coatomer complex is predicted to encounter steric hindrance due to membranes and cytoskeletal structures while diffusing through the cytoplasm. For large complexes, obstructed diffusion could easily account for a slow-down of diffusion by a factor of 5–10 (Saxton, 1993).
To complement the FCS measurements, we also performed FRAP using ε-COP–GFP. We bleached a circular spot (area, 47 μm2) through the entire thickness of the cell and fitted the resulting recovery curves with the appropriate formula for a single diffusing species (Saxton, 2001). Fitting with a two-component expression was not successful, as the time resolution of the FRAP measurement (154 ms) was insufficient to resolve the recovery of free ε-COP–GFP (recovery time T ≈ 240 ms, assuming D ≈ 16 μm2 s−1). The diffusion coefficient determined in this way (DCOPI ≈ 1.7 μm2 s−1) was higher than that obtained by FCS, which is in part explained by the contribution of the fast but unresolved pool of free ε-COP–GFP. However, the diffusion constant determined by FRAP was still significantly slower (approximately fivefold) than theoretically expected.
We next used FRAP to investigate the binding kinetics of ARF1, ARFGAP1 and coatomer to Golgi membranes. We bleached the entire pool of the GFP-tagged proteins in the Golgi region, then monitored and fitted the recovery. Whereas ARF1 (Fig. 2A) and ARFGAP1 (Fig. 2C) showed similar recovery curves with a characteristic time constant of T ≈ 10 s, coatomer (Fig. 2E) seemed to recover with a twofold slower rate, in agreement with a previous report on ARF1 and coatomer (Presley et al., 2002). Applying aluminium fluoride to the cells locked coatomer onto Golgi membranes (Fig. 2F), whereas ARFGAP1 showed a 30% increase in T (Fig. 2D). For ARF1, the recovery time changed even more significantly to T ≈ 20 s (Fig. 2B), whereas the addition of fluoride did not have any effect (data not shown). In contrast to previous reports (Presley et al., 2002), this provides in vivo evidence that the entire COPI vesicle machinery is affected by aluminium fluoride.
Figure 2.

Binding kinetics of COPI proteins. Recovery, after bleaching the Golgi pool, of (A,B) ADP ribosylation factor 1 (ARF1) with and without aluminium fluoride, (C,D) ARF GTPase-activating protein 1 (ARFGAP1) with and without aluminium fluoride, and (E,F) ε-COP (ε-coat-protein) with and without aluminium fluoride (black symbols) with best fits (red lines). Whereas in untreated cells the typical recovery times T for ARF1 and ARFGAP1 were quite similar (A, TARF1 ≈ 10 s; C, TARFGAP1 ≈ 9 s), COPI showed a markedly slower recovery (E, TCOPI ≈ 20 s). Applying aluminium fluoride approximately doubled the recovery time for ARF1 (B, T ≈ 20 s), whereas ARFGAP1 showed only a 30% slower recovery (D, T ≈ 13 s), and coatomer was locked onto the membrane (F). WT, wild type.
Because coatomer diffuses significantly more slowly than the main fraction of ARF1 and ARFGAP1, we next investigated to what extent this could affect binding kinetics determined by FRAP. A simple model was constructed for analysing the FRAP experiment. For simplicity, we assumed the cell to have a square shape and then overlaid a grid in the x–y direction with a lattice of 11 × 11 sites, each having a volume of 3 × 3 × 3 μm3 (Fig. 3A). The area of this 'cell' is therefore 1,089 μm2, which is comparable to the area of CHO and HeLa cells. The Golgi apparatus was modelled by 12 adjacent lattice points in the middle of the cell (Fig. 3A, grey areas), consistent with fluorescence microscopy pictures of CHO and HeLa cells in which Golgi sites represent about 10% of the cell area. Neighbouring cytosolic sites were coupled to support a diffusive flux of proteins, whereas the attachment and detachment of proteins to and from the Golgi sites could only occur from neighbouring cytosolic lattice points with rates R and γ, respectively. To account for the height of the cell, we coupled the corresponding sites of a second, identically shaped lattice to the first one to support diffusional flux. Our cell is therefore a box of 11 × 11 × 2 sites. As the Golgi apparatus typically does not fill the entire thickness of the cell, that is, cytosol is present above and below it, we did not specify Golgi sites on the second lattice. The Golgi region therefore consists of 12 Golgi sites and 12 cytosolic sites below them. To be consistent with the FRAP experiments described above, we used γ = 0.05 s−1 in the simulations and fixed the ratio R = 3γ, so that at steady state the Golgi pool of the protein is threefold larger than the cytosolic pool in a corresponding area.
Figure 3.
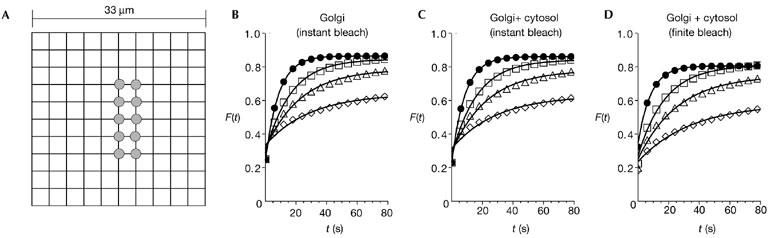
Simulation of diffusion-limited reaction kinetics. (A) Simulation of fluorescence recovery after photobleaching (FRAP) was performed on a model cell consisting of a square lattice of 11 × 11 × 2 sites with 12 Golgi sites embedded in the first layer (marked in grey; see main text for details). (B–D) Resulting recovery curves for various diffusion coefficients (filled circles, D = 15 mm2 s−1; open squares, D = 1.5 μm2 s−1; open triangles, D = 0.5 μm2 s−1; open diamonds, D = 0.1 μm2 s−1), with best fits according to single-exponential kinetics (lines). Bleaching was performed instantaneously on (B) Golgi sites only, (C) the Golgi region and (D) on the Golgi region at a rate of 500 s−1 for 4 s. The recovery curves depend strongly on the diffusion coefficient D and the typical recovery time increases about twofold in all cases when comparing D = 15 mm2 s−1 with D = 1.5 μm2 s−1. For lower values of D, this effect becomes even more marked. t, time.
Using this model, we investigated the following three situations: first, an instantaneous bleaching of only the Golgi sites (Fig. 3B); second, an instantaneous bleaching of the Golgi region (Fig. 3C); and third, bleaching the Golgi region at ω = 500 s−1 for 4 s (Fig. 3D), which was the typical bleaching time used in our FRAP experiments. Qualitatively, the three situations all resulted in similar recovery curves: the recovery was fastest for D = 15 μm2 s−1, with a typical recovery time T ≈ 10 s, consistent with the experimental observations (Fig. 2A,B). These results were not altered significantly when using D = 10 μm2 s−1. For D < 2 μm2 s−1 however, the recovery was significantly slower, an effect which became more pronounced as D decreased. As the rates R and γ were the same in all simulations, this could only occur due to a diffusion-limited recovery. Neither the incorporation of a cytosolic contribution (Fig. 3C) nor the more realistic situation of bleaching for a finite time (Fig. 3D) qualitatively altered this result. Moreover, fitting the curves for D = 15 μm2 s−1 and D = 1.5 μm2 s−1 with single exponential kinetics with typical times T1 and T2 gave a ratio of T2 /T1 ≈ 1.9–2.1 in all three cases, although the rates R and γ had not been altered. These results show how a diffusion-limited recovery curve can result in apparently slower binding kinetics. One might have anticipated that ARFGAP1, if complexed to coatomer, should also show a diffusion-limited recovery. However, the experimental recovery curves for ARFGAP1 only provided some variation in the recovery times from cell to cell (7 s < T < 15 s). This is most readily explained by the excess of ARFGAP1 when expressed as a GFP fusion protein compared with the levels of endogenous coatomer. Unbound ARFGAP1 diffusing more rapidly would mask the more slowly diffusing coatomer–ARFGAP1 complex. Each of the COPI components can also bind to Golgi membranes by themselves, explaining to some extent their fast recovery rates. There are also coatomer-independent processes on Golgi membranes that require the action of ARF1. For example, ARF1 regulates phospholipase D, which catalyses the hydrolysis of phosphatidylcholine (Williger et al., 1999) and recruits PtdIns-4-OH-kinase-β to Golgi membranes (Godi et al., 1999).
In summary, we have presented evidence that ARF1, ARFGAP1 and coatomer have approximately the same kinetics of binding to Golgi membranes when taking into account the observed diffusion-limited behaviour of coatomer. Previously, the apparent discrepancy between ARF1 and coatomer kinetics seen in FRAP experiments was taken as evidence that GTP hydrolysis by ARF1 is not responsible for coatomer dissociation (Presley et al., 2002). Our results do not support this conclusion, and instead suggest that the coat components bind and dissociate in concert. In addition, our data suggest that ARFGAP1 is recruited to membranes alongside ARF1 and coatomer, and is thus likely to have a key function in the regulation of coat dynamics and sorting, for example through a kinetic proofreading scheme (Weiss & Nilsson, 2003).
Methods
Cell culture and microscopy.
Monolayer HeLa or CHO cells were cultured in DMEM and RPMI, respectively, both supplemented with 10% fetal calf serum, 100 units ml−1 penicillin, 100 mg ml−1 streptomycin and 10 mM glutamine (Gibco). The ARF1–GFP and ARFGAP1–GFP plasmids will be described elsewhere. The ε-COP–GFP cDNA fragment (a gift from R. Pepperkok) was inserted into pSG-puro and stably expressed in HeLa cells. The ε-COP–GFP CHO cell line was a gift from J. Presley. The concentrations of the chemicals used and the plasmids injected were: ARF1, 25 μg ml−1; BFA, 5 μg ml−1; aluminium fluoride, 30 mM NaF and 50 μM AlCl3.
Oligonucleotides used for RNAi were derived from a cDNA that encodes human β-COP (GenBank accession number NM_016451). The most inhibitory RNA was against nucleotides 161–181 downstream from the ATG (target sequence: 5′-AACUUCCUGGACUUCUGAUGA-3′). Complementary oligonucleotides (5′-CUUCCUGGACUUCUGAUGAdTdT-3′) and (5′-UCAUCAGAAGUCCAGGAAGdTdT-3′) were synthesized, annealed and purified (Dharmacon). Lyophilized oligonucleotide duplexes were resuspended in water at 20 μM.
FCS measurements were carried out with a ConfoCor2 (Carl Zeiss) using an Apochromat 40×/1.2W objective, a 488-nm laser, a 505–550-nm bandpass and a pinhole width of 1 Airy unit. In all cases, 20 fluorescence time series (F(t)) of 10 s were recorded (time resolution, 50 ns), correlated according to Wohland et al. (2001) and superimposed for fitting. In all cases, multiple cells and different locations (outside the nucleus and the Golgi) were used for FCS. From cell to cell, results were consistent. Reported diffusion coefficients and slow:fast ratios are averages, and the figures shown are representative examples of single cells.
All FRAP experiments were performed with an open pinhole, that is the marked region of interest was bleached throughout the entire thickness of the cell.
Data evaluation and simulation.
FCS curves were fitted with a Levenberg–Marquart algorithm (Press et al., 1993) using the expression for three-dimensional diffusion of two components (Schwille et al., 1997):
 |
1 |
Here, f is the fraction of particles with diffusion coefficient D1 < D2, and τD(1,2) = r02/(4D1,2) are the characteristic times of the autocorrelation decay, which includes the diffusion coefficient and the radius (r0) of the confocal volume. The elongation of the optical volume along the optical axis is described by the stretching factor S. From the times τ(1)D and τD(2), the diffusion coefficients D1 and D2 were extracted by comparison with the calibration using GFP in buffer: that is, DGFP ≈ 87 μm2 s−1 (Wachsmuth et al., 2000) corresponds to τD ≈ 130 μs, f = 1 in equation (1) (Fig. 1A). From this, and knowing the molecular weight of GFP (25 kDa), we were also able to predict the diffusion coefficients of ARF1, ARFGAP1 and coatomer using the Einstein–Stokes relationship for D = kBT/(3πηd). Here, kBT is the thermal energy, η is the viscosity of the fluid and d is the diameter of the protein. Assuming η to be 3–4 times bigger for cytosol than for water (Fig. 1A), and relating the protein's diameter to its molecular weight (m; d3 ∼ m), the predicted diffusion coefficients were DARF1 ≈ 17 μm2 s−1, DARFGAP1 ≈ 15 μm2 s−1 and DCOPI ≈ 8 μm2 s−1.
Recovery curves from FRAP experiments performed to study binding kinetics were fitted with a single exponential kinetics; that is, F(t) = A (1 − exp(−t/T)) + B. Here, B is the fluorescence in the Golgi region obtained in the first scan after bleaching, and A determines the saturation level of the recovery.
Diffusion-limited FRAP was studied using a model as described in the main text. On the cytosolic sites, the three-dimensional diffusion equation was solved with a fourth-order Runge–Kutta algorithm (Press et al., 1993) using reflecting boundary conditions at the edges and the Golgi sites. Diffusion of proteins in the Golgi was considered by solving the diffusion equation on the Golgi sites with reflecting boundary conditions and a diffusion coefficient D = 1 μm2 s−1, which is typical on membranes (Weiss et al., 2003). During bleaching, the diffusion and binding reactions continued.
Acknowledgments
We thank J. Presley and J. Lippincott-Schwartz for providing us with ε-COP–GFP, J. Young for critically reading the manuscript, and R. Pepperkok for helpful comments and advice and for the use of the Advanced Light Microscopy Facility at EMBL. M.W. was supported by an EMBO long-term fellowship.
References
- Elson E.L. & Qian H. ( 1989) Interpretation of fluorescence correlation spectroscopy and photobleaching recovery in terms of molecular interactions. Methods Cell Biol., 30, 307–332. [DOI] [PubMed] [Google Scholar]
- Eugster A., Frigerio G., Dale M. & Duden R. ( 2000) COPI domains required for coatomer integrity, and novel interactions with ARF and ARF–GAP. EMBO J., 19, 3905–3917. [DOI] [PMC free article] [PubMed] [Google Scholar]
- Godi A., Pertile P., Meyers R., Marra P., Di Tullio G., Iurisci C., Luini A., Corda D. & De Matteis M.A. ( 1999) ARF mediates recruitment of PtdIns-4-OH kinase-β and stimulates synthesis of PtdIns(4,5)P2 on the Golgi complex. Nature Cell Biol., 1, 280–287. [DOI] [PubMed] [Google Scholar]
- Helms J.B. & Rothman J.E. ( 1992) Inhibition by brefeldin A of a Golgi membrane enzyme that catalyses exchange of guanine nucleotide bound to ARF. Nature, 360, 352–354. [DOI] [PubMed] [Google Scholar]
- Lanoix J., Ouwendijk J., Lin C.C., Stark A., Love H.D., Ostermann J. & Nilsson T. ( 1999) GTP hydrolysis by ARF1 mediates sorting and concentration of Golgi resident enzymes into functional COP I vesicles. EMBO J., 18, 4935–4948. [DOI] [PMC free article] [PubMed] [Google Scholar]
- Lanoix J., Ouwendijk J., Stark A., Szafer E., Cassel D., Dejgaard K., Weiss M. & Nilsson T. ( 2001) Sorting of Golgi resident proteins into different subpopulations of COPI vesicles: a role for ArfGAP1. J. Cell Biol., 155, 1199–1212. [DOI] [PMC free article] [PubMed] [Google Scholar]
- Malsam J., Gommel D., Wieland F.T. & Nickel W. ( 1999) A role for ADP ribosylation factor in the control of cargo uptake during COPI-coated vesicle biogenesis. FEBS Lett., 462, 267–272. [DOI] [PubMed] [Google Scholar]
- Ostermann J., Orci L., Tani K., Amherdt M., Ravazzola M., Elazar Z. & Rothman J.E. ( 1993) Stepwise assembly of functionally active transport vesicles. Cell, 75, 1015–1025. [DOI] [PubMed] [Google Scholar]
- Pepperkok R., Whitney J.A., Gomez M. & Kreis T.E. ( 2000) COPI vesicles accumulating in the presence of a GTP restricted arf1 mutant are depleted of anterograde and retrograde cargo. J. Cell Sci., 113, 135–144. [DOI] [PubMed] [Google Scholar]
- Presley J.F., Ward T.H., Pfeifer A.C., Siggia E.D., Phair R.D. & Lippincott-Schwartz J. ( 2002) Dissection of COPI and Arf1 dynamics in vivo and role in Golgi membrane transport. Nature, 417, 187–193. [DOI] [PubMed] [Google Scholar]
- Press W.H., Teukolsky S.A. & Vetterling W.T. ( 1993) Numerical Recipes in C. Cambridge Univ. Press, Cambridge, UK. [Google Scholar]
- Saxton M.J. ( 1993) Lateral diffusion in archipelago. Biophys. J., 64, 1053–1062. [DOI] [PMC free article] [PubMed] [Google Scholar]
- Saxton M.J. ( 2001) Anomalous subdiffusion in fluorescence photobleaching recovery: a Monte Carlo study. Biophys. J., 81, 2226–2240. [DOI] [PMC free article] [PubMed] [Google Scholar]
- Schwille P., Bieschke J. & Oehlenschläger F. ( 1997) Kinetic investigations by fluorescence correlation spectroscopy: the analytical and diagnostic potential of diffusion studies. Biophys. Chem., 66, 211–228. [DOI] [PubMed] [Google Scholar]
- Spang A., Matsuoka K., Hamamoto S., Schekman R. & Orci L. ( 1998) Coatomer, Arf1p, and nucleotide are required to bud coat protein complex I-coated vesicles from large synthetic liposomes. Proc. Natl Acad. Sci. USA, 95, 11199–11204. [DOI] [PMC free article] [PubMed] [Google Scholar]
- Stephens D.J., Lin-Marq N., Pagano A., Pepperkok R. & Paccaud J.P. ( 2000) COPI-coated ER-to-Golgi transport complexes segregate from COPII in close proximity to ER exit sites. J. Cell Sci., 113, 2177–2185. [DOI] [PubMed] [Google Scholar]
- Storrie B. & Nilsson T. ( 2002) The Golgi apparatus: balancing new with old. Traffic, 3, 521–529. [DOI] [PubMed] [Google Scholar]
- Wachsmuth M., Waldeck W. & Langowski J. ( 2000) Anomalous diffusion of fluorescent probes inside living cell nuclei investigated by spatially resolved fluorescence correlation spectroscopy. J. Mol. Biol., 298, 677–689. [DOI] [PubMed] [Google Scholar]
- Ward T.H., Polishchuk R.S., Caplan S., Hirschberg K. & Lippincott-Schwartz J. ( 2001) Maintenance of Golgi structure and function depends on the integrity of ER export. J. Cell Biol., 155, 557–570. [DOI] [PMC free article] [PubMed] [Google Scholar]
- Weiss M. & Nilsson T. ( 2003) A kinetic proof-reading mechanism for protein sorting. Traffic, 4, 65–73. [DOI] [PubMed] [Google Scholar]
- Weiss M., Hashimoto H. & Nilsson T. ( 2003) Membrane protein diffusion in living cells as seen by fluorescence correlation spectroscopy. Biophys. J., 84, 4043–4052. [DOI] [PMC free article] [PubMed] [Google Scholar]
- Williger B.T., Ostermann J. & Exton J.H. ( 1999) Arfaptin 1, an ARF-binding protein, inhibits phospholipase D and endoplasmic reticulum/Golgi protein transport. FEBS Lett., 443, 197–200. [DOI] [PubMed] [Google Scholar]
- Wohland T., Rigler R. & Vogel H. ( 2001) The standard deviation in fluorescence correlation spectroscopy. Biophys. J., 80, 2987–2999. [DOI] [PMC free article] [PubMed] [Google Scholar]