Abstract
We evaluated the in vitro activity of the new echinocandin antifungal micafungin against Candida spp. using microdilution and time-kill methods. Additionally, we examined the postantifungal effect (PAFE) of micafungin. Finally, we evaluated the effect of the addition of serum and plasma on the MIC of micafungin. Four Candida albicans isolates and two isolates of each Candida glabrata, Candida krusei, and Candida tropicalis were selected for testing. The MICs of micafungin were determined in RPMI 1640 medium buffered with morpholinepropanesulfonic acid alone and with the addition of 10, 20, and 50% human serum and plasma. MICs were determined by using two endpoints: a prominent reduction in growth (the MIC at which 80% of isolates are inhibited [MIC80]) and complete visual inhibition of growth (MIC100). The minimum fungicidal concentration (MFC) of micafungin for each isolate was also determined. Time-kill curves were determined for each isolate in RPMI 1640 medium with micafungin at concentrations ranging from 0.125 to 16 times the MIC80 to assess the correlation between MIC80 and fungicidal activity. PAFE studies were conducted with each isolate by using concentrations ranging between 0.25 and 4 times the MIC80. The MIC80s for the test isolates ranged from 0.0039 to 0.25 μg/ml. Overall, the addition of serum or plasma increased the MIC 6 to 7 doubling dilutions for C. albicans and 3 to 4 doubling dilutions for C. krusei and C. tropicalis. Micafungin time-kill studies demonstrated fungicidal activity at concentrations ranging from 4 to 16 times the MIC80. Micafungin is very potent agent against a variety of Candida spp., producing fungicidal activity against 7 of 10 isolates tested. A PAFE was observed against all isolates. The PAFE was influenced by the drug concentration, with the highest concentration resulting in the longest observed PAFE in each case. The highest concentration tested, four times the MIC, resulted in a PAFE of more than 9.8 h for 5 of 10 isolates tested (range, 0.9 to ≥20.1 h).
Micafungin is an investigational antifungal agent that was first isolated from the culture broth of Coleophoma empedri. It is a novel water-soluble lipopeptide derived by semisynthetic modification of FR901379, a naturally occurring cyclic hexapeptide with a fatty acyl side chain, and is similar in structure to the echinocandins and pneumocandins. Micafungin has inhibitory activity against β-1,3-glucan synthase (T. Iwamoto, N. Sakamoto, M. Yamashita, M. Ezaki, S. Hashimoto, T. Furuta, M. Okuhara, and M. Kohsaka, Progam Abstr. 33rd Intersci. Conf. Antimicrob. Agents Chemother., abstr. 371, 1993) and has been shown to exhibit potent in vitro activity against Candida and Aspergillus species (K. Maki, Y. Morishita, Y. Iguchi, E. Watabe, K. Otomo, N. Teratani, Y. Watanabe, F. Ikeda, S. Tawara, T. Goto, M. Tomishima, H. Ohki, A. Yamada, K. Kawabata, H. Takassugi, H. Tanaka, K. Sakane, F. Matsumoto, and S. Kuwahara, Abstr. 38th Intersci. Conf. Antimicrob. Agents Chemother., abstr. F141, 1998). We sought to characterize the in vitro activity of micafungin using microdilution methods and the pharmacodynamic characteristics using time-kill methods. Since micafungin is greater than 90% protein bound, we also sought to determine the impact of protein binding on the in vitro activity of the drug by evaluating the influence of the addition of human serum on the MIC.
MATERIALS AND METHODS
Antifungal agents.
Micafungin (Fujisawa Healthcare Inc., Deerfield, Ill.) was used for microdilution and time-kill studies. Micafungin solution for injection was used to prepare stock solutions in RPMI 1640 medium buffered to a pH of 7.0 with morpholinepropanesulfonic acid (MOPS). Stock solutions were stored at −80°C until use.
Test isolates.
Four isolates of Candida albicans were used, including one American Type Culture Collection (ATCC) strain, strain ATCC 90028, and three clinical isolates, isolates 142-5609A, 2733A, and OY-31.5. Additionally, two isolates of each Candida glabrata (strains 350 and 582), Candida krusei (strains 6258 and 37.5696A), and Candida tropicalis (strains 2697 and 3829) were selected for testing. Fungal isolates were obtained from the organism collection of the Special Microbiology Laboratory, Department of Pathology, University of Iowa College of Medicine.
Antifungal susceptibility testing.
The MIC of micafungin for each test isolate was determined by adapting approved methods of the National Committee for Clinical Laboratory Standards (M27-A) for micafungin (5). MICs were determined in RPMI 1640 medium buffered to a pH of 7.0 with MOPS. The starting inoculum was approximately 0.5 × 10³ to 2.5 × 10³ CFU/ml. Microtiter trays were incubated at 35°C in a moist, dark chamber, and the MICs were recorded after 24 and 48 h of incubation. Endpoints were defined as the lowest concentration of drug resulting in prominent inhibition (the MIC at which 80% of isolates are inhibited [MIC80]) and total inhibition (MIC100) of visual growth compared to the growth in the control wells containing no antifungal. MICs were also determined in the presence of 10, 20, and 50% human serum and plasma, with active and inactivated proteins, to determine the effect of protein binding. Plasma was obtained from the University of Iowa Hospitals and Clinics Blood Bank. Serum was prepared from human plasma by adding 10,000 U of thrombin to each unit of plasma. The plasma was then stirred at room temperature for approximately 4 h, after which it was stirred at 4°C for approximately 12 h. Plasma was filtered twice with a sterilizing system (pore size, 0.22 μm; Corning, Corning, N.Y.). After all filtering was complete, 40 ml was placed in a 50-ml conical tube and frozen at −20°C. For studies with inactivated proteins, human plasma and serum were heated to 56°C for 45 min. All MICs were determined in triplicate.
The minimum fungicidal concentration (MFC) of micafungin for each isolate was also determined. After the MIC was read at 48 h, a 1-μl sample was withdrawn from each well of the microtiter tray with a 96-pin replicator (Boekel, Feasterville, Pa.) and plated onto a 150-mm RPMI 1640 agar plate buffered with MOPS (Remel, Lenexa, Kans.). Inoculated plates were incubated at 35°C, and MFCs were recorded after 48 h. The MFC was defined as the lowest concentration of micafungin that resulted in total inhibition of visible growth.
Time-kill curve procedures.
Time-kill curve procedures were conducted as described previously (4). Fungi were obtained from stored samples and subcultured twice on potato dextrose agar (PDA) plates (Remel) prior to testing. Fungal suspensions were prepared in sterile water by touching three to five colonies from a 24- to 48-h-old culture plate and adjusting the resulting suspension to a 0.5 McFarland standard (approximately 1 × 10⁶ to 5 × 10⁶ CFU/ml) by spectrophotometric methods. One milliliter of fungal suspension was added to 9 ml of RPMI 1640 medium buffered with MOPS to pH 7.0 with or without drug, providing the starting inoculum of approximately 1 × 10⁵ to 5 × 10⁵ CFU/ml. The range of micafungin concentrations tested was 0.25 to 16 times the MIC80. The culture vials were incubated with agitation at 35°C. At predetermined time points (0, 2, 4, 8, 12, and 24 h following the addition of antifungal), a 0.1-ml sample was removed from each culture vial and serially diluted with sterile water, and a 30-μl aliquot was plated on PDA (Remel). Colony counts were determined after incubation of the plates at 35°C for 24 to 48 h. When colony counts were suspected to be less than 1,000 CFU/ml, 30-μl samples were removed and plated without dilution. The limit of quantification by these methods is 100 CFU/ml (3). Antifungal carryover was evaluated over the range of concentrations used in this study, as described previously (3). All time-kill curve experiments were conducted in duplicate.
PAFE procedures.
The methods used to determine the postantifungal effect (PAFE) for all of the test isolates were similar to those described previously (2). One milliliter of fungal suspension was added to vials containing culture medium alone or with drug at concentrations ranging from 0.25 to 4 times the MIC80. Following an incubation period of 1 h the drug was removed by a process of three cycles of repeated centrifugation at 1,400 × g for 10 min each. After the first two centrifugation periods the fungal pellet was resuspended in warm normal saline. After the final centrifugation, the fungal pellet was resuspended in 9 ml of warm RPMI 1640 medium. The resuspended samples were then incubated at 35°C with agitation; and colony counts were obtained at 0, 2, 4, 5, 6, 7, 8, and 22 h after the final wash. A 100-μl sample was obtained from the culture vial and diluted with sterile water, and 30 μl was plated on PDA for counting of the colonies. When colony counts were suspected to be less than 1,000 CFU/ml, 30-μl samples were removed and plated without dilution. All PAFE experiments were conducted in duplicate.
Analysis.
Mean colony count data (log10 CFU per milliliter) were plotted as a function of time for each isolate at each concentration of antifungal tested for both time-kill and PAFE studies. Time-kill data were characterized as fungicidal or fungistatic. Fungicidal activity was defined as a ≥3 log10 (99.9%) reduction in CFU from the starting inoculum, and fungistatic activity was defined as a <99.9% reduction in growth from the starting inoculum. The time-kill data were fit by using a single three-parameter exponential decay model (y = y0 + ae−bx) by using SigmaPlot 2000 for Windows (version 6.0; SPSS Inc.) to determine the time (in hours) required to reach 50, 90, and 99.9% reductions in growth from the starting inoculum as a measure of the rate of activity. The net change (log10 CFU per milliliter) in fungal density at each time point was determined for each isolate at each multiple of the MIC80 and plotted. This plot was fitted to a three-parameter sigmoidal Hill model [y = (axb)/(cb + xb); SigmaPlot 2000, version 6.0; SPSS Inc.] to determine the concentrations producing 50% of the maximal effect (EC50), 90% of the maximal effect (EC90), and the maximal effect (Emax) to quantify the extent of activity. The PAFE data were also fit by using the three-parameter sigmoidal Hill model in order to determine the time (in hours) for each isolate to grow 1 log10. PAFE was calculated by using the equation T − C, where T and C are the times required for the CFU counts in the test and control cultures, respectively, to increase 1 log10 above the count observed immediately after the drug removal process is completed.
RESULTS
Antifungal susceptibility results.
The results of susceptibility tests with micafungin (i.e., MIC80, MIC100, and MFC) are presented in Table 1. For a given isolate, the median MIC100s were noted to be 1 to 3 doubling dilutions greater than the corresponding MIC80. The greatest difference, a difference of 3 log2, was noted for both C. albicans 2733A and OY-31.5. For each isolate the MFC was consistently greater than or equal to the MIC80. In contrast, all MFCs were less than the corresponding MIC100s.
TABLE 1.
Results for micafungin susceptibility testsa
| Microorganism | MIC (μg/ml) |
MFC (μg/ml) (n = 6) | |
|---|---|---|---|
| 80% (n = 6) | 100% (n = 6) | ||
| C. albicans | |||
| 90028 | 0.0039 | 0.0625 | 0.0312 |
| 142-5609A | 0.0039 | 0.0625 | 0.0039 |
| 2733A | 0.0156 | 0.125 | 0.0312 |
| OY-31.5 | 0.0039 | 0.0312 | 0.0039 |
| C. krusei | |||
| 6258 | 0.25 | 0.5 | 0.25 |
| 37.5696A | 0.25 | 0.5 | 0.25 |
| C. tropicalis | |||
| 2697 | 0.125 | 0.5 | 0.25 |
| 3829 | 0.0156 | 0.5 | 0.25 |
| C. glabrata | |||
| 350 | 0.0039 | 0.0625 | 0.0156 |
| 582 | 0.0039 | 0.0156 | 0.0039 |
The values are medians.
The results of susceptibility tests (both MICs and MFCs) with the addition of serum, inactivated serum, plasma, and inactivated plasma are presented in Tables 2 and 3. For all isolates tested, the addition of serum, inactivated serum, plasma, or inactivated plasma increased both the MIC80s and the MFCs. For C. albicans the addition of serum or plasma increased the MIC80 by 4 to 8 log2. Likewise, the MFCs were increased 2 to 8 log2 for C. albicans isolates. One to 4 log2 increases in both the MICs and the MFCs were detected for C. krusei and C. tropicalis isolates with the addition of serum or plasma. Additionally, as the concentration of serum or plasma increased, the MICs and MFCs stayed the same or increased by 1 to 2 doubling dilutions for all isolates.
TABLE 2.
Effects of serum and plasma at different concentrations on MIC80sa
| Microorganism | MIC80 (μg/ml) |
||||||||||||
|---|---|---|---|---|---|---|---|---|---|---|---|---|---|
| RPMI 1640 medium | Serum |
Inactivated serum |
Plasma |
Inactivated plasma |
|||||||||
| 10% | 20% | 50% | 10% | 20% | 50% | 10% | 20% | 50% | 10% | 20% | 50% | ||
| C. albicans | |||||||||||||
| 90028 | 0.0039 | 0.125 | 0.125 | 0.50 | 0.25 | 0.25 | 0.50 | 0.25 | 0.25 | 0.50 | 0.25 | 0.25 | 0.50 |
| 142.5609A | 0.0039 | 0.25 | 0.25 | 1.00 | 0.25 | 0.25 | 1.00 | 0.50 | 0.50 | 1.00 | 0.50 | 0.50 | 1.00 |
| 2733A | 0.0156 | 0.25 | 0.50 | 0.50 | 0.25 | 0.50 | 1.00 | 0.50 | 0.50 | 0.50 | 0.50 | 0.50 | 1.00 |
| OY-31.5 | 0.0039 | 0.125 | 0.125 | 0.50 | 0.25 | 0.25 | 0.50 | 0.25 | 0.25 | 0.50 | 0.25 | 0.25 | 0.50 |
| C. krusei | |||||||||||||
| 6258 | 0.25 | 1.00 | 2.00 | 4.00 | 1.00 | 1.00 | 4.00 | 1.00 | 2.00 | 4.00 | 2.00 | 2.00 | 4.00 |
| 37.5696A | 0.25 | 1.00 | 2.00 | 4.00 | 1.00 | 2.00 | 4.00 | 2.00 | 2.00 | 4.00 | 2.00 | 4.00 | 4.00 |
| C. tropicalis | |||||||||||||
| 2697 | 0.125 | 0.50 | 0.50 | 1.00 | 0.50 | 0.50 | 1.00 | 1.00 | 1.00 | 1.00 | 0.50 | 1.00 | 1.00 |
| 3829 | 0.0156 | 0.25 | 0.50 | NA | 0.50 | 0.50 | 1.00 | 0.50 | 0.50 | 1.00 | 0.50 | 1.00 | 1.00 |
The MIC80s were determined by the microdilution method, with the median MIC80s presented. NA, not available.
TABLE 3.
Effects of serum and plasma at different concentrations on MFCsa
| Microorganism | MFC (μg/ml) |
||||||||||||
|---|---|---|---|---|---|---|---|---|---|---|---|---|---|
| RPMI 1640 medium | Serum |
Inactivated serum |
Plasma |
Inactivated plasma |
|||||||||
| 10% | 20% | 50% | 10% | 20% | 50% | 10% | 20% | 50% | 10% | 20% | 50% | ||
| C. albicans | |||||||||||||
| 90028 | 0.0312 | 0.125 | 0.50 | 0.50 | 0.25 | 0.25 | 1.00 | 0.25 | 0.25 | 0.50 | 0.50 | 0.25 | 0.50 |
| 142.5609A | 0.0039 | 0.50 | 0.25 | 1.00 | 0.25 | 0.25 | 1.00 | 0.50 | 0.50 | 1.00 | 0.50 | 0.50 | 1.00 |
| 2733A | 0.0312 | 0.50 | 0.25 | 1.00 | 0.50 | 0.50 | 1.00 | 0.50 | 0.50 | 1.00 | 0.50 | 0.50 | 1.00 |
| OY-31.5 | 0.0039 | 0.125 | 0.125 | 0.50 | 0.25 | 0.25 | 0.50 | 0.25 | 0.25 | 0.50 | 0.25 | 0.50 | 0.50 |
| C. krusei | |||||||||||||
| 6258 | 0.25 | 2.00 | 1.00 | 4.00 | 1.00 | 1.00 | 4.00 | 1.00 | 2.00 | 4.00 | 2.00 | 4.00 | 4.00 |
| 37.5696A | 0.25 | 2.00 | 1.00 | 4.00 | 1.00 | 2.00 | 4.00 | 2.00 | 2.00 | 4.00 | 4.00 | 4.00 | 4.00 |
| C. tropicalis | |||||||||||||
| 2697 | 0.25 | 0.50 | 0.50 | 2.00 | 0.50 | 1.00 | 1.00 | 2.00 | 1.00 | 2.00 | 1.00 | 1.00 | 2.00 |
| 3829 | 0.25 | 1.00 | 0.50 | 1.00 | 0.50 | 0.50 | 1.00 | 0.50 | 1.00 | 4.00 | 0.50 | 2.00 | 2.00 |
The values are medians.
Antifungal carryover.
Antifungal carryover was not observed at any of the micafungin concentrations for any of the isolates tested. The counts for all samples were within 25% of the mean control colony count.
Killing curve studies.
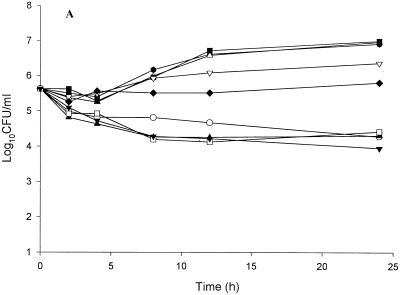
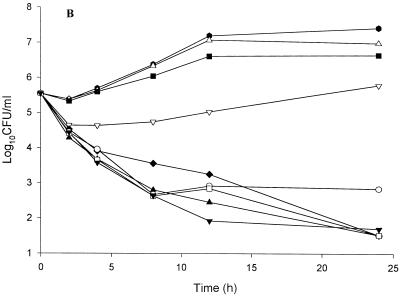
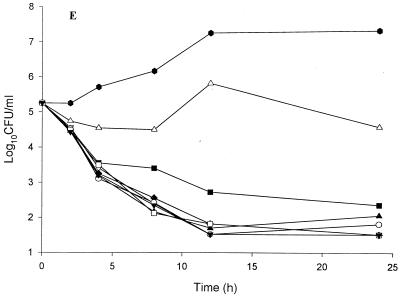
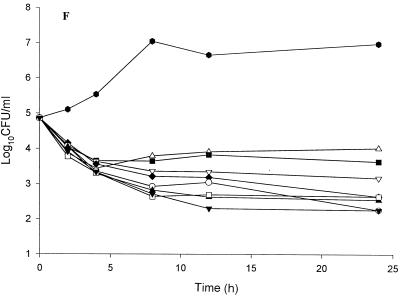
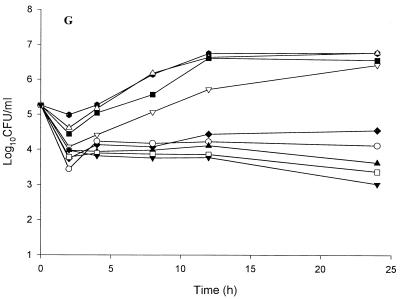
Plots of the activity of micafungin as the log10 CFU per milliliter versus time are presented in Fig. 1. Table 4 shows the times for each isolate to reach 50, 90, and 99.9% reductions in the numbers of CFU from the starting inoculum with each multiple of the MIC80. Against C. albicans 142-5609A, micafungin exhibited fungicidal activity at both 8 and 16 times the MIC80. Similarly, micafungin demonstrated fungicidal activity against C. albicans 2733A and OY-31.5 at concentrations four or more times the MIC80. However, against C. albicans 90028, micafungin produced only fungistatic activity. The time to 50, 90, and 99.9% reductions in the numbers of CFU per milliliter demonstrated that micafungin has similar activities against C. albicans OY-31.5 and 2733A. Both isolates reached the funigicdal endpoint after 7.2 to 9.5 h at concentrations four or more times the MIC80. C. albicans 142-6867 was slow to reach the fungicidal endpoint (∼20 h), and C. albicans 90028 never reached this endpoint within the 24-h study period.
FIG. 1.
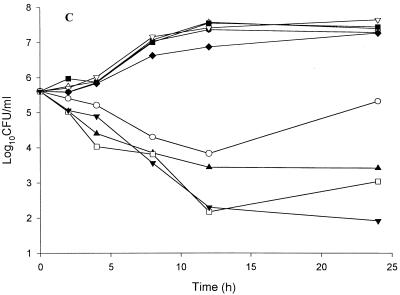
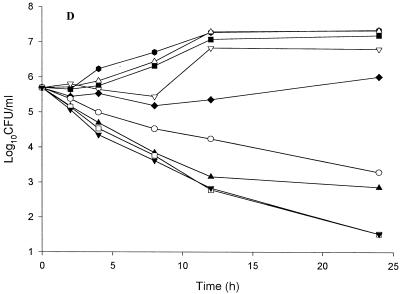
Representative time-kill curve plots for C. albicans 90028 (A), C. albicans 2733A (B), C. glabrata 350 (C), C. glabrata 582 (D), C. krusei 6258 (E), C. tropicalis 2697 (F), and C. tropicalis 3829 (G) at the following concentrations: 0.125 the MIC80 (▵), 0.25 the MIC80 (▪), 0.5 the MIC80 (▿), the MIC80 (♦), 2 times the MIC80 (○), 4 times the MIC80 (▴), 8 times the MIC80 (□), and 16 times the MIC80 (▾). , control.
TABLE 4.
Times to achieve 50, 90, and 99.9% reductions in growth from starting inoculum
| Microorganism and growth reduction | Median time (h) at the following multiple of the MICa: |
||||||
|---|---|---|---|---|---|---|---|
| 0.25 | 0.5 | 1 | 2 | 4 | 8 | 16 | |
| C. albicans 90028 | |||||||
| 50% | NR | NR | NR | 0.98 | 0.61 | 0.87 | 1.0 |
| 90% | NR | NR | NR | 8.0 | 3.3 | 4.4 | 4.7 |
| 99.9% | NR | NR | NR | NR | NR | NR | NR |
| C. albicans 142-6867 | |||||||
| 50% | NR | NR | NR | NA | 1.3 | 1.1 | 1.3 |
| 90% | NR | NR | NR | NR | 6.3 | 4.5 | 4.5 |
| 99.9% | NR | NR | NR | NR | >24 | 21.5 | 18.4 |
| C. albicans OY31.5 | |||||||
| 50% | NR | NR | NR | NA | 0.41 | 0.48 | 0.53 |
| 90% | NR | NR | NR | NA | 1.6 | 1.6 | 1.7 |
| 99.9% | NR | NR | NR | NR | 9.5 | 8.6 | 7.2 |
| C. albicans 2733A | |||||||
| 50% | NR | NR | 0.39 | 0.6 | 0.5 | 0.55 | 0.65 |
| 90% | NR | NR | 3.1 | 2.0 | 1.9 | 1.9 | 2.0 |
| 99.9% | NR | NR | 14.6 | 9.4 | 9.0 | 9.1 | 8.6 |
| C. glabrata 582 | |||||||
| 50% | NR | NR | NR | 1.7 | 1.1 | 1.0 | 0.86 |
| 90% | NR | NR | NR | 6.9 | 3.5 | 3.5 | 3.2 |
| 99.9% | NR | NR | NR | NR | NR | 12.9 | 12.9 |
| C. glabrata 350 | |||||||
| 50% | NR | NR | NR | NR | 0.89 | 0.82 | 1.3 |
| 90% | NR | NR | NR | NR | 3.2 | 2.5 | 3.4 |
| 99.9% | NR | NR | NR | NR | >24 | >24 | 13.4 |
| C. krusei 6258 | |||||||
| 50% | 0.62 | 0.74 | 0.64 | 0.64 | 0.61 | 0.70 | 0.63 |
| 90% | 2.5 | 2.0 | 2.0 | 1.8 | 1.7 | 2.0 | 1.8 |
| 99.9% | NR | 8.7 | 9.3 | 8.4 | 8.6 | 8.7 | 8.1 |
| C. krusei 37.5696A | |||||||
| 50% | 0.27 | 0.48 | 0.52 | 0.50 | 0.49 | 0.43 | 0.43 |
| 90% | 2.4 | 1.8 | 1.3 | 1.4 | 1.3 | 1.6 | 1.3 |
| 99.9% | 12.5 | 10.7 | 5.1 | 5.9 | 5.1 | 7.9 | 5.9 |
| C. tropicalis 2697 | |||||||
| 50% | 0.44 | 0.62 | 0.69 | 0.59 | 0.59 | 0.45 | 0.55 |
| 90% | 2.7 | 2.9 | 3.2 | 2.7 | 2.2 | 1.8 | 2.2 |
| 99.9% | NR | NR | NR | NR | NR | NR | NR |
| C. tropicalis 3829 | |||||||
| 50% | NR | NR | NA | NA | 0.17 | 0.13 | NA |
| 90% | NR | NR | NR | NA | 0.9 | 0.62 | NA |
| 99.9% | NR | NR | NR | NR | NR | NR | NR |
NR, not reached; NA, not available.
Micafungin at 16 times the MIC80 demonstrated fungicidal activity against both strains of C. glabrata (strains 350 and 582). In addition, at eight times the MIC80 it showed fungicidal activity against strain 582. C. glabrata 350 reached the fungicidal endpoint after 13.4 h, and C. glabrata 582 reached the fungicidal endpoint at 12.9 h. Micafungin also showed fungicidal activity when it was tested with C. krusei. Micafungin at 0.25, 0.5, 1, 2, 4, 8, and 16 times MIC80 produced fungicidal activity against C. krusei 37.5696A. Similarly, micafungin showed fungicidal activity against C. krusei 6258 beginning at 0.5 the MIC80. The times required to reach 90% reductions in the number of CFU per milliliter ranged between 1.3 and 2.5 h for both C. kruesi isolates. The fungicidal endpoint was obtained at between 5.1 and 12.5 h for both C. krusei isolates. In contrast, all concentrations of micafungin tested demonstrated fungistatic activities against C. tropicalis strains 2697 and 3829.
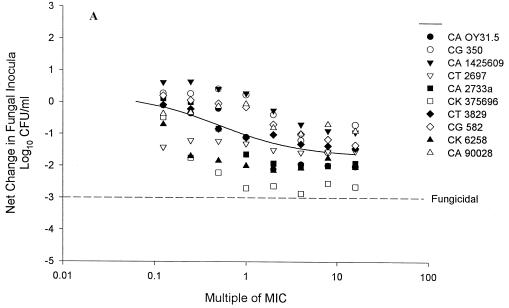
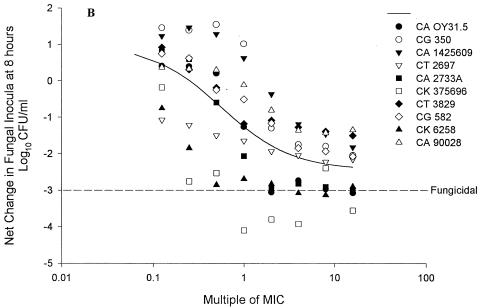
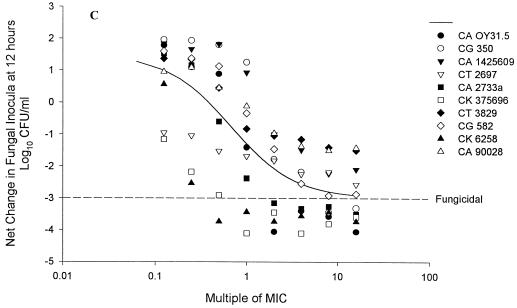
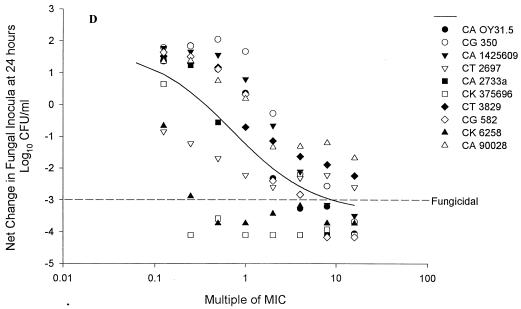
The net change in fungal density was plotted as a function of the concentration of micafungin tested (Fig. 2). The EC50, EC90, and Emax data obtained from these plots are summarized in Table 5. The concentration that produced 90% of the Emax (EC90) was approximately four times the MIC at each time point up to 12 h. This value increased to seven times the MIC at 24 h. Both EC50 and EC90 were constant up to 12 h, with some increases in the values at the 24-h time point. For the composite consisting of all isolates, the maximal activity observed at 24 h exceeded the maximal activity observed at earlier time points. These results show that micafungin slowly produces fungicidal activity against the majority of isolates.
FIG. 2.
Composite concentration-response curves for all test isolates following exposure for 4 h (A), 8 h (B), 12 h (C), and 24 h (D). CA, C. albicans; CG, C. glabrata; CT, C. tropicalis; CK, C. krusei.
TABLE 5.
Composite Emax model parameter
| Time (h) | Multiple of MIC |
Emax (maximal reduction in log10 CFU/ml) | |
|---|---|---|---|
| EC50 | EC90 | ||
| 4 | 0.50 | 3.7 | −0.85 |
| 8 | 0.50 | 4.9 | −1.9 |
| 12 | 0.57 | 3.9 | −4.5 |
| 24 | 0.72 | 6.9 | −5.1 |
PAFE studies.
Micafungin produced a measurable PAFE against all of the Candida isolates tested. Table 6 shows the PAFE for each isolate at each antifungal concentration. The PAFE was influenced by concentration, with the highest concentration resulting in the longest observed PAFE in each case. At 0.25 the MIC the PAFE ranged from −0.40 to 4.1 h. The PAFEs were negative for three of the four C. albicans isolates and ranged from −0.40 to −0.09. The PAFE was 0.49 h for the fourth isolate. With micafungin at 0.25 the MIC, the PAFEs for the C. tropicalis isolates were −0.02 and 0.22 h, respectively. The PAFEs for the C. glabrata isolates ranged from 0.09 to 0.19 h. At 0.25 the MIC the PAFEs for the C. krusei isolates were the longest of those achieved in the study, ranging between 2.4 and 4.1 h.
TABLE 6.
PAFE results
| Microorganism | Median PAFE (h) at the following multiple of the MIC: |
||
|---|---|---|---|
| 0.25 | 1.0 | 4.0 | |
| C. albicans | |||
| 90028 | −0.09 | −0.30 | 0.87 |
| 142-5609A | −0.40 | −0.27 | 1.6 |
| 2733A | 0.49 | ≥3.0 | ≥16.6 |
| OY-31.5 | −0.13 | 4.7 | ≥9.8 |
| C. krusei | |||
| 6258 | 4.1 | ≥4.5 | ≥19.5 |
| 37.5696A | 2.4 | ≥20.1 | ≥20.1 |
| C. tropicalis | |||
| 2697 | −0.02 | 5.0 | ≥11.6 |
| 3829 | 0.22 | 0.40 | 2.6 |
| C. glabrata | |||
| 350 | 0.19 | 0.12 | 3.4 |
| 582 | 0.09 | 0.45 | 2.6 |
At the MIC80 the PAFE was measurably longer than that found at 0.25 the MIC for 8 of the 10 isolates tested; however, the PAFEs were negative for 2 of the C. albicans isolates. The PAFEs were ≥3.0 and 4.7 h for the other two isolates. At the MIC80 the longest PAFE was again achieved for the C. kruesi isolates, ranging from ≥4.5 to ≥20.1 h. The PAFEs for C. glabrata and C. tropicalis isolates ranged from 0.12 to 5 h at the MIC80.
The highest concentration tested, four times the MIC80, resulted in a PAFE of more than 9.8 h for 5 of 10 isolates tested. The longest PAFEs (≥19.5 and ≥20.1 h) were achieved for the C. kruesi isolates. The PAFEs for all other isolates ranged from 0.87 to 3.4 h.
DISCUSSION
In this study we sought to characterize the activity of micafungin, an echinocandin antifungal by three methods, the microdilution, time-kill, and PAFE methods. In describing the activity by microdilution we evaluated two endpoints: a substantial reduction in fungal growth (MIC80) or complete visual inhibition of growth (MIC100). By comparing these values with the MFC, we concluded that the MIC80 consistently represented the in vitro activity of micafungin when activity was tested in RPMI 1640 medium. The MIC100 was greater than the MFC for every isolate tested, suggesting that this endpoint underestimates the activity of micafungin. In contrast, the MIC80 was equal to or 1 doubling dilution less than the MFC for 8 of the 10 isolates tested. By definition, the MIC should be less than or equal to the MFC and not be greater than the MFC. It is likely that some of the wells of the microtiter tray between the MIC80 and MIC100 do not contain living fungal cells but, rather, cellular debris from lysed cells. This cellular debris may result from the relatively slow killing produced by the echinocandins in RPMI 1640 medium and the relatively large yeast cells. We also note that the difference between the MIC80 and the MIC100 is greater for C. albicans than for other species such as C. krusei or C. tropicalis; this may be due to the growth characteristics of the organism. For example, C. albicans grows in large colonies and grows relatively rapidly compared to the colony sizes and growth rates of the other organisms, resulting in more cellular debris and consequent higher MIC100s. The endpoint of 80% inhibition has been suggested for two other echinocandins, caspofungin and anidulafungin, when they are tested in RPMI 1640 medium (1, 5; M. E. Klepser, E. J. Ernst, M. E. Ernst, and M. A. Pfaller, Abstr. 37th Intersci. Conf. Antimicrob. Agents Chemother., abstr. F71, 1997). Using electron microscopy to evaluate the 80 and 100% inhibitory endpoints with caspofungin, we found cell structural abnormalities which correlated with inhibition of cellular growth at the MIC80 compared with the growth of the control (1).
The in vitro antifungal potency of micafungin was appreciably decreased by the addition of human serum or plasma. The reduction in activity is likely due to the high level of protein binding (>90%) reported for micafungin (S. Suzuki, M. Terakawa, F. Yokobayashi, F. Fujiwara, and T. Hata, Abstr. 39th Intersci. Conf. Antimicrob. Agents Chemother., abstr. F-144, 1999). Sixteen- to 128-fold increases in the MICs were seen for the C. albicans isolates tested, and there were 2- to 16-fold increases in the MICs for the C. krusei and C. tropicalis species tested. The reduction in activity due to protein binding was similar regardless of whether serum or plasma was used or whether the samples were heat inactivated. The decreased potencies were similar for tests performed with 10, 20, or 50% serum or plasma. Tawara et al. (6) also noted that the addition of human serum albumin (HSA) lowered the activity of micafungin. Tawara et al. (6) tested the MIC after the addition of 0.04, 0.4, and 4% HSA. They found that the MICs for the C. albicans species tested did not change with the addition of 0.04% HSA but increased 16 times with the addition of 0.4% HSA. By increasing the concentration of HSA to 4%, the MIC increased by 7 doubling dilutions, or 128-fold. The results that they found with the addition of 4% HSA are similar to our findings. This indicates that increasing the concentration of serum or plasma does not continue to lower the activity of micafungin once the concentration of serum or plasma has reached a threshold percentage. Once this threshold is exceeded, there may be a trade-off between the negative effect of protein binding and a positive inhibitory effect of the plasma or serum (7). It is likely that the increases in the MICs observed for C. albicans are much more dramatic (16- to 128-fold) compared to those for other species (2- to 16-fold) because the MIC for C. albicans is much lower, making the effect of protein binding more evident.
Since free drug levels in the body will be significantly lower due to the high level of protein binding, the level of micafungin penetration into tissue may be lowered, resulting in a reduction in the drug concentration at the site of infection. However, additional studies should be conducted in vivo and clinically to further elucidate how protein binding affects free drug levels in the body and at the site of infection. This may entail development of more sophisticated methods to describe drug protein binding dynamics.
Time-kill curve studies demonstrated that micafungin is a potent antifungal agent that slowly produces fungicidal activity. The time to achieve 50, 90, and 99.9% reductions in growth from the starting inocula show that there are few differences in the times to reach the endpoint between the different concentrations. Thus, the rate of killing was not increased substantially by increasing the drug concentration. The killing curves obtained with micafungin indicate that the drug is primarily fungicidal (>99.9% reductions in the numbers of CFU per milliliter). Fungicidal activity was noted for three of the four C. albicans isolates tested, all of the C. krusei isolates tested, and all of the C. glabrata isolates tested. Micafungin was fungistatic (<99.9% reduction in growth) for both C. tropicalis isolates tested. Thus, we conclude that the fungicidal activity of micafungin is species and isolate specific. Pharmacodynamic analysis of the time-kill data also suggests that the rate of antifungal activity was not influenced by increases in the drug concentration. By comparing the EC50s and EC90s over time (Table 5), we observed constant values up to 12 h, with some increase in the values at 24 h. This means that the concentration necessary to achieve 50 and 90% of the maximal effect is constant over time. That is, the rate of activity is not increased by increasing concentrations. In this study the Emax of micafungin did increase over time, suggesting that maximal activity occurs at the latest time point observed. The differences between the EC50s and EC90s do suggest, however, that the extent of antifungal activity is at least partially influenced by the concentration. Thus, by use of the pharmacodynamic parameters EC50, EC90, and Emax with the time-kill data that were obtained, we conclude that micafungin primarily displays fungicidal activity, with the rate of activity not increasing with an increase in the concentration but with the extent of activity (Emax) increasing with time. However, an increase in the drug concentration did appear to improve the activity of the drug against some of the isolates tested. Possible explanations for the differences in the rate and extent of activity of micafungin against the different species tested include organism growth characteristics, the binding affinity of the drug to the target enzyme, or the amount of glucan in the fungal cell membrane.
PAFE studies showed that miacfungin produces sustained activity following drug removal. The PAFE was measurable for all isolates tested, and this effect was enhanced by increasing the concentration of the antifungal. We previously found that two echinocandins, caspofungin and anidulafungin, displayed measurable PAFEs against two C. albicans isolates. After being exposed for 1 h to antifungal concentrations at or above the MIC for the organism, the PAFE was >12 h (2). Since micafungin is a semisynthetic echinocandin, we expected to see similar effects. While a profound PAFE was seen at the MIC80, the PAFE was markedly shorter for most isolates compared to those observed with caspofungin and anidulafungin. At the MIC the PAFE of micafungin ranged from −0.30 to ≥20.1 h. Previously, we found that the echinocandins, which exhibit fungicidal activity, display prolonged, dose-dependent PAFEs (2). Micafungin also demonstrated dose-dependent effects. The PAFE seen against each isolate tested was more profound with increasing concentrations of the antifungal. This difference in observed PAFEs between the echinocandins may be due to the lipophilicities of the compounds or the affinity of binding to the target enzyme.
This study demonstrates that micafungin is a potent antifungal, as evidenced by the low MICs obtained when it was tested against a variety of fungal species. We suggest that, by comparison with the MFC, the MIC80 describes the antifungal activity of this compound better than the MIC100. The MIC is increased by the addition of serum or plasma, likely due to the high degree of protein binding. However, because of the potency of the drug, this increase in MIC may have minor clinical implications but deserves further study. Micafungin displays primarily fungicidal activity that is influenced by fungal species. As with other echinocandins, PAFEs are observed and enhanced by increasing micafungin concentrations. These results suggest that micafungin may be useful for the treatment of Candida infections. These findings also suggest that this drug should be administered to achieve concentrations in excess of the MIC, with consideration of the drug's protein binding.
REFERENCES
- 1.Ernst, E. J., M. E. Klepser, M. E. Ernst, S. A. Messer, and M. A. Pfaller. 1999. In vitro pharmacodynamic properties of MK-0991 determined by time-kill methods. Diagn. Microbiol. Infect. Dis. 33:75-80. [DOI] [PubMed] [Google Scholar]
- 2.Ernst, E. J., M. E. Klepser, and M. A. Pfaller. 2000. Postantifungal effects of echinocandin, azole, and polyene antifungal agents against Candida albicans and Cryptococcus neoformans. Antimicrob. Agents Chemother. 44:1108-1111. [DOI] [PMC free article] [PubMed] [Google Scholar]
- 3.Klepser, M. E., E. J. Ernst, R. E. Lewis, M. E. Ernst, and M. A. Pfaller. 1998. Influence of test conditions on antifungal time-kill curve results: proposal for standardized methods. Antimicrob. Agents Chemother. 42:1207-1212. [DOI] [PMC free article] [PubMed] [Google Scholar]
- 4.Klepser, M. E., E. J. Wolfe, R. N. Jones, C. H. Nightingale, and M. A. Pfaller. 1997. Antifungal pharmacodynamic characteristics of fluconazole and amphotericin B tested against Candida albicans. Antimicrob. Agents Chemother. 41:1392-1395. [DOI] [PMC free article] [PubMed] [Google Scholar]
- 5.National Committee for Clinical Laboratory Standards. 1997. Reference method for broth dilution antifungal susceptibility testing of yeasts. Approved standard M27-A. National Committee for Clinical Laboratory Standards, Wayne, Pa.
- 6.Tawara, S., F. Ikeda, K. Maki, Y. Morishita, K. Otomo, N. Teratani, T. Goto, M. Tomishima, H. Ohki, A. Yamada, K. Kawabata, H. Takasugi, K. Sakane, H. Tanaka, F. Matsumoto, and S. Kuwahara. 2000. In vitro activities of a new lipopeptide antifungal agent, FK463, against a variety of clinically important fungi. Antimicrob. Agents Chemother. 44:57-62. [DOI] [PMC free article] [PubMed] [Google Scholar]
- 7.Zhanel, G. G., D. G. Saunders, D. J. Hoban, and J. A. Karlowsky. 2001. Influence of human serum on antifungal pharmacodynamics with Candida albicans. Antimicrob. Agents Chemother. 45:2018-2022. [DOI] [PMC free article] [PubMed] [Google Scholar]


