Abstract
The mechanical properties of materials and particularly the strength are greatly affected by the presence of defects; therefore, the theoretical strength (≈10% of the Young's modulus) is not generally achievable for macroscopic objects. On the contrary, nanotubes, which are almost defect-free, should achieve the theoretical strength that would be reflected in superior mechanical properties. In this study, both tensile tests and buckling experiments of individual WS2 nanotubes were carried out in a high-resolution scanning electron microscope. Tensile tests of MoS2 nanotubes were simulated by means of a density-functional tight-binding-based molecular dynamics scheme as well. The combination of these studies provides a microscopic picture of the nature of the fracture process, giving insight to the strength and flexibility of the WS2 nanotubes (tensile strength of ≈16 GPa). Fracture analysis with recently proposed models indicates that the strength of such nanotubes is governed by a small number of defects. A fraction of the nanotubes attained the theoretical strength indicating absence of defects.
Keywords: inorganic, mechanical properties
The strength of macroscopic objects is determined by the intrinsic (crystalline) properties of the material as well as by such extrinsic factors as grain boundaries, dislocations, vacancies, and other defects (1, 2). These extrinsic factors are affected by the manufacturing processes used for the preparation of a specific specimen. Thus, the strength of macroscopic objects is generally much smaller than the theoretical value of 10% of Young's modulus. This apparent discrepancy highlights the fact that the strength of materials is only partially determined by their intrinsic mechanical properties (1, 2), i.e., the strength of their chemical bonds.
In general, the strength of macroscopic materials increases as the scale decreases. In reinforcing fibers for example, this is true whether the scale is taken as the diameter of the fiber or its length. It is also true for the characteristic (or average) dimension of a reinforcing particle or a platelet. This phenomenon is usually called the size effect and can be understood by two distinct arguments, based either on probability or fracture mechanics. From a probabilistic viewpoint, Weibull (3, 4) and Freudenthal (5) proposed a formal link between the probability of occurrence of a critical defect in a solid of (dimensionless) volume, the concentration of defects, and the size (length, area, and volume) of the solid specimen. According to Weibull's model the probability of occurrence of a critical defect (and thus of failure) increases rapidly with increasing size for a given defect concentration. The same conclusion is reached when fracture mechanics arguments are used, based on the original observation of Griffith (6).
In contrast to macroscopic models, which deal with a statistically large number of defects within a body or a continuum of matter, nanomaterials and nanotubes in particular can be studied and modeled on a microscopic (atomistic) level (7, 8). Because only a discrete number of atomistic defects are present in the nanotube, the effect of individual defects can be examined experimentally and theoretically. By isolating and studying individual nanostructures, which contain no defects, one may hope to achieve strengths much larger than the macroscopic analogues. Also, the dimensions of the examined specimen are not necessarily a relevant parameter in judging their strength. Rather the control of the synthesis of the nanotubes determines their perfectness and consequently their strength. Indeed, long and defect-free nanotubes can be stronger than shorter nanotubes, which contain many point defects. A contrasting proposal is that below a certain critical size, nanomaterials may well become altogether insensitive to defects (9).
Recently, two studies analyzing the influence of the vacancy-related defects on the ultimate strength of nanotubes were published (10, 11). The first study used quantized fracture mechanics (QFM) to describe the strength of (carbon) nanotubes and (silicon) nanowires (10). The model is in fact the Griffith theory adapted for a beam with a discrete number of defects, which could arise from a few missing atoms in the nanostructure. The second study used atomistic computer simulations and analytical continuum theory to describe the influence of the concentration of vacancy related defects (11) on Young's modulus and tensile strength. The enormous influence of a single missing atom defect on the strength of nanotubes is demonstrated in both of these studies.
With the advent of methodologies for the synthesis and manipulation of individual nanotubes, a systematic study of their mechanical properties is now feasible (12–18). This progress allows, in return, the testing of the above models (10, 11). In view of the present findings it can be concluded that inorganic nanotubes may well in the future be the basis of a new generation of high-performance nanocomposites.
Since the discovery of inorganic fullerene-like nanostructures and nanotubes (IF) of WS2 in 1992 (19), many more IF nanoparticles were reported, including MoS2 (20), BN (21), VOx (22), NiCl2 (23), WO2Cl2 (24), etc. The physical properties of these nanomaterials so far have not been investigated extensively. It was nevertheless pointed out by both theory and experiment that this brand of new nanomaterials possesses a wide range of electrical and optical properties that can be tuned with the diameter of the nanotubes (25) offering a host of new applications.
Carbon nanotubes have been proposed for use in a variety of applications where high strength is implicated. Inorganic nanotubes have unique properties that may offer certain advantages, like high compression strength. They possess some mixed covalent-ionic nature. In fact, some (like WS2 and MoS2) are more covalent in nature, whereas metal-halide nanotubes, like those of NiCl2, are much more ionic and are therefore chemically much more reactive. The known phase diagram of Mo–S and W–S does not contain any specific high-pressure phase and consequently these materials are not expected to yield under load. Indeed, diamond anvil cell experiments showed that both materials are stable under a pressure of 20–30 GPa (R. Vaidya, M. Dave, S. G. Patel, A. R. Jani, A. B. Garg, V. Vijayakumar, and B. K. Godwal, personal communication). Recently, the shock-wave resistance of both fullerene-like structures and nanotubes of WS2 and MoS2 was studied. WS2 nanotubes were found to survive shock waves of up to 21 GPa (26), and fullerene-like MoS2 nanoparticles could withstand shock waves as high as 30 GPa (27). These findings suggest numerous applications for these nanomaterials, highlighting the need for fundamental studies of their mechanical properties.
The mechanical properties of multilayer WS2 nanotubes were not studied extensively until now. Recently, the buckling of individual WS2 nanotubes mounted on silicon cantilevers was demonstrated in the atomic force microscope. This experiment measured an average Young's modulus of 171 GPa (18), in close agreement with the value obtained from theoretical calculations [150 GPa (18)].
In this study, tensile tests and buckling experiments of multiwall WS2 nanotubes were performed and compared with simulated tensile tests of defect-free, single-wall MoS2 nanotubes that previously were studied theoretically (28). Notwithstanding the subtle chemical differences between the two compounds, MoS2 is isostructural to WS2, and they both have very similar properties. The choice and limitations of the simulation result in a model that provides a qualitative agreement with the measured system and provides realistic limits for the ideal nanotube strength. Furthermore, the simulations allow a visual perspective on the atomic-level details of the nanotube failure, details unavailable from experiment. The results of the tensile strength, elongation, and Young's modulus emphasize the unique mechanical properties of nanotubes.
Results and Discussion
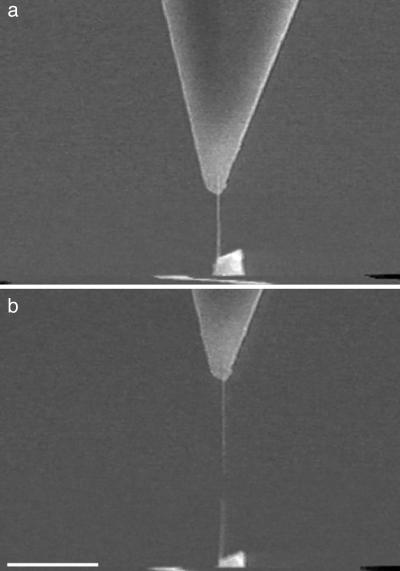
Tensile Tests. Tensile tests of WS2 nanotubes were carried out in a scanning electron microscope (SEM) as described by Yu et al. (13, 14). Images of the nanotube before and after rupture are presented in Fig. 1, and the tensile strength results are presented in Table 1. To calculate the applied stress, it was assumed that the load was applied only to the outer layer of the nanotube because the bond to the force transducer covered only the outer surface of the nanotube. Hence, rupture of the nanotube occurred only at the outer shell, and inner shell movement followed it in a telescopic manner. This hypothesis was confirmed by observing that the total length of the fragments was significantly larger than the initial nanotube length. For instance in Fig. 1, the initial length of the nanotube was 1.5 μm and the lengths of the two fragments are 2 and 1.3 μm. The cross section of the outer layer was calculated as π Dt (13), where D is the outer diameter of the nanotube and t is the shell thickness (t = 6.2 Å), i.e., one-half the lattice constant c. Young's modulus, strength, and elongation values were found to be 152 GPa (±68), 3.7–16.3 GPa (±11%), and 5–14% (±0.1%), respectively. Here, the stated experimental uncertainty for the Young's modulus is the standard deviation derived from the measurements, whereas for the other measurements it is propagated from the known uncertainty of the various measured parameters. The values of Young's modulus agree with the value obtained from the buckling experiment (18).
Fig. 1.
SEM images of tensile test of an individual WS2 nanotube. Shown is the tensile test of an individual nanotube (≈20 nm in diameter) that is attached to two atomic force microscope cantilevers (amorphous carbon serves as a glue); the force is applied through the upper cantilever, which has a higher force constant compared with the lower one. (a) A loaded nanotube, before fracture. (b) Two pieces of the nanotube after fracture occurred. (Scale bar: 2 μm.)
Table 1. The tensile strength results of WS2 nanotube.
| Length, μm | Diameter, nm | Force, N | Strength, GPa | Strain, % | E, GPa |
|---|---|---|---|---|---|
| 2.17 | 20 | 5.87E-7 | 15.10 | — | — |
| 2.95 | 30 | 5.71E-7 | 9.77 | 8.30 | 119.9 |
| 2.03 | 20 | 3.37E-7 | 8.66 | 8.70 | 150.4 |
| 2 | 34 | 1.31E-7 | 3.75 | — | — |
| 1.55 | 25 | 7.83E-7 | 16.09 | — | — |
| 4.6 | 25 | 5.87E-7 | 15.07 | 5.03 | 218.0 |
| 0.85 | 30 | 7.78E-7 | 13.32 | 10.08 | 81.6 |
| 2.4 | 36 | 1.14E-6 | 16.27 | 11.60 | 244.0 |
| 2.09 | 19 | 2.49E-7 | 6.74 | 6.90 | 102.2 |
| 1.81 | 18 | 5.55E-7 | 15.8 | 14.00 | 109.3 |
| 1 | 11 | 2.91E-7 | 13.58 | 12.70 | 87.6 |
| 1.09 | 21 | 3.45E-7 | 8.42 | — | — |
| 1.97 | 20 | 5.83E-7 | 14.97 | 11.10 | 255.3 |
| 1.7 | 20 | 3.0E-7 | 7.70 | — | — |
| 0.77 | 20 | 4.3E-7 | 11.05 | — | — |
| 2.8 | 20 | 4.87E-7 | 12.50 | 7.75 | 151.4 |
The high tensile strength of these nanotubes seems to be very promising compared with other known high-strength materials as presented in Table 2 (2, 13, 14). The combination of high tensile strength and ≈14% elongation is a unique property for all of the nanotubes that so far were measured (13, 14). Furthermore, the strength of the strongest nanotubes is ≈11% of its Young's modulus, corresponding approximately to the theoretical value of the material's strength. This value is appreciably larger than typical high-strength engineering materials (ref. 2, p.191). These findings indicate that the WS2 nanotubes are remarkably free of critical defects.
Table 2. Mechanical properties of strong materials.
| Material | Modulus of elasticity, GPa | Tensile strength, GPa | Elongation, % |
|---|---|---|---|
| Steel alloy 4340 | 207 | 1.76 | 12 |
| Stainless alloy 440A | 200 | 1.79 | 3.5 |
| Tungsten | 400 | 0.76 | 2 |
| Diamond | 700-1,200 | 1.05 | |
| Silicon nitride | 304 | 0.7-1 | |
| Zirconia | 205 | 0.8-1.5 | |
| Aramid fiber | 60-150 | 3.6-4.1 | 2.8 |
| Carbon fiber | 200-750 | 4.65-7.1 | 1.8 |
| E glass | 72 | 3.45 | 4.3 |
| C nanotubes | 1,000 | 20-63 | 13 |
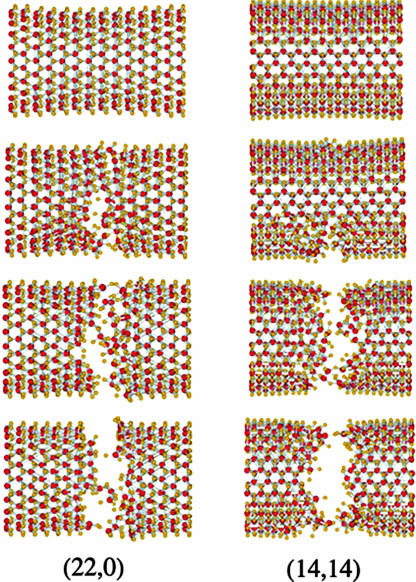
A combined molecular dynamics (MD) density functional–tight binding simulation of the stretching process was performed for single-wall MoS2 nanotubes. According to these simulations, the failure of the nanotube is abrupt starting at a single atomic defect and propagating very quickly across its entire circumference. The calculated stress and strain are 40 GPa and 17% for the zigzag (22,0) tube, and 34 GPa and 19% for the armchair (14,14) tube. Fig. 2 presents the simulated rupture process. A movie of the computer simulations is provided as Movie 1, which is published on the PNAS web site. The calculated strength results are equivalent to 17.4% and 14.7% (for the zigzag and armchair nanotubes, respectively) of Young's modulus of MoS2 nanotubes (which was calculated to be 230 GPa) (18). These values compare favorably with the experimental strength (11% of their Young's modulus) and elongation (14% values). The small differences can be attributed to the fact that under the experimental conditions, equilibrium may not be established. Furthermore, thermal fluctuations, which can lead to “early” failure, could not be fully accounted for in the calculations. Finally, the experimental elongation is a lower bound, because the last SEM micrograph from which it is taken misses any additional elongation up to the failure point observed in the final SEM micrograph.
Fig. 2.
Simulated tensile tests of single-wall MoS2 nanotubes. The rupture progress is described by MD density functional–tight binding simulation for zigzag (22,0) and armchair (14,14) nanotubes.
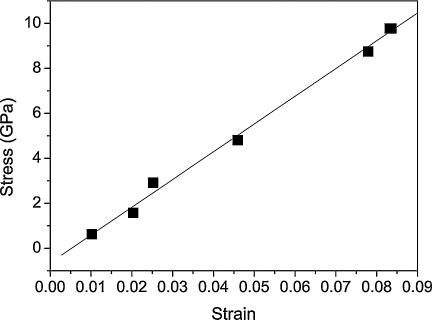
An example of an experimentally determined stress–strain behavior of a WS2 nanotube is presented in Fig. 3. The stress–strain plots show that the nanotube deformed elastically, almost until failure. This behavior is in close agreement with the results of the simulations.
Fig. 3.
Stress–strain plot of an individual WS2 nanotube. The linear behavior of the plot indicates that the nanotubes deformed elastically until failure.
As mentioned in the introduction, the strength of bulk materials at the macroscale is dictated by defects. It is commonly assumed that, in strong microscale fibers such as carbon and glass, the severity of the flaws follows a Poisson distribution, whereas the strength of a fiber is determined by the most severe flaw: failure of the weakest point in the fiber results in general failure of the fiber. This behavior may conveniently be modeled by the Weibull two-parameter distribution. The cumulative distribution function F(σf) for the two-parameter Weibull distribution is (3, 4)
 |
[1] |
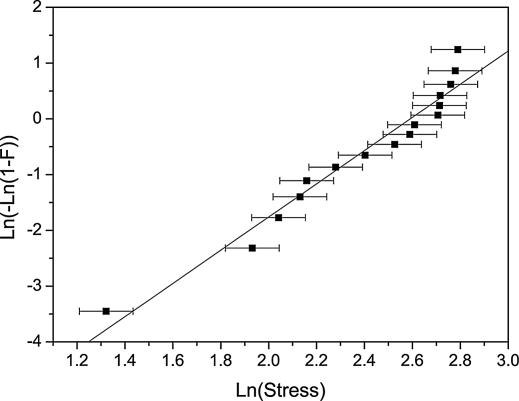
where F(σf) is simply termed the probability of failure, σf is the failure strength of the nanotube, α is a scale parameter with dimensions of stress, and β is a dimensionless shape parameter. The validity of the Weibull model was tested on the tensile strength results of the WS2 nanotubes. The probability of failure was estimated by using the lowest mean-squared error estimator, defined by (i – 1/2)/N (29), where i is the running index number and N is the total number of measurements. The Weibull plot is presented in Fig. 4. Notwithstanding the limited number of available measurements, fitting of the strength values of the WS2 nanotubes to Eq. 1 was not successful over the entire range of measured values. A careful review of the plot shows that the last four points, i.e., the nanotubes with the highest strength values, seem to show the largest deviation from the fitted curve. Because those nanotubes are believed to be free of critical defect (see Fig. 5 and the ensuing discussion), they are not likely to conform to the Weibull plot.
Fig. 4.
Weibull plot: Ln(–Ln(1 – F)), where F is the probability of failure at a given stress vs. Ln(Stress). The probability of failure can be described by the Weibull model if the plot is linear.
Fig. 5.
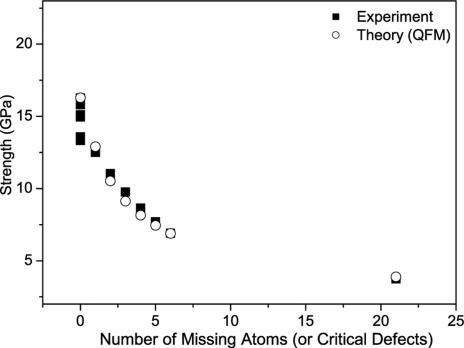
Strength vs. number of missing atoms in the critical defect according to the QFM model. The squares represent the analysis of the experimental results, and the circles represent the calculated strength according to the QFM model.
The Griffith theory of brittle fracture predicts that for a given length of crack in a solid, there exists a unique critical stress for which the crack is in stationary equilibrium. The Griffith theory is the result of continuum considerations; however, because solids are composed of discrete atoms, the continuum prediction of a unique equilibrium stress should break down when the discrete nature of the lattice is considered. Such an approach may be expected to give insights on nanoscale events. In the 1970s, Thomson et al. (30, 31) extended the Griffith theory to take into account the discrete nature of the lattice. Recently, an approach to nanomaterial fracture mechanics, the QFM model, was developed in the specific context of nanotubes (10). Here, an energy-based theory of fracture mechanics involving a modification of the well known continuum-based model has been developed that explicitly accounts for the discrete nature of matter (or energy release). The size of the defects or the number of missing atoms in the critical locus is calculated by the equation
 |
[2] |
where σf(n) is the strength of the material for an n-atom defect, σc is the ideal strength, ρ is the rupture radius for the developing fault, and a is the lattice parameter (termed fracture quantum in ref. 10). For a linear chain of n removed atoms, 2ρ ≈ a. In ref. 10 the fitting process used the theoretically determined σc and directly assigned the set of n by ordering the σf(n). A different procedure was applied here because σc was not known, but rather fit, together with a trial set of n. The best fit to Eq. 2 therefore both provided an estimate for σc and uniquely determined the value of n for each strength value measured. The results are presented in Fig. 5. According to this analysis, some of the nanotubes are defect-free, whereas others contain 1–21 missing atoms in the critical loci that lead to their fracture. In the case of a WS2 nanotube a critical defect is not well defined by a missing atom because each layer is composed of three atoms. The defect in this case could be more subtle; for instance, a conformational change. The calculated value of σc (15.8 GPa) from fitting to Eq. 2 compares favorably with the average strength value of the defect-free nanotubes, which is 15.7 GPa (see Fig. 5). This value also agrees with the estimated strength of a defect-free material, i.e., 10% of Young's modulus (1). Furthermore, the nanotubes evaluated as defect-free (n = 0) correspond to those exhibiting ideal Young's Modulus as described above.
A theoretical study on the role of defects in determining the mechanical strength of nanotubes recently was published (11). The combination of continuum methods and atomistic simulation was used to evaluate the elastic properties of nanotubes containing defects. The simulations were performed for nanotubes with single, double, and triple vacancies. The results indicated that the tensile strength of a nanotube can degrade to 60–85% of the defect-free nanotube strength, if vacancies are present. The estimated number of missing atoms or critical atomic defects according to QFM in the WS2 nanotubes seems to agree with the results of this simulation. The tensile strength of these nanotubes is found to be ≈60–80% of the defect-free nanotube strength if single, double, and triple atoms are missing.
In conclusion, based on the analysis of the tensile measurement it can be assumed that some of the WS2 nanotubes are defect-free, whereas others have a discrete number of critical atomic defects.
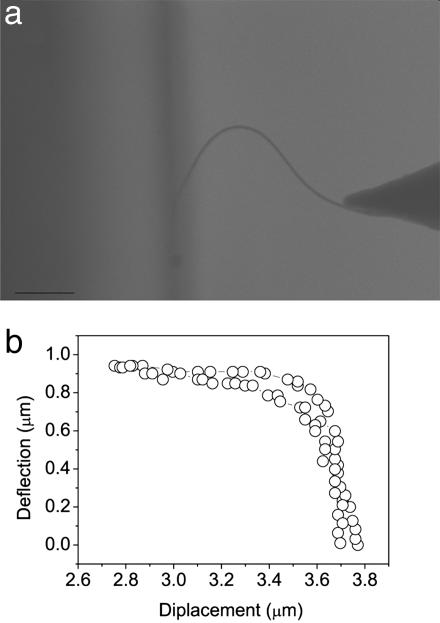
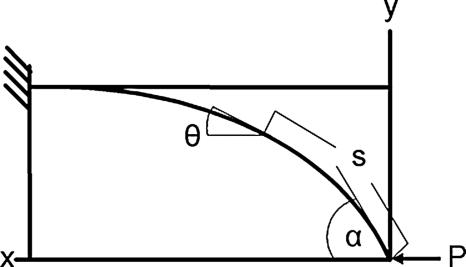
Buckling Experiments. Post-buckling experiments on WS2 nanotubes were performed in an SEM equipped with a nanomanipulation system. These experiments resulted in a large deformed nanotube (Fig. 6). The post-buckling behavior of the WS2 nanotubes was studied by applying the Elastica theory, which describes large deflections of buckled bars (32). The large elastic deformation of the WS2 nanotubes and the absence of hysteresis are clearly demonstrated here (Fig. 6). According to the theory, for a thin bar with a stiffness EI (where E is the Young's modulus and I is the geometrical moment of inertia) under axial force P at the free end, the large displacement coordinates can be described at any point (x, y) and length (s) (32) along the nanotube (see Fig. 7). For the analysis only the expression for the y coordinate was used:
 |
[3] |
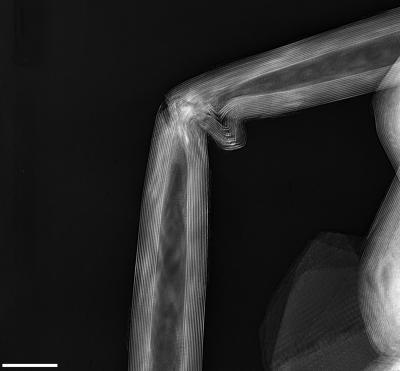
Young's modulus was calculated according to Eq. 3 at each y point of the nanotube's curve. Thus, calculated values of the Young's modulus varied and were close to 150 GPa only when θ was almost identical to α (edge of the nanotube). These results can be explained by means of the geometrical moment of inertia I, which is assumed to be constant along the buckled nanotube but in fact is not. A transmission electron microscope image (Fig. 8) of a naturally occurring large deflected nanotube shows that the shape of the nanotubes is distorted at the maximal curvature, and it is incorrect to assume a cylindrical shape with a constant radius for the geometrical moment of inertia. Indeed, the geometrical moment of inertia that was used for the calculation was true only for the ends of the nanotube.
Fig. 6.
Large deformations of nanotube measured in SEM for post-buckling elastic analysis. (a) The large deformation of the nanotubes in the post-buckling stage is described by the SEM image. (Scale bar: 1 μm.) (b) A deflection vs. displacement curve of the nanotube in a. The plot demonstrates the elastic behavior of the nanotube at large deflections.
Fig. 7.
Scheme of the post-buckling shape of a beam that is used for the Elastica analysis. The parameters that are used for the Elastica equations are presented in this scheme.
Fig. 8.
Transmission electron microscope image of a naturally buckled nanotube. This image demonstrates clearly that the cross section of the nanotube is not constant. (Scale bar: 20 nm.)
Conclusions
This study shows that WS2 nanotubes are both ultra-strong and elastic, distinguishing them from other known materials. Furthermore, the results of these experiments were found to be in good agreement with the QFM model, suggesting that the mechanical properties of the WS2 nanotubes are dictated by a discrete number of atomistic defects and the intrinsic strength of the W–S chemical bond. Thus, individual nanotubes have been shown to demonstrate ideal strength, providing real evidence for defect-free structures. In situ buckling experiments carried out within the SEM were in agreement with previous measurements made by atomic force microscope, providing independent support for the value of Young's modulus. Questions regarding the shear modulus of these nanotubes and the influence of chirality on the mechanical properties have yet to be addressed. Still, these high-strength and quite ductile materials are good candidates for numerous applications from nanocomposites to nanomachines.
Materials and Methods
Multiwall WS2 nanotubes 15–30 nm in diameter (5–8 layers) and 2–5 μm long were synthesized by the fluidized bed reactor as described in ref. 33. Both tensile tests and buckling experiments of individual nanotubes were carried out within the high-resolution SEM. The direct tensile tests were done as described in refs. 13 and 14 in SEM (E-SEM model FEI XL-30 equipped with a micromanipulation system, Quarter Research and Development). The nanotubes were attached to Si cantilevers (see Fig. 1) by exposing the contact point to the electron beam, producing amorphous carbon from hydrocarbons in the vacuum to form high-strength glue. Whereas the upper cantilever with high force constant >30 N/m was moved, the lower cantilever (nominal 0.2 N/m force constant) was deflected in response to the applied force until the nanotube was broken (see Fig. 1). The experiment was recorded by video recorder cassette, digitized, and subsequently analyzed.
The buckling experiments were performed in the LEO Supra 55 high-resolution SEM equipped with a nanomanipulator (Klocke Nanotechnik; 10-nm steps). For this experiment a WS2 nanotube was attached to an atomic force microscope cantilever (force constant of 0.05 N/m) within the E-SEM. A mirrorpolished silicon wafer was pushed against the mounted nanotube. The nanotube was pictured after each movement and subsequently digitized and analyzed. Cantilever spring constants were calculated with accuracy of 5% according to the method of Sader et al. (34).
A combined MD density functional–tight binding simulation of the stretching process was performed for single-wall MoS2 nanotubes, which have the same structure as that of WS2 nanotubes. As representative examples, (22,0) zigzag and (14,14) armchair nanotubes with a diameter of ≈30 Å were chosen for this calculation. Simulations of the stretching process have been carried out within the density-functional-based tight-binding method (35, 36), employing the demon program (37). The tube models were computed in super cells containing 10 unit cells for the armchair (14,14) tube (840 atoms) and 7 unit cells for the zigzag (22,0) tube (924 atoms). On each side of the boxes, the coordinates of one unit cell (168 atoms for the armchair and 264 atoms for the zigzag tube) were fixed during the MD simulations. The MD simulations have been carried out within an NVT ensemble [constant number of particles (N), constant volume (V), constant temperature (T)] at 300 K. The stretching process was simulated in the following way: starting from ideal, defect-free structures, an initial MD run of 0.2 ps was performed. The resulting structure was stretched by a parameter Δz: the fixed atoms, which marked the left and right borders of the super cell, were shifted by Δz/2, and the coordinates of the remaining atoms were scaled by a factor (L +Δz)/L, where L is the length of the nanotube. This stretched tube was taken as the initial structure for a succeeding MD simulation using the same parameters, and the procedure was repeated until the tube broke apart, which happened after 20 repetitions of this procedure. In a similar way, 20 starting trajectories for different elongations have been obtained, which have been individually equilibrated. Finally, independent trajectories of 4 ps were computed.
Supplementary Material
Acknowledgments
We thank R. Rosentsveig for synthesis of the WS2 nanotubes and A. Margolin for the transmission electron microscope picture. This work was supported by the Minerva Foundation, the G. M. J. Schmidt Minerva Center, and The German–Israeli Foundation. R.T. is the director of the Helen and Martin Kimmel Center for Nanoscale Science.
Conflict of interest statement: No conflicts declared.
This paper was submitted directly (Track II) to the PNAS office.
Abbreviations: MD, molecular dynamics; QFM, quantized fracture mechanics; SEM, scanning electron microscope.
References
- 1.Ashby, M. F. (1989) Acta Metall. 37, 1273–1293. [Google Scholar]
- 2.Callister, W. D. (1999) Materials Science and Engineering: An Introduction (Wiley, New York).
- 3.Mann, N. R., Schafer, R. E. & Singpurwalla, N. D. (1974) in Methods for Statistical Analysis of Reliability and Life Data (Wiley, New York).
- 4.Wagner, H. D. (1989) J. Polymer Sci. B 27, 115–149. [Google Scholar]
- 5.Freudenthal, A. M. (1968) in Fracture, ed. Liebowitz, H. (Academic, New York), Vol. 2, pp. 592. [Google Scholar]
- 6.Griffith, A. A. (1921) Philos. Trans. R. Soc. London A 221, 163–198. [Google Scholar]
- 7.Yakobson, B. I. & Avouris, P. (2001) Top. Appl. Phys. 80, 287–327. [Google Scholar]
- 8.Wu, B., Heidelberg, A. & Boland, J. J. (2005) Nat. Mater. 4, 525–529. [DOI] [PubMed] [Google Scholar]
- 9.Gao, H., Ji, B., Jager, I. L., Artz, E. & Fratzl, P. (2003) Proc. Natl. Acad. Sci. USA 100, 5597–5600. [DOI] [PMC free article] [PubMed] [Google Scholar]
- 10.Pugno, N. M. & Ruoff, R. S. (2004) Philos. Mag. 84, 2829–2845. [Google Scholar]
- 11.Smmalkorpi, M., Krasheninnikov, A., Kuronen, A., Nordlund, K. & Kaski, K. (2004) Phys. Rev. B 70, 245416-1–245416-8. [Google Scholar]
- 12.Lourie, O., Cox, D. M. & Wagner, H. D. (1998) Phys. Rev. Lett. 81, 1638–1641. [Google Scholar]
- 13.Yu, M., Lourie, O., Dyer, M. J., Moloni, K., Kelly, T. F. & Ruoff, R. S. (2000) Science 287, 637–640. [DOI] [PubMed] [Google Scholar]
- 14.Yu, M., Files, B. S., Arepalli, S. & Ruoff, R. S. (2000) Phys. Rev. Lett. 84, 5552–5555. [DOI] [PubMed] [Google Scholar]
- 15.Williams, P. A., Papadakis, S. J., Patel, A. M., Falvo, M. R., Washburn, S. & Superfine, R. (2002) Phys. Rev. Lett. 89, 255502-1–255502-4. [DOI] [PubMed] [Google Scholar]
- 16.Demczyk, B. G., Wang, Y. M., Cumings, J., Hetman, M., Han, W., Zettl, A. & Ritchie, R. O. (2002) Mater. Sci. Eng. A 334, 173–178. [Google Scholar]
- 17.Barber, A. H., Cohen, S. R. & Wagner, H. D. (2003) Appl. Phys. Lett. 82, 4140–4142. [Google Scholar]
- 18.Kaplan-Ashiri, I., Cohen, S. R., Gartsman, K., Rosentsveig, R., Seifert, G. & Tenne, R. (2004) J. Mater. Res. 19, 454–459. [Google Scholar]
- 19.Tenne, R., Margulis, L., Genut, M. & Hodes, G. (1992) Nature 360, 444–446. [Google Scholar]
- 20.Feldman, Y., Wasserman, E., Srolovitz, D. & Tenne, R. (1995) Science 267, 222–225. [DOI] [PubMed] [Google Scholar]
- 21.Chopra, N. G., Luyken, R. J., Cherrey, K., Crespi, V. H., Cohen, M. L., Louie, S. G. & Zettl, A. (1995) Science 269, 966–967. [DOI] [PubMed] [Google Scholar]
- 22.Spahr, M. E., Bitterli, P., Nesper, R., Muller, M., Krumeich, F. & Nissen, H. U. (1998) Angew. Chem. Int. Ed. 37, 1263–1265. [DOI] [PubMed] [Google Scholar]
- 23.Hacohen, Y. R., Grunbaum, E., Tenne, R., Sloan, J. & Hutchison, J. L. (1998) Nature 365, 336–337. [Google Scholar]
- 24.Armstrong, A. R., Canales, J. & Bruce, P. G. (2004) Angew. Chem. Int. Ed. 43, 4899–4902. [DOI] [PubMed] [Google Scholar]
- 25.Tenne, R. (2003) Angew. Chem. Int. Ed. 42, 5124–5132. [DOI] [PubMed] [Google Scholar]
- 26.Zhu, Y. Q., Sekine, T., Brigatti, K. S., Firth, S., Tenne, R., Rosentsveig, R., Kroto, H. W. & Walton, D. R. M. (2003) J. Am. Chem. Soc. 125, 1329–1333. [DOI] [PubMed] [Google Scholar]
- 27.Zhu, Y. Q., Sekine, T., Li, Y. H., Fay, M. W., Zhao, Y. M., Poa, C. H. P., Wang, W. X., Roe, M. J., Brown, P. D., Fleischer, N. & Tenne, R. (2005) J. Am. Chem. Soc. 127, 16263–16272. [DOI] [PubMed] [Google Scholar]
- 28.Seifert, G., Terrones, H., Terrones, M., Jungnickel, G. & Frauenheim, T. (2000) Phys. Rev. Lett. 85, 146–149. [DOI] [PubMed] [Google Scholar]
- 29.Mann, N. R., Schafer, R. E. & Singpurwalla, N. D. (1974) Methods for Statistical Analysis of Reliability and Life Data (Wiley, New York), p. 216.
- 30.Thomson, R., Hsieh, C. & Rana, V. (1971) J. Appl. Phys. 42, 3154–3160. [Google Scholar]
- 31.Thomson, R. (1986) Solid State Phys. 39, 2–120. [Google Scholar]
- 32.Timoshenko, S. P. & Gere, J. M. (1961) Theory of Elastic Stability (McGraw–Hill, New York).
- 33.Rosentsveig, R., Margolin, A., Feldman, Y., Popovitz-Biro, R. & Tenne, R. (2002) Chem. Mater. 14, 471–473. [Google Scholar]
- 34.Sader, J. E., Larson, I., Mulvaney, P. & White, L. R. (1995) Rev. Sci. Instrum. 66, 3789–3798. [Google Scholar]
- 35.Seifert, G., Porezag, D. & Frauenheim, T. (1996) Int. J. Quantum Chem. 58, 185–192. [Google Scholar]
- 36.Porezag, D., Frauenheim, T., Köhler, T., Seifert, G. & Kaschner, R. (1995) Phys. Rev. B 51, 12947. [DOI] [PubMed] [Google Scholar]
- 37.Köster, A. M., Flores-Moreno, R., Geudtner, G., Goursot, A., Heine, T., Reveles, J. U., Salahub, D. R., Vela, A. & Patchkovskii, S. (2004) deMon (National Research Council, Ottawa), Version 1.1.
Associated Data
This section collects any data citations, data availability statements, or supplementary materials included in this article.


