

Abstract
Here we describe hemopoietic chimeras serving as a mouse model for NUP98–HOXA9-induced leukemia, which reproduced several of the phenotypes observed in human disease. Mice transplanted with bone marrow cells expressing NUP98–HOXA9 through retroviral transduction acquire a myeloproliferative disease (MPD) and eventually succumb to acute myeloid leukemia (AML). The NUP98 portion of the fusion protein was shown to be responsible for transforming a clinically silent pre-leukemic phase observed for Hoxa9 into a chronic, stem cell-derived MPD. The co-expression of NUP98–HOXA9 and Meis1 accelerated the transformation of MPD to AML, identifying a genetic interaction previously observed for Hoxa9 and Meis1. Our findings demonstrate the presence of overlapping yet distinct molecular mechanisms for MPD versus AML, illustrating the complexity of leukemic transformation.
Keywords: AML/Hox/Meis/NUP98–HOXA9/PBX
Introduction
The nucleoporin NUP98 gene on chromosome 11p15 is involved in relatively rare but recurring translocations observed in de novo acute and chronic leukemias, as well as therapy-related myelodysplastic syndrome (t-MDS) and acute myeloid leukemia (t-AML) (Borrow et al., 1996; Nakamura et al., 1996a, 1999; Arai et al., 1997; Raza-Egilmez et al., 1998; Ikeda et al., 1999; Nishiyama et al., 1999). Among the target genes in these translocations are several homeobox genes, including PMX1 (on chromosome 1q23) (Nakamura et al., 1999) and HOXD13 (2q31) (Raza-Egilmez et al., 1998), while unidentified targets on 12q13 and 17q21 may involve genes of the HOXB and HOXC clusters, respectively (Nishiyama et al., 1999). The most frequent target of 11p15 translocations is homeobox gene HOXA9 (7p15) and while t(7;11)(p15;p15) is predominantly observed in patients with AML (Borrow et al., 1996; Nakamura et al., 1996a), cases of chronic diseases have been reported as well (Inaba et al., 1996; Hatano et al., 1999; Wong et al., 1999). The importance of HOXA9 in human leukemias was also demonstrated in an analysis of 6817 genes in leukemias of poor prognosis, which found the most highly correlating factor to be the expression of HOXA9 (Golub et al., 1999).
The leukemogenic potential of murine Hoxa9 was directly assessed in hemopoietic chimeras where its over-expression in bone marrow cells induced AML after a latency period (Kroon et al., 1998). In addition, Meis1 together with Hoxa7 or -a9 is a frequent target of endogenous retroviral insertional activation in the leukemic cells of the BXH-2 mice (Nakamura et al., 1996b), suggesting a leukemogenic collaboration between Meis1 and Hox genes. In support of this, the co-expression of Meis1 dramatically reduced the latency of AML induced by Hoxa9 (Kroon et al., 1998) and Hoxb3 (Thorsteinsdottir et al., 2001). Meis1 and other members of the Meis subfamily of homeoproteins have been shown to interact with and direct the nuclear localization of PBX homeoproteins (Chang et al., 1997; Rieckhof et al., 1997; Berthelsen et al., 1999). The results from in vitro fibroblast transformation assays suggest that HOX proteins, including Hoxa9, require the presence of and interaction with PBX proteins (Krosl et al., 1998; Kasper et al., 1999; Schnabel et al., 2000), with which they form heterodimeric DNA-binding complexes (Chang et al., 1995; Phelan et al., 1995). A trimeric DNA-binding complex composed of Hoxa9, Pbx2 and Meis1 has been detected in leukemic cell lines and it has been suggested that leukemogenesis by Hoxa9 may require the formation of such a complex (Shen et al., 1999; Schnabel et al., 2000). However, in vitro immortalization of myeloid progenitor cells by Hoxa9 was reported to occur in the absence of Meis expression and Hoxa9–PBX interaction (Calvo et al., 2000), suggesting that HOX-induced transformation might also occur independently of collaborators in the Meis and PBX families. PBX-independent functions in hemopoietic cells have also been described in vitro and in vivo for HOXB4 (Beslu et al., 2000).
In all chimeric NUP98–homeoprotein fusions described to date, the N-terminal portion of NUP98 is fused to the C-terminal portion of its partner, which includes the DNA-binding homeodomain (Borrow et al., 1996; Nakamura et al., 1996a, 1999; Raza-Egilmez et al., 1998). NUP98 was shown to confer potent transcriptional activity onto its partner in NUP98–PMX1 (Nakamura et al., 1999) and NUP98–HOXA9, and in the latter this appears to be mediated through CBP/p300 (Kasper et al., 1999). NUP98–HOXA9 has also been shown to form a cooperative DNA-binding complex with PBX1, and its capacity to transform NIH 3T3 cells appears to require this interaction (Kasper et al., 1999). These data suggest that leukemogenesis through NUP98–HOXA9 may require nuclear PBX, implicating a potential role for Meis1 as well.
We evaluated the leukemogenic potential of NUP98– HOXA9 through retroviral transduction and transplantation of bone marrow cells. The results indicated that NUP98–HOXA9 and Hoxa9 share the capacity to induce AML and collaborate with Meis1, but that NUP98–HOXA9 is unique in its potential to induce a pre-leukemic MPD.
Results
NUP98–HOXA9 transplantation chimeras develop a chronic MPD
To determine whether the expression of NUP98–HOXA9 could transform hemopoietic cells, the fusion protein was expressed in primary bone marrow cells through retroviral gene transfer. Figure 1A–C shows schematic representations of the fusion protein and the MSCV retrovirus, and demonstrates that the latter directs the expression of the appropriate protein in infected cells. Directly following retroviral infection of bone marrow cells, NUP98–HOXA9 had no detectable effects on the in vitro differentiation and hemopoietic growth factor requirement of myeloid colony forming cells (CFC) in semi-solid cultures (data not shown). However, the abnormally large size of the colonies that grew in such cultures suggested that NUP98–HOXA9-transduced bone marrow progenitors acquired a marked increase in their proliferative potential (data not shown). Consistent with this, NUP98–HOXA9-expressing cells replated more efficiently (Figure 1D, >60 randomly selected colonies analyzed per group) and the colonies generated in the secondary cultures were much larger than the controls (Figure 1E). Interestingly, the replating efficiency of Hoxa9- and NUP98–HOXA9-transduced cells was similar (87 and 88%, respectively), but fewer and smaller secondary Hoxa9 colonies were observed (data not shown). Thus, while NUP98–HOXA9 expression does not appear to affect in vitro differentiation of primary bone marrow cells, it induces a dramatic increase in their proliferative capacity.
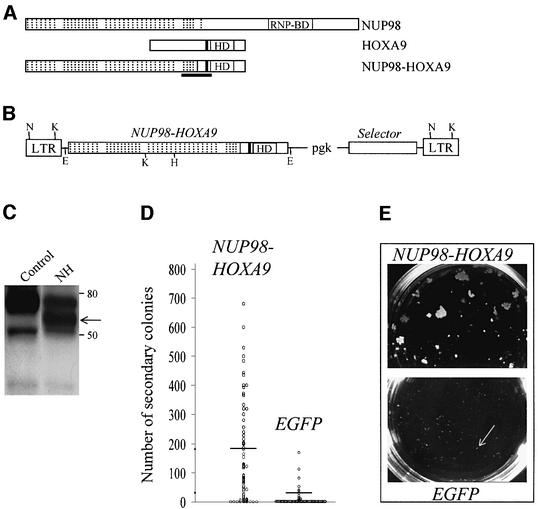
Fig. 1. Recombinant retrovirus-mediated expression of NUP98–HOXA9 in primary bone marrow cells results in enhanced proliferation in vitro. Schematic representations of NUP98, HOXA9 and the NUP98–HOXA9 fusion protein (A) and the MSCV (Hawley et al., 1994) retroviral vector employed in these studies (B), the demonstration that the recombinant retrovirus directs the expression of the appropriate protein in infected cells (C), and that NUP98–HOXA9 expression in bone marrow cells enhances the proliferative potential of myeloid progenitor cells in vitro (D, E). (A) Hashed lines denote the 38 FG repeats of NUP98, 37 of which are retained in the fusion protein NUP98–HOXA9; HD, DNA-binding homeodomain; the tryptophan required for NUP98–HOXA9 and HOXA9 interaction with DNA binding partner PBX (Kasper et al., 1999; Schnabel et al., 2000) is represented by the black line N-terminal to the HD; the region of NUP98–HOXA9 corresponding to a peptide used to raise antibodies against the fusion protein is underlined. (B) The MSCV retroviral vector utilized in these studies directs the expression of the gene of interest from the viral LTR, while the selector gene [conferring antibiotic resistance to G418 (Neo) or puromycin (Pac), or inducing green (EGFP) or yellow (EYFP) fluorescence] is expressed from the internal pgk promoter. Restriction sites are shown for EcoRI (E), HindIII (H), KpnI (K) and NheI (N). (C) Western blot analysis of total cell extracts of NUP98–HOXA9-infected (lane NH) or control Rat-1 fibroblasts, probed with antiserum raised against a NUP98–HOXA9 peptide (see A). The positions of the 59 kDa NUP98–HOXA9 protein (arrow) and of size markers are indicated. For (D) and (E), randomly selected, individual colonies derived from freshly infected (EGFP+, as determined by fluorescence microscopy) bone marrow cells grown in semi-solid methylcellulose cultures were isolated, dispersed and replated in secondary cultures. (D) The number of secondary colonies that arose from each replated primary colony is shown for cells infected with the NUP98–HOXA9 and the control EGFP retroviruses. The replating efficiency, the percentage of primary colonies generating secondary colonies, was 88% for NUP98–HOXA9 (69 of 78 primary colonies analyzed, yielding an average of 181 secondary colonies per dish) and 30% for EGFP (20 of 66 colonies analyzed, yielding an average of 32 secondary colonies). Horizontal lines indicate the average number of secondary colonies. These numbers were generated from two independent bone marrow infection experiments. (E) The size of secondary colonies generated by cells expressing NUP98–HOXA9 is much larger than those derived from the control EGFP-expressing cells (indicated by arrow), as can be seen in these macroscopic views of the 3.5 cm methylcellulose culture dishes. Typical examples are shown.
To assess whether the expression of NUP98–HOXA9 in bone marrow cells could induce leukemia in mice, several transplantation experiments were performed. Table I shows the dose of transduced cells that were transplanted per mouse in three independent experiments. At 2 months post-bone marrow transplantation (BMT), NUP98– HOXA9 chimeras had moderately increased numbers of peripheral white blood cells (13 ± 10 versus 3.6 ± 0.7 in control mice, average ± standard deviation × 109/l, n = 4 for both groups), mainly due to neutrophils and monocytes (Figure 2A; and data not shown). There was a marked increase in the size of platelets observed in the peripheral blood of these mice (Figure 2A). To characterize this chronic condition and its evolution, NUP98–HOXA9 mice were sacrificed at 2 and 8 months post-BMT. NUP98–HOXA9 mice sacrificed early (2 months) post-BMT had no overt hemopoietic anomalies, but showed a 2- to 3-fold increase in the numbers of myeloid CFC in the bone marrow and spleen (Table II). In mice analyzed at 8 months post-BMT, the spleen was increased 3-fold in size and contained 30-fold more myeloid CFC than control mice (Table II). The majority of the CFC gave rise to colonies containing granulocytes and/or macrophages (CFU-GM; n = 50 colonies analyzed by cytological studies, data not shown). The bone marrow and spleen of NUP98–HOXA9 mice had fewer erythroblasts (red cell precursors) and lymphocytes (Figure 2A). Myeloid infiltration was not detected in the liver, thymus or lymph nodes of these animals as determined by cytological and FACS analyses (Figure 2A; and data not shown). In summary, NUP98–HOXA9 expression in bone marrow cells induced an MPD in mice, characterized by increased peripheral monocyte and neutrophil numbers, platelet size and spleen CFU-GM, and progressing with time. This differs markedly from the pre-leukemic phenotype observed in Hoxa9 hemopoietic chimeras in which no increased production of mature myeloid cells was observed (Kroon et al., 1998).
Table I. Dose of NUP98–HOXA9-transduced cells transplanted per mouse.
| Virus [number of mice] | ID #, symbola | No. of CFCb transplanted per mouse |
No. of infected LTRCc transplanted per mouse | |
|---|---|---|---|---|
| Total | Transducedd | |||
| NUP98-HOXA9 (Neo) [4] | 1–4, cross | 1800 | 144 | 1 |
| NUP98-HOXA9 (EGFP) [7] | 5–11, cross | 1750 | 350 | 4 |
| NUP98-HOXA9 (EGFP) [5] | 12–16, circle | 31 100 | 19 300 | 193 |
| NUP98-HOXA9 (EGFP) [2] | 17, 18, diamond | 11 400 | 6640 | 66 |
| EGFP-1e [4] | – | 1150 | 259 | 3 |
| EGFP-2 [3] | – | 54 000 | 36 600 | 366 |
| EGFP-3 [5] | – | 22 900 | 8470 | 85 |
aSymbols are used to represent mice from each group in Figure 4C.
bMyeloid colony forming cells, as measured in clonogenic progenitor assays.
cEstimated: reported to be ∼1% of transduced CFC frequency (Sauvageau et al., 1995; Thorsteinsdottir et al., 1999).
dAs determined by resistance to G-418 (Neo viruses), or detection of fluorescence (EGFP viruses) either by FACS or microscopy.
eThe group of EGFP mice that most resembled NUP98–HOXA9 mice with respect to transplanted dose of transduced CFC was used when needed as controls.
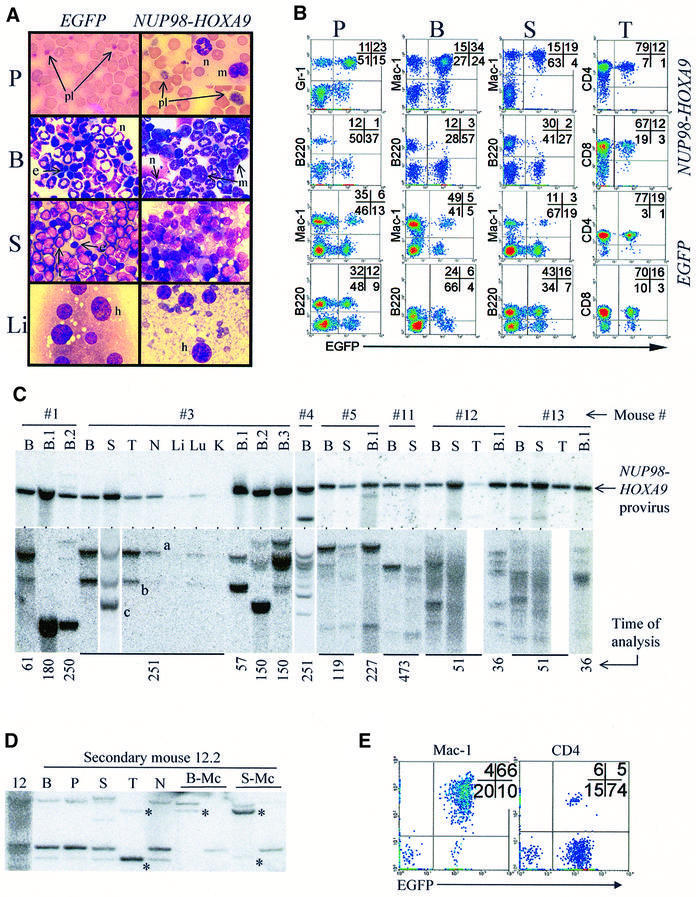
Fig. 2. Characterization of NUP98–HOXA9-induced myeloproliferation in mice. (A) Wright-stained bloodsmear (125×) and cytospin (100×) preparations from representative NUP98–HOXA9 and EGFP control mice. Peripheral blood, P; bone marrow, B; spleen, S; liver, Li; platelets, pl; neutrophils, n; monocytes, m; lymphocytes, l; erythroblasts, e. (B) FACS analyses of hemopoietic organs (peripheral blood, P; bone marrow, B; spleen, S; and thymus, T) of representative NUP98–HOXA9 (#12, see Table I) and EGFP (EGFP-3 group, Table I) control mice, staining for Mac-1, Gr-1, B220, CD4 and CD8. Infected cells are identified by EGFP fluorescence. (C) In NUP98–HOXA9 mice, the provirus is intact (top panel) and the population of NUP98–HOXA9-infected cells is oligoclonal (bottom panel). Top panel: Southern blot analysis assessing the integrity of the provirus shows that the 5.1 kb NUP98–HOXA9-bearing provirus is present and intact in the bone marrow (B) of all mice analyzed, and is also detected in the spleen (S), thymus (T), lymph nodes (N) and lung (Lu), but only weakly so in the liver (Li) and not at all in the kidneys (K). With the exception of one mouse (#4, lower band), no significant amount of rearranged provirus is detected. Bottom panel: Southern blot analysis surveying the integration sites of the proviruses. The time at which the mice were analyzed (in days post-transplantation) is shown at the bottom. For mice 1–4, membranes were hybridized to the Neo probe, and for all other mice the EGFP probe was used. Clones that contribute to myeloid colonies in secondary transplants are totipotent (D and E). (D) Clonal analysis by Southern hybridization of DNA from primary mouse #12 and a secondary recipient (12.2). B, bone marrow; P, peripheral blood; S, spleen; T, thymus; N, lymph nodes; B-Mc and S-Mc, DNA from cells harvested from bone marrow and splenic myeloid colonies grown in methylcellulose cultures, respectively. Asterisks identify totipotent clones by virtue of contribution to myeloid colonies and to reconstitution of the thymus. (E) FACS analysis confirms the contribution of NUP98–HOXA9-expressing (EGFP+) cells to myeloid (Mac-1) and lymphoid (CD4) lineages in the spleen of mouse #12.2. For mouse numbers refer to Table I.
Table II. Progression of MPD in NUP98–HOXA9 hemopoietic chimeras.
| Femur |
Spleen |
||||
|---|---|---|---|---|---|
| NCa × 107 | CFCb × 103 | Size (g) | NCa × 107 | CFCb × 103 | |
| NUP98–HOXA9 | |||||
| Early post-BMTc (n = 3) | 1.6 ± 0.3 | 110 ± 18 | 0.15 ± 0.06 | 10 ± 1 | 19 ± 8 |
| Late post-BMTd (n = 2) | 2.3 ± 0.4 | 64 ± 26 | 0.38 ± 0.08 | 30 ± 5 | 150 ± 10 |
| Secondary BMTe (n = 2) | 4.3 ± 0.4 | 770 ± 170 | 0.37 ± 0.20 | 68 ± 42 | 1100 ± 53 |
| EGFP controlf (n = 3) | 2.1 ± 0.1 | 60 ± 24 | 0.10 ± 0.01 | 13 ± 3 | 5.1 ± 1 |
aNucleated cells.
bMyeloid colony forming cells, as measured in progenitor assays.
cTwo months post-BMT.
dEight months post-BMT.
eTransplanted with 106 BM cells from early post-BMT group, sacrificed at 5 months.
fOne mouse early, and two mice late post-BMT, pooled because identical.
NUP98–HOXA9-transduced cells contribute to repopulation of all lineages, but B-lymphopoiesis is impaired
The contribution of NUP98–HOXA9-transduced cells (EGFP+) to myeloid, B- and T-cell differentiation in vivo was evaluated by FACS analyses (Figure 2B). In accordance with the cytological studies shown in Figure 2A, there was a marked increase in the proportion (and absolute numbers) of myeloid (Gr-1+ or Mac-1+) cells in the peripheral blood and spleen of NUP98–HOXA9 chimeras (Figure 2B). The majority of these Gr-1+ or Mac-1+ cells were transduced (i.e. EGFP+), confirming the contribution of the NUP98–HOXA9-infected cells to myeloid repopulation and splenic infiltration. This increase in myeloid cells in NUP98–HOXA9 mice is consistent with the marked increase observed in myeloid CFC numbers in the spleen (Table II), and in the in vitro proliferation/self-renewal of NUP98–HOXA9 myeloid progenitors (Figure 1D and E).
NUP98–HOXA9-infected cells were also present in the T-lymphoid compartment (CD4+, CD8+) in the thymus, although they were under-represented as compared with EGFP control mice that received a lower dose of infected cells in the BMT inoculum (Figure 2B; Table I). The numbers of NUP98–HOXA9-infected cells were exceptionally low in the B-lymphoid (B220+) compartment in the peripheral blood, bone marrow and spleen (Figure 2B). Consistent with this, transduced (Neo+ or EGFP+) bone marrow pre-B lymphoid progenitors were practically undetectable in NUP98–HOXA9 mice (n = 5 mice, data not shown), indicating that NUP98–HOXA9 expression is not compatible with B-lymphopoiesis. Thus, while the production of cells of the myeloid lineage is greatly enhanced, primitive cells expressing NUP98–HOXA9 can contribute to T-cell but not (or very inefficiently) to B-cell lineages.
The NUP98–HOXA9-induced MPD is a polyclonal stem cell disease
Southern blot analyses performed on genomic DNA isolated from NUP98–HOXA9 mice indicated the presence of the intact provirus in the hemopoietic tissues but the absence of a signal in non-hemopoietic organs (Figure 2C, top panel). Confirming the results of cytological and FACS studies, NUP98–HOXA9-transduced cells did not invade non-hemopoietic organs of mice with MPD.
Clonal analyses showed that during the course of the MPD, multiple different clones contributed to the population of NUP98–HOXA9-infected cells (Figure 2C, bottom panel). Such clones are distinguished by different autoradiographic bands visible at different intensities or in different hemopoietic organs (Figure 2C, bone marrow versus spleen of mouse #3). This poly-clonality becomes apparent for mice (e.g. #12 and #13) that were transplanted with a high BMT cell dose (Table I; Figure 2C). In mice transplanted with as few as 1–4 infected long-term repopulating cells (LTRC, see Table I), a similar number of clones (between 2 and 5) were detected (Figure 2C). The MPD phenotype was observed in mice as late as 251 or 473 days post-transplantation (time of analysis shown in Figure 2C, bottom), when of all the transduced cells transplanted only the LTRC were expected to remain. Most importantly, clones that contributed to the myeloproliferation in the spleen were also detected in the thymus (Figure 2C, compare mouse #3, S versus T), while in none of these mice were myeloid cells detected in the thymus by cytological or FACS analyses (Figure 2B; and data not shown). This suggested that the pool of totipotent LTRC (i.e. stem cells) expressing NUP98–HOXA9 contributed to the MPD phenotype.
To investigate this further, bone marrow cells from NUP98–HOXA9 mice were transplanted into secondary recipients (106 bone marrow cells into lethally irradiated mice). Clonal analyses of secondary recipients revealed that clones which contributed to the myeloproliferative disease (some of which are totipotent, e.g. Figure 2C, mouse #3 clones ‘a’ and ‘b’) in the primary mice repopulated the secondary recipients. These secondary mice also developed MPD (Table II), as indicated by increases in spleen size (3- to 4-fold) and cellularity (2- to 10-fold), CFC numbers (up to 200-fold), and peripheral granulocyte and monocyte counts (not shown). Examples of clonal transmission of the MPD are shown in Figure 2C (see secondary mice B.1 and B.2 of mouse #3, and B.1 of mouse #5). Clonal analysis of the secondary recipients also revealed the presence of clones undetectable in the bone marrow of primary mice. For example, clone ‘c’, which was predominant in the spleen of mouse #3, repopulated the bone marrow of secondary recipient B.2 (Figure 2C). In secondary mice, multiple clones contributed to the myeloid progenitors detected in vitro and at least some of those clones participated in lymphoid and myeloid reconstitution as determined by clonality studies (Figure 2D) and FACS (Figure 2E).
MPD was not observed in mice when myeloid progenitors from freshly infected bone marrow cells (i.e. individual colonies) were expanded in vitro prior to transplantation (2–10 × 106 cells transplanted per mouse, 0/6 mice reconstituted, data not shown), or when bone marrow cells from NUP98–HOXA9 mice with MPD were transplanted into non-irradiated mice (1–4 × 10⁶ cells transplanted per mouse, 1/6 mice reconstituted, data not shown). This indicated that progenitor cells expressing NUP98–HOXA9 were not immortalized per se, and that conditions unfavorable to the maintenance of or marrow reconstitution by stem cells prevented the transplantation of the MPD.
These data indicated that NUP98–HOXA9 induced a chronic MPD, as is observed in some patients (Inaba et al., 1996; Hatano et al., 1999; Wong et al., 1999), and strongly suggested that this disease originated from long-term lympho-myeloid repopulating (i.e. hemopoietic stem) cells.
NUP98–HOXA9-induced MPD progresses into AML
After a latency of at least 4 months, 11 of 14 NUP98–HOXA9 mice succumbed to AML (Figure 3A). The leukemic mice presented with splenomegaly (0.60 ± 0.30 g) and lymphadenopathy (5 mm), and showed infiltration by immature myeloid cells in all organs tested, including peripheral blood, bone marrow, spleen, liver (see Figure 3B), thymus, lungs and kidneys (not shown). FACS analysis indicated that the leukemic cells were predominantly myeloid (Mac-1+, data not shown). Two of five leukemic samples tested did not require hemopoietic growth factors for in vitro maintenance.
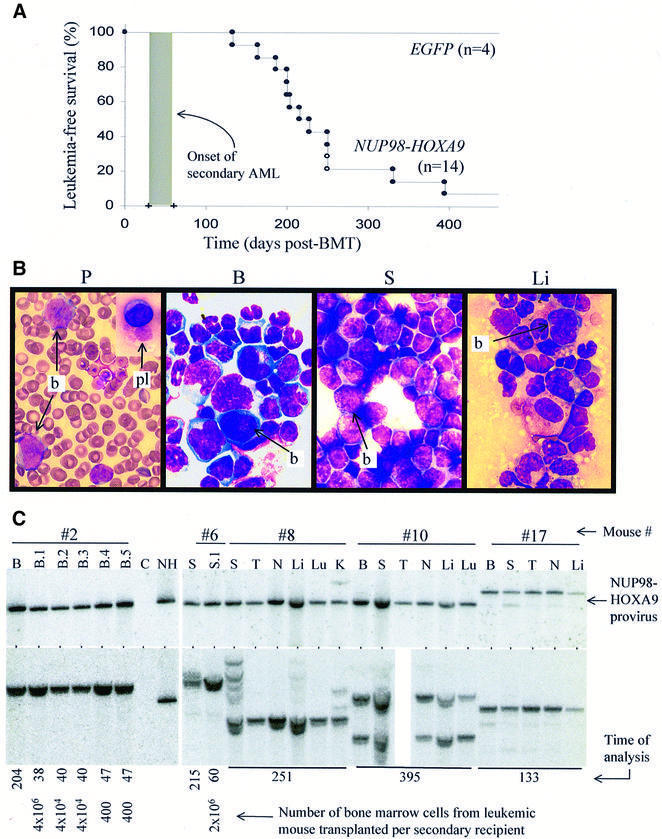
Fig. 3. NUP98–HOXA9 induces AML in mice. (A) Survival curve of NUP98–HOXA9 mice. Of the mice that were not sacrificed early (n = 14), 11 succumbed to AML (closed circles). The remaining three, two of which were sacrificed at 251 days post-BMT (open circles), were shown to have acquired MPD. The shaded box indicates the time at which mice succumb to secondary AML, which ranged from 25 to 60 days depending on the dose of leukemic bone marrow cells transplanted per secondary recipient. (B) Wright-stained cytospin preparations (and bloodsmear) from a representative mouse with NUP98–HOXA9-induced AML show massive infiltration by immature myeloid cells (blasts, b) of the peripheral blood (P), bone marrow (B), spleen (S) and liver (Li). In some mice the persistence of giant platelets in the peripheral blood is seen as well (pl, top inset). All magnifications are 100×. See Figure 2A for normal controls. (C) Leukemic NUP98–HOXA9 cells infiltrate multiple organs and are predominantly monoclonal. Top panel: Southern blot analysis for the integrity of the provirus. The NUP98–HOXA9 provirus is present, and in most mice (except #17) intact, in the genomic DNA of the bone marrow (B), spleen (S), thymus (T), lymph nodes (N), liver (Li), lung (Lu) and kidney (K). Bottom panel: Southern blot analysis for the clonality of the leukemic samples shows that, for the majority, a single NUP98–HOXA9-containing clone is present. For mouse #8, multiple clones can be seen in the spleen, but only the leukemic clone infiltrates organs such as the kidneys (#8, K). B.2 refers to the bone marrow from secondary mouse #2, which received leukemic bone marrow cells from the primary mouse. Lane C, genomic DNA from the bone marrow of a control B6C3 mouse; lane NH, 20 pg of digested plasmid DNA of the NUP98–HOXA9 virus. The time at which animals were analyzed (in days post-BMT) and the number of cells transplanted to secondary recipients are shown at the bottom.
Strong Southern hybridization signals of the NUP98–HOXA9 provirus were detected for each leukemic animal in all organs analyzed, including organs where no signal was detected in mice suffering from the NUP98–HOXA9 MPD (e.g. the liver and kidneys, compare Figures 2C and 3C). This confirmed that the evolution of MPD to AML is also characterized by infiltration of non-hemopoietic organs.
Clonal analysis of the leukemias showed that in contrast to the oligo-poly-clonality of the MPD, the NUP98– HOXA9-induced AML is predominantly mono- or bi-clonal (Figure 3C, bottom panel). While multiple clones persist in the bone marrow or spleen of some animals (Figure 3C, mouse #8), generally the predominant clone has infiltrated other organs (Figure 3C) and is transplanted to secondary recipients (see below). The presence of multiple clones in some of these animals may account for the persistence of some characteristics of the MPD phenotype in these mice, such as large platelets (Figure 3B).
To confirm that these mice had acute leukemia, bone marrow cells from the primary mice were transplanted to non-irradiated secondary recipients. These secondary mice all succumbed to AML in 1–2 months post-transplantation, much faster than the primary animals (see shaded area in Figure 3A). Transplanting as few as 400 bone marrow cells from primary mice could rapidly reconstitute the monoclonal AML in secondary mice, as is shown for mouse #2 in Figure 3C. Consequently, the frequency of the leukemia-repopulating cell (LRC), the cell that can reconstitute the leukemic phenotype when transplanted, exceeded 1 in 400 bone marrow cells. The difference in the latency of the disease between primary and secondary transplants indicated that the expression of NUP98– HOXA9 in bone marrow cells alone was not sufficient to induce leukemic transformation and that an additional (genetic) event(s) was required.
The co-expression of NUP98–HOXA9 and Meis1a accelerated the onset of AML
Hoxa9 expression in murine bone marrow cells has previously been shown to induce AML with a latency of several months and, while Meis1 expression alone does not lead to AML, the co-expression of Hoxa9 and Meis1 is sufficient to acutely transform bone marrow cells (Kroon et al., 1998). To assess whether overexpression of Meis1 could also substitute as a transforming event in NUP98–HOXA9 leukemogenesis, multiple hemopoietic chimeras were generated with bone marrow cells exposed to both NUP98–HOXA9- and Meis1-bearing retroviruses. Table III shows the dose of transduced bone marrow cells that were transplanted per mouse in three independent experiments.
Table III. Generation of Meis1/NUP98–HOXA9 hemopoietic chimeras.
| ID: NM#a (5 mice per group) | Symbolb | No. of infected CFC transplanted per mousec |
|
|---|---|---|---|
| NUP98–HOXA9 | Meis1 + NUP98–HOXA9 | ||
| 1–5 | cross | NDd | ND |
| 6–10 | cross | 340 | 13 |
| 11–15 | circle | 13 900 | 1200 |
| 16–20 | diamond | 5700 | 1400 |
aMice: NM# 1–5, NUP98–HOXA9(Neo) virus; NM# 6–20, NUP98–HOXA9(EGFP); NM# 1–10, Meis1(Pac) virus; NM# 11–20, Meis1(EYFP) virus.
bSymbols are used to represent mice from each group in Figure 4C.
cNot shown are CFC infected with only the Meis1 virus, as these cells are not leukemogenic.
dNot determined.
Two months post-transplantation, three Meis1/NUP98–HOXA9 mice were sacrificed and shown to have acquired MPD similar to the NUP98–HOXA9 mice described above (data not shown). The contribution to the MPD of cells infected with NUP98–HOXA9 versus both NUP98–HOXA9 and Meis1 was similar to that present in the initial BMT inoculum shown in Table III, as determined by FACS (Figure 4A) and myeloid progenitor assays (data not shown). Thus, the overexpression of Meis1 did not appear to alter the MPD induced by NUP98–HOXA9.

Fig. 4. Meis1 accelerates the transformation of NUP98–HOXA9-induced MPD into AML. (A) The contribution of cells infected with NUP98–HOXA9 (EGFP+) versus Meis1 and NUP98–HOXA9 (EYFP+/EGFP+) in mice with MPD is similar to the input BMT inoculum. Shown is a FACS profile of splenic cells from mouse NM# 16. In the BMT inoculum, 20% of NUP98–HOXA9-infected cells also contained the Meis1 provirus (see Table III), while in the spleen of this mouse 30% of the EGFP+ cells are also EYFP+. The lack of single EYFP+ (Meis1-infected) cells indicates that only NUP98–HOXA9-expressing cells contribute to the MPD. (B) Comparison of immature myeloid cells in the bone marrow of leukemic NUP98–HOXA9 versus Meis1/NUP98–HOXA9 mice. (C) Time of onset of AML is shown for mice that were transplanted with bone marrow cells infected with NUP98–HOXA9 (AML onset 230 ± 67 days post-BMT), Meis1 plus NUP98–HOXA9 (142 ± 52 days), Hoxa9 (BMT dose, 700 transduced CFC per mouse, AML onset 128 ± 15 days) and Meis1 plus Hoxa9 (100 doubly transduced CFC per mouse, AML onset 57 ± 6 days). The three mice in the Meis1/NUP98–HOXA9 group whose leukemic cells lacked the Meis1 provirus (see D) are indicated by slightly raised symbols. Symbols refer to different groups of mice, see Tables I and III. Note that despite the low BMT doses, AML in Meis1/Hoxa9 mice develop more rapidly than in Meis1/NUP98–HOXA9 mice. (D) Southern blot analyses of genomic DNA from the bone marrow of leukemic Meis1/NUP98–HOXA9 mice shows the presence of the NUP98–HOXA9 provirus in all samples (lanes are numbered according to mouse numbers in Table III), while the Meis1 provirus is detected in all mice except NM# 5, 9 and 15. DNA from secondary transplants were loaded in lanes 16.1, 16.2, 20.1 and 20.2. For mice NM# 1–10, the NUP98–HOXA9 provirus was detected with the Neo (1–5) or the EGFP (6–10) probes, while the Meis1 provirus was detected with the Pac probe. For mice NM# 11–20, the EGFP probe was used to detect both proviruses. Lane C, DNA from a B6C3 control mouse; 20 pg of digested plasmid DNA of the NUP98–HOXA9 and Meis1 viral vectors were loaded in lanes NH and M, respectively.
After a latency of several months, Meis1/NUP98– HOXA9 chimeras succumbed to AML of a similar phenotype as observed in the NUP98–HOXA9 mice (Figure 4B; and data not shown). The AML in Meis1/NUP98–HOXA9 mice was also readily transplanted to secondary recipients (9/9 tested) and as few as 100 leukemic bone marrow cells were sufficient to rapidly reproduce AML in secondary recipients. The time required for AML to develop in secondary recipients was between 26 and 58 days post-transplantation, depending on the transplanted cell dose (ranging from 1 × 10⁶ to 100, respectively). These data and the time at which each primary mouse acquired AML are summarized in Figure 4C. Also shown is the time of AML onset in Hoxa9 and Meis1/Hoxa9 chimeras, which were created as control groups for these experiments. As previously reported (Kroon et al., 1998), all Hoxa9 mice survived well after all Meis1/Hoxa9 mice had died of AML (Figure 4C). Although less dramatic, a significant difference (p <0.004) is also seen between the onset of AML in NUP98–HOXA9 mice (230 ± 67 days post-BMT) and Meis1/NUP98–HOXA9 mice (142 ± 52 days). In contrast to Meis1/Hoxa9-induced AML in primary and secondary recipients, most of the primary AML in Meis1/NUP98–HOXA9 mice required longer to develop than the secondary AML (Figure 4C). Thus, while co-expression of Meis1 can significantly shorten the latency of NUP98–HOXA9-induced AML, it is not sufficient to acutely transform bone marrow cells.
Results from Southern blot analyses performed on bone marrow cells isolated from leukemic Meis1/NUP98– HOXA9 mice provided further evidence for a genetic interaction between Meis1 and NUP98–HOXA9. In the cells of 13 of 16 leukemic mice, both proviruses were present, while in the remaining three only NUP98–HOXA9 was detected (Figure 4D). In the original BMT inoculum, only 4–25% of the NUP98–HOXA9-transduced cells also contained the Meis1 provirus (Table III), whereas the majority of leukemic clones contained both proviruses (Figure 4D). In secondary recipients of bone marrow cells from these (double positive) mice, both proviruses were also detected (total of 26 secondary mice analyzed, Figure 4D; and data not shown), indicating that Meis1/NUP98–HOXA9-infected cells were indeed responsible for the AML.
Together these data showed that while Meis1 did not appear to alter the myeloproliferative effect of NUP98–HOXA9, the progression from MPD to AML was accelerated. In contrast to Hoxa9, however, bone marrow cells co-expressing NUP98–HOXA9 and Meis1 were not acutely transformed, as the development of AML in primary mice lagged behind that in secondary mice. Thus, the expression of Meis1 alone does not lead to the acute transformation of NUP98–HOXA9-expressing cells. This suggested that the N-terminal portion of HOXA9 is required for rapid leukemogenic collaboration with Meis1. The fusion protein has lost this portion of HOXA9 (altering the results of collaboration with Meis1), but has the capacity to induce MPD, which is not observed in Hoxa9 mice (Kroon et al., 1998) and may potentially be supplied by the NUP98 portion of the fusion protein.
Hoxa9ΔN does not induce a disease in mice
To address these issues, a deletion mutant of Hoxa9 corresponding to the portion present in the fusion protein was created. Although the murine Hoxa9 was used, it is 99% identical to the human HOXA9 protein within the 107 C-terminal amino acids remaining in Hoxa9ΔN. Figure 5A shows a schematic representation of Hoxa9ΔN, and that efficient expression of the truncated protein was obtained in cells infected with the Hoxa9ΔN virus.
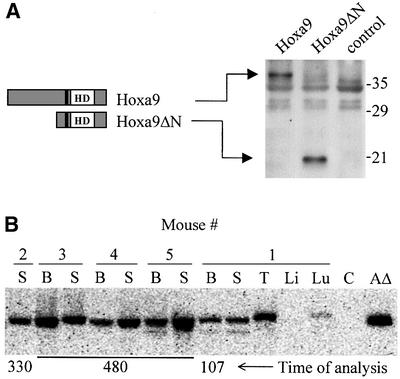
Fig. 5. Hoxa9ΔN chimeras are reconstituted with transduced cells. Schematic representations of Hoxa9 and Hoxa9ΔN and the demonstration that the recombinant retroviruses direct the expression of the appropriate proteins in infected cells (A), and that Hoxa9ΔN chimeras are reconstituted by cells containing the Hoxa9ΔN provirus (B). (A) Western blot analysis of total cell extracts of Hoxa9-, Hoxa9ΔN-expressing and control GP+E-86 viral producer cells, probed with antiserum raised against a NUP98–HOXA9 peptide (see Figure 1A). HD, DNA-binding homeodomain; the tryptophan required for Hoxa9 interaction with its PBX DNA-binding partners (Schnabel et al., 2000) is represented by the black line N-terminal to the HD, and is retained in Hoxa9ΔN, which consists of the C-terminal 107 amino acids of Hoxa9. (B) Southern blot analysis shows the presence of the Hoxa9ΔN provirus in hemopoietic organs (bone marrow, B; spleen, S; thymus, T; liver, Li; lung, Lu). Lane C, DNA from B6C3 mouse; lane AΔ, 20 pg of digested plasmid DNA of the Hoxa9ΔN viral vector.
To assess the importance of the NUP98 portion with respect to the induction of MPD and AML by NUP98–HOXA9, five Hoxa9ΔN chimeras were generated (transplantation dose: 1730 CFC per mouse, ∼20% infected). These mice were shown to be reconstituted with transduced bone marrow cells, as determined by the presence of G-418 resistant CFC in the bone marrow and spleen (30–60% of total CFC), and by Southern blot analysis (Figure 5B). None of the mice showed any signs of hemopoietic anomalies for up to 16 months post-transplantation (spleen size normal, CFC numbers within normal range, data not shown). Similarly, Meis1/Hoxa9ΔN chimeras do not acquire any hemopoietic disease (data not shown). These results indicated that the N-terminal portion of Hoxa9 plays an important role in leukemogenesis and collaboration with Meis1. Replacing it with a portion of NUP98 results in a fusion protein with the capacity to induce MPD and partial collaboration with Meis1 to induce AML.
Discussion
The t(7;11)(p15;p15) translocation that results in the expression of the NUP98–HOXA9 fusion gene is predominantly observed in patients with AML M2 and occasionally M4 French-American-British sub-types (Borrow et al., 1996; Nakamura et al., 1996a), trilineage MDS (Inaba et al., 1996; Hatano et al., 1999) and chronic myelomonocytic leukemia (Hatano et al., 1999; Wong et al., 1999). The retrovirally directed expression of NUP98–HOXA9 in murine bone marrow cells resulted in enhanced proliferation of myeloid progenitor cells in vitro and in their expansion in vivo, inducing an MPD in mice. After a period of several months, during which the hemopoietic stem cell-derived MPD progressed, bone marrow cells expressing NUP98–HOXA9 fully transformed to induce AML. The transformation from NUP98–HOXA9-induced MPD into AML is accelerated by the co-expression of Meis1. The NUP98 moiety of the fusion protein appears to be critical in the development of the MPD, converting a clinically silent pre-leukemic phase observed in Hoxa9 mice into an MPD in NUP98–HOXA9 mice. Comparison of bone marrow cells expressing Hoxa9 versus NUP98–HOXA9 suggest that the proliferative effect on myeloid progenitors is greater for NUP98–HOXA9, while the capacity to induce AML is superior for Hoxa9, thus potentially indicating that proliferation and transformation proceed independently.
Molecular and cellular bases for NUP98–HOXA9-induced leukemic transformation
A trimeric, Meis1- and Pbx2-containing complex has been proposed as a model for leukemic transformation induced by Hoxa9 (Schnabel et al., 2000). Studies by Kasper et al. (1999) showed that NUP98–HOXA9 can form a cooperative DNA-binding complex with PBX1 and that this interaction is required for the transformation of fibroblasts. We have also reported that certain Hox genes collaborate with Pbx1 in transforming Rat-1 fibroblast (Krosl et al., 1998). In contrast to Hox-induced transformation of fibroblasts, several studies indicate that Hox proteins function in the absence of interaction with PBX to immortalize or transform primary hemopoietic cells. Key findings to support this include: (i) the in vitro immortalization of myeloid progenitor cells by tryptophan mutants of Hoxa9 (i.e. in which interaction with PBX is abrogated) (Calvo et al., 2000); (ii) the in vivo expansion of hemopoietic stem cells by a similarly mutated Hoxb4 protein incapable of interaction with PBX (Beslu et al., 2000); and, most relevant to this paper, (iii) the capacity of the NUP98–HOXD13 fusion protein [the product of the t(2;11)(q31;p15) translocation, which occasionally occurs in human leukemias] to induce transformation of bone marrow cells (Raza-Egilmez et al., 1998; Buske et al., 2000). The HOX family members from paralogs 11–13, including HOXD13, lack a PBX-interaction motif N-terminal to the homeodomain, which is critical for cooperative DNA-binding with PBX proteins (Knoepfler et al., 1995; Piper et al., 1999). HOXD13 is, therefore, amongst the HOX proteins that fail to engage in cooperative DNA binding with PBX (Shen et al., 1997).
Together these findings suggest that transformation of primary bone marrow cells by NUP98–HOXA9 may not be dependent on interaction with PBX. This issue was directly addressed by the generation of a mutant NUP98–HOXA9 protein containing a tryptophan to glycine mutation previously shown to abrogate PBX interaction (Kasper et al., 1999; Schnabel et al., 2000). This mutant was comparable to NUP98–HOXA9 in its capacity to dramatically enhance the proliferative capacity of primary bone marrow progenitors (E.Kroon, unpublished observations). Together these data strongly suggest that cooperative DNA binding between NUP98–HOXA9 and PBX proteins does not represent the biochemical basis for transformation of primary bone marrow cells.
The apparent lack of biochemical interaction between NUP98–HOXA9 and PBX proteins in the transformation of hemopoietic cells does not rule out a role for PBX, specifically in the collaboration between Meis1 and NUP98–HOXA9. Members of the Meis family, including Meis1 (Rieckhof et al., 1997) and Prep1 (Berthelsen et al., 1999), can regulate the nuclear localization of PBX proteins. However, this activity does not appear to be sufficient for collaboration with HOX proteins in leukemogenesis, since we failed to see a genetic interaction between Hoxa9 and Prep1 (Thorsteinsdottir et al., 2001), or between NUP98–HOXA9 and Prep1 (E.Kroon, unpublished observations) in hemopoietic chimeras.
Unlike Hoxa9, NUP98–HOXA9 appears to have a strong transcriptional activating potential mediated through the interaction with CBP/p300 (Kasper et al., 1999). Both CBP and p300 have been implicated in leukemogenesis as MLL fusion proteins (Ida et al., 1997; Rowley et al., 1997; Taki et al., 1997) and through direct interaction with AML1 (Kitabayashi et al., 1998). Despite this, our results suggest that the potential of Hoxa9 to induce AML is superior to that of NUP98–HOXA9 (in the presence or absence of Meis1 expression, Figure 4C). More recently, a transcriptionally active domain in the N-terminal portion of Hoxa9 (deleted in NUP98–HOXA9) was identified and appears necessary for in vitro immortalization of hemopoietic cells (Schnabel et al., 2000). Thus, distinct transcriptionally active domains in Hoxa9 and NUP98–HOXA9 are required for their transforming potential in vitro, and this may contribute to the different phenotypes observed in Hoxa9 versus NUP98–HOXA9 chimeric mice.
Important differences were observed between Hoxa9 and NUP98–HOXA9 hemopoietic chimeras in both the pre-leukemic phenotype (i.e. chronic disease for NUP98–HOXA9, none observed for Hoxa9) and in the time required for the onset of the primary AML (faster for Hoxa9 in the presence or absence of Meis1 expression, see Figure 4C). These differences may also suggest that distinct cell types participated in the leukemic process induced by these two molecules. It could be argued that NUP98–HOXA9 has a more profound effect on mature progenitors (detected by in vitro assays), while Hoxa9 affects more primitive bone marrow cells (U.Thorsteinsdottir, unpublished data). Regardless of the underlying molecular reasons for different cell types being affected, it is tempting to speculate that this could in part be responsible for the differences observed in the latency prior to AML onset. In other words, the number of additional transforming events required to achieve acute leukemia (or the probability that such events take place) may depend on the target cell. Alternatively, Hoxa9 may have a larger repertoire of potential collaborating events than NUP98–HOXA9, a possibility we are currently investigating.
In summary, the studies detailed here document common as well as distinct characteristics of a chimeric (NUP98–HOXA9) and a native (Hoxa9) protein when expressed in bone marrow cells of mice. While the fusion protein is less potent in acute leukemogenesis and has the unique capacity to induce a chronic disease, both share a common leukemogenic collaborator, Meis1.
Materials and methods
Animals
Bone marrow donor PepC3 (C57BL/6Ly-Pep3b × C3H/HeJ, F1) and recipient B6C3 (C57BL/6J × C3H/HeJ, F1) mice were housed in ventilated micro-isolator cages and provided with sterilized food and acidified water.
Recombinant retroviral vectors
The cDNA of NUP98–HOXA9 (Nakamura et al., 1996a) was introduced into the EcoRI site of retroviral vectors MSCV/pgk/NeoEB (No. 619) (Hawley et al., 1994) or MSCV/pgk/EGFP (No. 662) (a gift from K.Humphries, Terry Fox Laboratory, Vancouver, BC, Canada). The recombinant retroviruses directing the expression of Hoxa9 (No. 412) and Meis1a (No. 515) were previously described (Kroon et al., 1998). The MSCV/pgk/EYFP vector (No. 721) was constructed by replacing the NcoI–ClaI fragment of MSCV/pgk/EGFP (No. 652) with the NcoI–ClaI EYFP cDNA fragment obtained from pN1-EYFP (Clontech). MSCV/Meis1a/pgk/EYFP (No. 722) was created by introducing the Meis1a (Moskow et al., 1995) cDNA fragment into the EcoRI site of MSCV/pgk/EYFP. Hoxa9ΔN was generated by PCR, sequenced and introduced into the HpaI site of MSCV/pgk/NeoEB (No. 464). The W→G mutation of Hoxa9 was PCR generated and sequenced, and the fragment downstream of the ClaI site was used to replace the corresponding region of NUP98–HOXA9 to create NUP98–HOXA9(W→G) in MSCV/pgk/EGFP (No. 1090) and MSCV/pgk/EYFP (No. 1087).
Viral producer cell lines and infection of bone marrow cells
High-titer, helper-free GP+E-86 (Markowitz et al., 1988) producer cells were generated by infection with viral supernatant obtained from VSV-G cells (Ory et al., 1996) and maintained as described (Sauvageau et al., 1995; Kroon et al., 1998). Bone marrow cells were harvested, pre-stimulated, infected through co-cultivation with GP+E-86 cells, recovered, and injected intravenously into lethally irradiated recipients as described (Sauvageau et al., 1995; Kroon et al., 1998). Gene transfer efficiencies were determined by flow cytometry and/or clonogenic progenitor assays (Sauvageau et al., 1995; Kroon et al., 1998).
In vitro clonogenic progenitor assays
For myeloid clonogenic progenitor assays, cells were plated in 35 mm petri dishes in a 1.1 ml culture mixture containing 1% methylcellulose in alpha medium supplemented with 10% fetal calf serum (FCS), 5.7% bovine serum albumin (BSA), 5 × 10⁻⁵ M β-mercaptoethanol, 1 U/ml human urinary erythropoietin (Epo), 10% WEHI-3B-conditioned medium, 2 mM glutamine, 200 µg/ml transferrin, in the presence or absence of 1.3 mg/ml G418 and/or 1.3 µg/ml puromycin. Bone marrow cells harvested from the co-cultivation with viral producer cells were plated at a concentration of 1–5 × 10³ cells/ml, while bone marrow or spleen cells recovered from reconstituted animals were plated at 2–5 × 10⁴ cells/ml and 2–100 × 104 cells/ml, respectively, and scored on day 12. For pre-B-lymphoid clonogenic progenitor assays, 105 bone marrow cells were plated in 1% methylcellulose in alpha medium supplemented with 30% FCS, 10–4 M β-mercaptoethanol, 2 mM glutamine, 0.2 ng/ml IL-7, in the presence or absence of 1.3 mg/ml G418, and scored on day 8.
DNA and RNA analyses
Southern blot analyses were performed as described previously (Sauvageau et al., 1995; Kroon et al., 1998). Briefly, to assess the integrity of the provirus, high-molecular weight genomic DNA was prepared with the DNAzol reagent (Gibco-BRL) and 10 µg digested with KpnI or NheI, which cleave in the LTRs, thus releasing identical fragments for all proviruses unless rearrangement occurred. The expression of the integrated provirus was always confirmed through northern blot analysis (Sauvageau et al., 1995; Kroon et al., 1998). To survey for proviral integration sites (revealing the clonality of the sample), the DNA was digested with EcoRI, which cleaves within the provirus to release a unique DNA fragment for each proviral integration site. 32P probes of EGFP (NcoI–ClaI fragment of MSCV/pgk/EGFP), Neo (Sauvageau et al., 1995; Kroon et al., 1998), Pac (Sauvageau et al., 1995; Kroon et al., 1998) and NUP98–HOXA9 (3′ HindIII fragment, see Figure 1) were generated using standard techniques.
Flow cytometry
For FACS analyses, cells from the peripheral blood, bone marrow, spleen and thymus were incubated with phycoerythrin-(PE) or biotin-conjugated monoclonal antibodies. The following antibodies were used: anti-Mac-1(CD11b)-biotin, anti-B220(CD45R)-PE, anti-CD4-biotin (all from Pharmingen, San Diego, CA) and anti-CD-8-PE (Gibco-BRL Life Technologies).
Protein analysis
Preparation of cellular extracts of transduced Rat-1 fibroblasts or GP+E-86 cells and western analysis were performed as described (Krosl et al., 1998). Briefly, 30 µg of proteins were separated by 10% SDS–PAGE, transferred to Immobilon P membranes (Millipore, Bedford, MA), and then probed with polyclonal rabbit NUP98–HOXA9 antiserum (see Figure 1). Bound antibodies were detected with horseradish peroxidase-conjugated anti-rabbit antibody (Sigma, St Louis, MO) followed by enhanced chemiluminescence (ECL; Amersham, Buckinghamshire, UK).
Acknowledgments
Acknowledgements
This work was supported by grants from the National Cancer Institute of Canada and the US National Institute of Health. The authors acknowledge Drs Alex Hendrick and Angela Wood for advice and critical review of this manuscript; Mrs Marie-Eve Leroux and Mr Stephan Matte for their expertise and help regarding maintenance and manipulation of mice; Mrs Nathalie Tessier for her assistance with flow cytometry; and Mr Soheyl Baban for the generation of Hoxa9ΔN. E.K. and U.T. are Fellows of the Leukemia & Lymphoma Society of America and the Leukemia Research Fund of Canada, respectively, and G.S. is a Clinician-Scientist Scholar of the Medical Research Council of Canada.
REFERENCES
- Arai Y., Hosoda,F., Kobayashi,H., Arai,K., Hayashi,Y., Kamada,N., Kaneko,Y. and Ohki,M. (1997) The inv(11)(p15q22) chromosome translocation of de novo and therapy-related myeloid malignancies results in fusion of the nucleoporin gene, NUP98, with the putative RNA helicase gene, DDX10. Blood, 89, 3936–3944. [PubMed] [Google Scholar]
- Berthelsen J., Kilstrup-Nielsen,C., Blasi,F., Mavilio,F. and Zappavigna,V. (1999) The subcellular localization of PBX1 and EXD proteins depends on nuclear import and export signals and is modulated by association with PREP1 and HTH. Genes Dev., 13, 946–953. [DOI] [PMC free article] [PubMed] [Google Scholar]
- Beslu N., Krosl,J., Girard,S., Mayotte,N., Antonchuk,J., Humphries,K. and Sauvageau,G. (2000) The N-terminal amino acids 31–100 and the homeodomain delineate regions of HOXB4 involved in hemopoietic stem cell expansion. Blood, 96, 496. [Google Scholar]
- Borrow J. et al. (1996) The t(7;11)(p15;p15) translocation in acute myeloid leukaemia fuses the genes for nucleoporin NUP98 and class I homeoprotein HOXA9. Nature Genet., 12, 159–167. [DOI] [PubMed] [Google Scholar]
- Buske C., Pineault,N., Feuring-Buske,M., Aplan,P. and Humphries,R.K. (2000) Collaboration of Meis1 with the human leukemia-specific fusion gene NUP98–HOXD13 causes Acute Myeloid Leukemia (AML) in mice: a model of NUP98-associated human leukemia. Blood, 96, 573. [DOI] [PubMed] [Google Scholar]
- Calvo K.R., Sykes,D.B., Pasillas,M. and Kamps,M.P. (2000) Hoxa9 immortalizes a granulocyte-macrophage colony-stimulating factor-dependent promyelocyte capable of biphenotypic differentiation to neutrophils or macrophages, independent of enforced Meis expression. Mol. Cell. Biol., 20, 3274–3285. [DOI] [PMC free article] [PubMed] [Google Scholar]
- Chang C.P., Shen,W.F., Rozenfeld,S., Lawrence,H.J., Largman,C. and Cleary,M.L. (1995) Pbx proteins display hexapeptide-dependent cooperative DNA binding with a subset of Hox proteins. Genes Dev., 9, 663–674. [DOI] [PubMed] [Google Scholar]
- Chang C.P., Jacobs,Y., Nakamura,T., Jenkins,N.A., Copeland,N.G. and Cleary,M.L. (1997) Meis proteins are major in vivo DNA binding partners for wild-type but not chimeric Pbx proteins. Mol. Cell. Biol., 17, 5679–5687. [DOI] [PMC free article] [PubMed] [Google Scholar]
- Golub T.R. et al. (1999) Molecular classification of cancer: class discovery and class prediction by gene expression monitoring. Science, 286, 531–537. [DOI] [PubMed] [Google Scholar]
- Hatano Y., Miura,I., Nakamura,T., Yamazaki,Y., Takahashi,N. and Miura,A.B. (1999) Molecular heterogeneity of the NUP98/HOXA9 fusion transcript in myelodysplastic syndromes associated with t(7;11)(p15;p15). Br. J. Haematol., 107, 600–604. [DOI] [PubMed] [Google Scholar]
- Hawley R.G., Fong,A., Lu,M. and Hawley,T.S. (1994) The HOX11 homeobox-containing gene of human leukemia immortalizes murine hematopoietic precursors. Oncogene, 9, 1–12. [PubMed] [Google Scholar]
- Ida K., Kitabayashi,I., Taki,T., Taniwaki,M., Noro,K., Yamamoto,M., Ohki,M. and Hayashi,Y. (1997) Adenoviral E1A-associated protein p300 is involved in acute myeloid leukemia with t(11;22)(q23;q13). Blood, 90, 4699–4704. [PubMed] [Google Scholar]
- Ikeda T., Ikeda,K., Sasaki,K., Kawakami,K. and Takahara,J. (1999) The inv(11)(p15q22) chromosome translocation of therapy-related myelodysplasia with NUP98–DDX10 and DDX10–NUP98 fusion transcripts. Int. J. Hematol., 69, 160–164. [PubMed] [Google Scholar]
- Inaba T. et al. (1996) t(7;11) and trilineage myelodysplasia in acute myelomonocytic leukemia. Cancer Genet. Cytogenet., 86, 72–75. [DOI] [PubMed] [Google Scholar]
- Kasper L.H., Brindle,P.K., Schnabel,C.A., Pritchard,C.E., Cleary,M.L. and van Deursen,J.M. (1999) CREB binding protein interacts with nucleoporin-specific FG repeats that activate transcription and mediate NUP98–HOXA9 oncogenicity. Mol. Cell. Biol., 19, 764–776. [DOI] [PMC free article] [PubMed] [Google Scholar]
- Kitabayashi I., Yokoyama,A., Shimizu,K. and Ohki,M. (1998) Interaction and functional cooperation of the leukemia-associated factors AML1 and p300 in myeloid cell differentiation. EMBO J., 17, 2994–3004. [DOI] [PMC free article] [PubMed] [Google Scholar]
- Knoepfler P.S. and Kamps,M.P. (1995) The pentapeptide motif of Hox proteins is required for cooperative DNA binding with Pbx1, physically contacts Pbx1, and enhances DNA binding by Pbx1. Mol. Cell. Biol., 15, 5811–5819. [DOI] [PMC free article] [PubMed] [Google Scholar]
- Kroon E., Krosl,J., Thorsteinsdottir,U., Baban,S., Buchberg,A.M. and Sauvageau,G. (1998) Hoxa9 transforms primary bone marrow cells through specific collaboration with Meis1a but not Pbx1b. EMBO J., 17, 3714–3725. [DOI] [PMC free article] [PubMed] [Google Scholar]
- Krosl J., Baban,S., Krosl,G., Rozenfeld,S., Largman,C. and Sauvageau,G. (1998) Cellular proliferation and transformation induced by HOXB4 and HOXB3 proteins involves cooperation with PBX1. Oncogene, 16, 3403–3412. [DOI] [PubMed] [Google Scholar]
- Markowitz D., Goff,S. and Bank,A. (1988) A safe packaging line for gene transfer: separating viral genes on two different plasmids. J. Virol., 62, 1120–1124. [DOI] [PMC free article] [PubMed] [Google Scholar]
- Moskow J.J., Bullrich,F., Huebner,K., Daar,I.O. and Buchberg,A.M. (1995) Meis1, a PBX1-related homeobox gene involved in myeloid leukemia in BXH-2 mice. Mol. Cell. Biol., 15, 5434–5443. [DOI] [PMC free article] [PubMed] [Google Scholar]
- Nakamura T. et al. (1996a) Fusion of the nucleoporin gene NUP98 to HOXA9 by the chromosome translocation t(7;11)(p15;p15) in human myeloid leukaemia. Nature Genet., 12, 154–158. [DOI] [PubMed] [Google Scholar]
- Nakamura T., Largaespada,D.A., Shaughnessy,J.D., Jenkins,N.A. and Copeland,N.G. (1996b) Cooperative activation of Hoxa and Pbx1-related genes in murine myeloid leukaemias. Nature Genet., 12, 149–153. [DOI] [PubMed] [Google Scholar]
- Nakamura T., Yamazaki,Y., Hatano,Y. and Miura,I. (1999) NUP98 is fused to PMX1 homeobox gene in human acute myelogenous leukemia with chromosome translocation t(1;11)(q23;p15). Blood, 94, 741–747. [PubMed] [Google Scholar]
- Nishiyama M. et al. (1999) 11p15 translocations involving the NUP98 gene in childhood therapy-related acute myeloid leukemia/myelodysplastic syndrome. Genes Chromosomes Cancer, 26, 215–220. [PubMed] [Google Scholar]
- Ory D., Neugeborne,B.A. and Mulligan,R.C. (1996) A stable human-derived packaging cell line for production of high titer retrovirus/vesicular stomatitis virus G pseudotypes. Proc. Natl Acad. Sci. USA, 93, 11400–11406. [DOI] [PMC free article] [PubMed] [Google Scholar]
- Phelan M.L., Rambaldi,I. and Featherstone,M.S. (1995) Cooperative interaction between HOX and PBX proteins mediated by a conserved peptide motif. Mol. Cell. Biol., 15, 3989–3997. [DOI] [PMC free article] [PubMed] [Google Scholar]
- Piper D.E., Batchelor,A.H., Chang,C.P., Cleary,M.L. and Wolberger,C. (1999) Structure of a HoxB1–Pbx1 heterodimer bound to DNA: role of the hexapeptide and a fourth homeodomain helix in complex formation. Cell, 96, 587–597. [DOI] [PubMed] [Google Scholar]
- Raza-Egilmez S.Z., Jani-Sait,S.N., Grossi,M., Higgins,M.J., Shows,T.B. and Aplan,P.D. (1998) NUP98–HOXD13 gene fusion in therapy-related acute myelogenous leukemia. Cancer Res., 58, 4269–4273. [PubMed] [Google Scholar]
- Rieckhof G.E., Casares,F., Don Ryoo,H., Abu-Shaar,M. and Mann,R.S. (1997) Nuclear translocation of extradenticle requires homothorax, which encodes an extradenticle-related homeodomain protein. Cell, 91, 171–183. [DOI] [PubMed] [Google Scholar]
- Rowley J.D. et al. (1997) All patients with the t(11;16)(q23;p13.3) that involves MLL and CBP have treatment-related hematologic disorders. Blood, 90, 535–541. [PubMed] [Google Scholar]
- Sauvageau G., Thorsteinsdottir,U., Eaves,C.J., Lawrence,H.J., Largman,C., Lansdorp,P.M. and Humphries,R.K. (1995) Overexpression of HOXB4 in hematopoietic cells causes the selective expansion of more primitive populations in vitro and in vivo. Genes Dev., 9, 1753–1765. [DOI] [PubMed] [Google Scholar]
- Schnabel C.A., Jacobs,Y. and Cleary,M.L. (2000) HoxA9-mediated immortalization of myeloid progenitors requires functional interactions with TALE cofactors Pbx and Meis. Oncogene, 19, 608–616. [DOI] [PubMed] [Google Scholar]
- Shen W.F., Rozenfeld,S., Lawrence,H.J. and Largman,C. (1997) The Abd-B-like Hox homeodomain proteins can be subdivided by the ability to form complexes with Pbx1a on a novel DNA target. J. Biol. Chem., 272, 8198–8206. [DOI] [PubMed] [Google Scholar]
- Shen W.F., Rozenfeld,S., Kwong,A., Kom ves,L.G., Lawrence,H.J. and Largman,C. (1999) HOXA9 forms triple complexes with PBX2 and MEIS1 in myeloid cells. Mol. Cell. Biol., 19, 3051–3061. [DOI] [PMC free article] [PubMed] [Google Scholar]
- Taki T., Sako,M., Tsuchida,M. and Hayashi,Y. (1997) The t(11;16)(q23;p13) translocation in myelodysplastic syndrome fuses the MLL gene to the CBP gene. Blood, 89, 3945–3950. [PubMed] [Google Scholar]
- Thorsteinsdottir U., Sauvageau,G. and Humphries,R.K. (1999) Enhanced in vivo regenerative potential of HOXB4-transduced hematopoietic stem cells with regulation of their pool size. Blood, 94, 2605–2612. [PubMed] [Google Scholar]
- Thorsteinsdottir U., Kroon,E., Jerome,L., Blasi,F. and Sauvageau,G. (2001) Defining Roles for HOX and Meis1 genes in the induction of Acute Myeloid Leukemia. Mol. Cell. Biol., 21, 224–234. [DOI] [PMC free article] [PubMed] [Google Scholar]
- Wong K.F., So,C.C. and Kwong,Y.L. (1999) Chronic myelomonocytic leukemia with t(7;11)(p15;p15) and NUP98/HOXA9 fusion. Cancer Genet. Cytogenet., 115, 70–72. [DOI] [PubMed] [Google Scholar]