Abstract
Restriction of long-distance movement of tobacco etch virus (TEV) in Arabidopsis ecotype Col-0 plants requires the function of at least three genes: RTM1 (restricted TEV movement 1), RTM2, and RTM3. The mechanism of TEV movement restriction remains poorly understood, although it does not involve a hypersensitive response or systemic acquired resistance. A functional characterization of RTM1 and RTM2 was done. The RTM1 protein was found to be soluble with the potential to form self-interacting complexes. The regulatory regions of both the RTM1 and RTM2 genes were analyzed using reporter constructs. The regulatory sequences from both genes directed expression of β-glucuronidase exclusively in phloem-associated cells. Translational fusion proteins containing the green fluorescent protein and RTM1 or RTM2 localized to sieve elements when expressed from their native regulatory sequences. Thus, components of the RTM system may function within phloem, and sieve elements in particular, to restrict TEV long-distance movement.
Virus infection of plants is a multiple-step process requiring compatible interactions between host- and virus-encoded factors during genome expression, cell-to-cell movement via plasmodesmata, and long-distance movement through the vascular system (Carrington et al., 1996). Restricted infection may result if cellular factors required by the virus are lacking or incompatible with the virus or if the host responds to the virus and activates a defense response.
Arabidopsis ecotypes vary in their ability to support systemic infection by tobacco etch virus (TEV; Mahajan et al., 1998). Some ecotypes (e.g. C24 and Ler) allow long-distance movement of TEV from inoculated rosette leaves to noninoculated inflorescence tissue. Many ecotypes, such as Col-0, support replication and cell-to-cell movement of TEV in inoculated leaves but do not allow systemic movement of the virus. At least three Arabidopsis loci, RTM1 (restricted TEV movement 1), RTM2, and RTM3, are required for restriction of long-distance TEV movement in Col-0 (Mahajan et al., 1998; Whitham et al., 1999; S. Whitham, M. Yamamoto, and J.C. Carrington, unpublished data). Restriction mediated by the RTM system is specific to TEV and does not involve a hypersensitive response or induction of systemic acquired resistance (Mahajan et al., 1998; Whitham et al., 2000). The RTM1 and RTM2 genes were isolated by map-based cloning. The deduced RTM1 protein is similar to the Artocarpus integrifolia lectin, jacalin. Jacalin belongs to a family of related proteins, including at least ten Arabidopsis proteins, that contain one or more copies of a jacalin-like subunit, termed the jacalin repeat (JR; Chisholm et al., 2000). Several JR-containing proteins function in a jasmonate-inducible wound response, the result of which is production of antifungal and insecticidal compounds (Bones and Rossiter, 1996). A JR protein from Maclura pomifera has direct insecticidal activity (Murdock et al., 1990). Thus, proteins with JRs function in plant defense but by mechanisms that appear distinct from virus resistance (Chisholm et al., 2000). The deduced RTM2 protein contains several domains, including an N-terminal region with similarity to plant small heat shock proteins (HSPs; Whitham et al., 2000). Unlike most other small HSPs, RTM2 has an extended C terminus that includes a predicted transmembrane domain. In addition, phylogenetic comparisons revealed that the RTM2 small HSP domain is distinct from the five well-characterized families of plant small HSPs. Given the unique structural features of RTM2, this protein may have functions distinct from those of other characterized plant small HSPs (Whitham et al., 2000).
Isolation of RTM1 and RTM2 provided only limited insight to how the RTM system functions to prevent TEV long-distance movement, although the restriction phenotype suggests several possibilities. The RTM1, RTM2, and RTM3 proteins may prevent virus entry into, transport through, or exit from the phloem by either inhibiting long-distance movement functions of TEV proteins or acting as a phloem surveillance system that specifically regulates vascular trafficking of TEV. As an alternative, the RTM system may establish a TEV-restrictive state in systemic tissues, perhaps by transporting or perceiving a signal that triggers resistance in distal tissues. To better understand the mechanism of virus restriction, the expression pattern of the RTM1 and RTM2 genes was examined. Analysis of the activity of RTM1 and RTM2 regulatory sequences and localization of RTM1 and RTM2 fusion proteins revealed that components of the RTM system function in the phloem, perhaps within the sieve elements (SEs), to restrict TEV long-distance movement.
RESULTS
RTM1 Is a Soluble Protein but Accumulates to a Level below the Limits of Detection
To identify Arabidopsis tissues and cell types containing RTM1, polyclonal antibodies were raised against a recombinant protein. The RTM1 protein was expressed in Escherichia coli as a fusion containing a poly-His tag (RTM1-His6). Recombinant RTM1-His6 was purified and used to immunize Rhode Island red chickens.
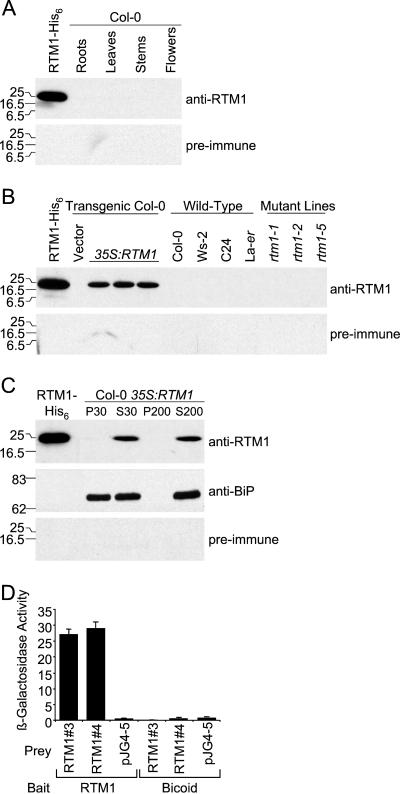
Extracts from roots, rosette leaves, stems, and inflorescence tissue of the TEV-restrictive ecotype Col-0 (RTM1/RTM1) were tested for RTM1 by immunoblot analysis (Fig. 1A). Although anti-RTM1 recognized purified RTM1-His6, no specific bands were detected in any Col-0 tissue type. Tissue from TEV-restrictive (Col-0 and Ws-2 [RTM1/RTM1]) and susceptible (C24 and Ler [rtm1/rtm1]) ecotypes, rtm1 mutant lines (rtm1-1, rtm1-2, and rtm1-5 [Whitham et al., 1999; Chisholm et al., 2000]), and transgenic plants expressing RTM1 from the 35S promoter was also examined using anti-RTM1 (Fig. 1B). A specific band of expected size (approximately 19.4 kD) was detected in plants constitutively expressing 35S:RTM1, but no specific bands were detected in extracts from the various ecotypes and mutant lines. Similar results were obtained using anti-RTM1 produced in each of four chickens (data not shown).
Figure 1.
Detection and characterization of RTM1 protein. A, Immunoblot analysis of purified RTM1-His6 and protein extracts from Col-0 roots, leaves, stems, and inflorescence tissue using anti-RTM1 (top panel) and preimmune (bottom panel) sera. Each lane contains 50 μg of total SDS-soluble protein. B, Immunoblot analysis of purified RTM1-His6, and protein extracts (50 μg) from stem tissue of transgenic plants containing empty vector or 35S:RTM1 (three independent lines); Arabidopsis Col-0, Ws-2, C24, and Ler ecotypes; and rtm1-1, rtm1-2 and rtm1-5 mutant lines, using anti-RTM1 (top panel) and preimmune (bottom panel) sera. C, Immunoblot analysis of purified RTM1-His6 and crude membrane fractions from a 35S:RTM1 plant using anti-RTM1 (top panel), anti-BiP (middle panel), and preimmune (bottom panel) sera. Samples were subjected to centrifugation at 3000g. After centrifugation, the supernatant was spun at 30,000g for 1 h to obtain crude membrane (P30) and soluble (S30) fractions. A portion of the S30 fraction was spun at 200,000g for 3 h, resulting in soluble (S200) and insoluble (P200) fractions. Positions of protein markers (in kD) are shown to the left of each panel. D, Quantitative β-galactosidase assay using yeast two-hybrid cultures. β-galactosidase assays were done using three independent cultures for each combination of constructs. The mean (+SD) is shown. Data from assays using two independent RTM1 prey constructs (RTM1 no. 3 and no. 4) are shown. Empty prey vector, pJG4-5, and Drosophila melanogaster Bicoid protein bait were used as negative controls.
The lack of detection of RTM1 in various tissues, ecotypes, and rtm1 mutant lines may be due to several factors. For instance, RTM1 may be present but in concentrations below the level of detection using anti-RTM1 serum. Dilutions of purified RTM1-His6 were analyzed to determine the minimum level of protein detected by anti-RTM1. This antiserum detected as little as 0.16 ng of purified protein under standard conditions. Approximately 50 μg of total protein was used for immunoblot analysis of tissues and ecotypes. It was concluded, therefore, that RTM1 was present in extracts at a level less than 3.2 ng/mg total protein.
The RTM1 protein was detected in plants expressing 35S:RTM1. These plants were used to test the hypothesis that RTM1 is a membrane-associated protein. Immunoblot assays for RTM1 and the luminal endoplasmic reticulum binding protein (BiP) were done after a series of centrifugation steps. The BiP protein was used as a membrane-associated control. The BiP protein was identified in both the crude membrane (P30) and soluble (S30) fractions (Fig. 1C), suggesting that membrane-associated and soluble (or membrane-released) forms of BiP were present. Soluble BiP remained in solution even after 200,000g centrifugation (Fig. 1C). The RTM1 protein remained in the supernatant following centrifugation at 30,000g and 200,000g (Fig. 1C), indicating that RTM1 is a soluble protein that is not associated tightly with membranes.
RTM1 Self-Interaction in the Yeast Two-Hybrid System
The three-dimensional structures of the JR-containing lectins, jacalin, and the M. pomifera agglutinin, show that these proteins function as tetramers (Ruffet et al., 1992; Lee et al., 1998). It was predicted that RTM1, with a single JR domain, would self-associate into multimers. To test this hypothesis, the yeast two-hybrid system was used (Finley and Brent, 1996). Quantitative β-galactosidase assays were done to test for RTM1:RTM1 self-interaction. A specific interaction was detected in yeast expressing both RTM1-containing bait and prey constructs (Fig. 1D). No interaction was detected when RTM1 was tested with empty vector or with a D. melanogaster Bicoid construct. It was concluded that the RTM1 protein interacts with itself, and like other JR-containing proteins, functions as a multimeric complex.
The RTM1 and RTM2 Regulatory Sequences Are Preferentially Active in Phloem
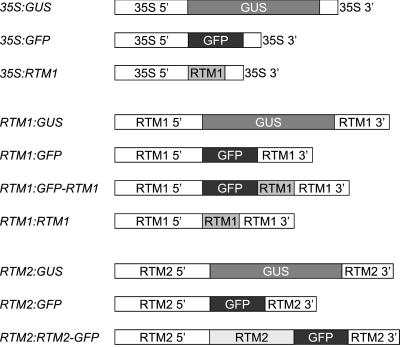
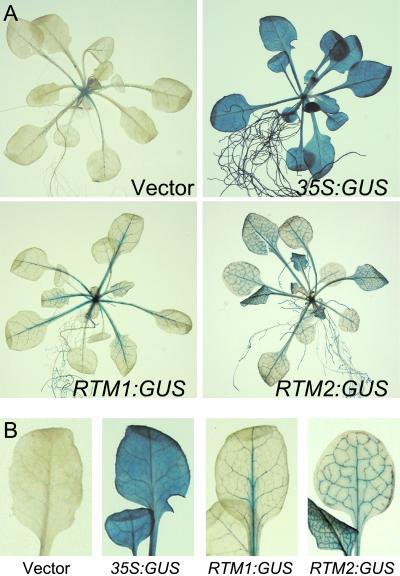
Given the relatively low level of RTM1 protein in Arabidopsis tissues, an analysis of RTM1 expression was done using transcriptional fusions between the RTM1 5′ and 3′ regulatory sequences and a reporter gene. In addition, transcriptional fusions using the RTM2 5′ and 3′ regulatory sequences were analyzed. The RTM1 and RTM2 regulatory sequences used in all experiments contained upstream and downstream sequences required for functional complementation of rtm1 and rtm2 mutant lines, respectively (Chisholm et al., 2000; Whitham et al., 2000). Constructs in which the β-glucuronidase (GUS) open reading frame was placed under control of the RTM1 regulatory sequences, the RTM2 regulatory sequences, or the 35S promoter were generated (Fig. 2) and introduced into Arabidopsis Col-0 plants. In situ histochemical analysis revealed GUS activity in all tissues of plants expressing 35S:GUS (Fig. 3). In Col-0 plants transformed with the empty vector, pSLJ755I5, sporadic speckled staining occurred primarily along the midvein of mature leaves (Fig. 3). The source of this staining was not determined. In Col-0 plants expressing GUS under the control of the RTM1 or RTM2 regulatory sequence, GUS activity was confined to vascular-associated tissues (Fig. 3). Vascular-associated GUS activity in these plants was detected in leaves, stems, roots, and flowers (Figs. 3 and 4; data not shown). This clear GUS staining in both major and minor veins was distinct from the background staining detected in vector-transformed leaves (Fig. 3B).
Figure 2.
Schematic representation of DNA constructs used to generate transgenic Arabidopsis plants. 35S 5′, 35S promoter with dual enhancer and TEV leader sequence (Restrepo et al., 1990); 35S 3′, 35S poly(A) signal; RTM1 5′, 1,150 nt upstream of RTM1 coding sequence; RTM1 3′, 760 nt downstream of RTM1 coding sequence; RTM2 5′, 1,195 nt upstream of RTM2 coding sequence; RTM2 3′, 653 nt downstream of RTM2 coding sequence.
Figure 3.
GUS expression pattern in transgenic Arabidopsis plants. A, Col-0 plants transformed with empty vector, 35S:GUS, RTM1:GUS, or RTM2:GUS were infiltrated with the histochemical substrate, X-gluc, and incubated at 37°C for 2 h. Plants were cleared with 75% (v/v) ethanol at 70°C. B, Enlargement of leaves from plants in A.
Figure 4.
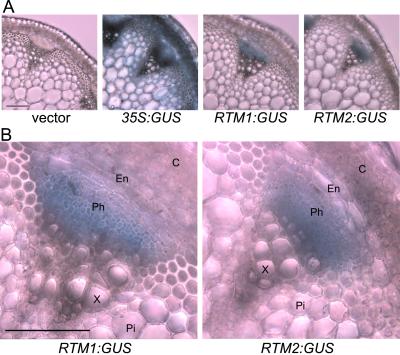
GUS expression patterns in transverse sections of stem tissue from transgenic Arabidopsis plants. A, Transverse sections from Col-0 plants transformed with empty vector, 35S:GUS, RTM1:GUS, or RTM2:GUS were incubated in the histochemical substrate, X-gluc, at 37°C for 30 min. Sections were cleared in 75% (v/v) ethanol at 70°C. B, Higher magnification of vascular bundles in sections of RTM1:GUS and RTM2:GUS transgenic plants. C, Cortex; En, endodermis; Ph, phloem; X, xylem; Pi, pith. Scale bar = 100 μm.
To identify vascular-associated cells in which the RTM1:GUS and RTM2:GUS genes were expressed, transverse sections of transgenic Arabidopsis stems were analyzed for GUS activity. All histochemical staining was done after sections were cut. No staining was visible in plants transformed with the vector, pSLJ755I5 (Fig. 4A). Plants constitutively expressing 35S:GUS were stained in most or all cells (Fig. 4A). In Arabidopsis plants expressing GUS from either the RTM1 or RTM2 regulatory sequences, GUS activity was only detected in phloem or phloem-proximal cells (Fig. 4, A and B). However, inherent limitations in the GUS analysis did not allow identification of individual cells in which the regulatory sequences were active.
Green Fluorescent Protein (GFP)-RTM1 and RTM2-GFP Fusion Proteins Accumulate in SEs
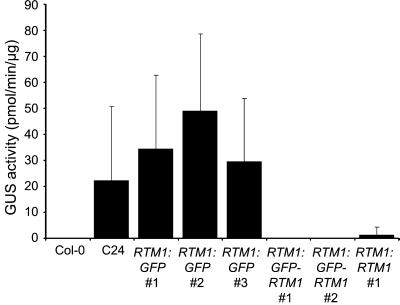
To more precisely identify cells in which the RTM1 and RTM2 regulatory sequences are active and in which the proteins accumulate, transgenic Arabidopsis plants that expressed a fusion of GFP and RTM1 under control of the RTM1 regulatory sequence (RTM1:GFP-RTM1), or a fusion of RTM2 and GFP under control of the RTM2 regulatory sequence (RTM2:RTM2-GFP), were generated. The RTM1:GFP-RTM1 and RTM2:RTM2-GFP constructs (Fig. 2) were introduced into the TEV-susceptible C24 (rtm1/rtm1) and rtm2-1 mutant (rtm2/rtm2) lines, respectively. Transgenic C24 plants expressing RTM1:GFP-RTM1 were tested to determine whether the transgene complemented the RTM1-defective phenotype. Due to the recessive rtm1 allele, C24 plants support long-distance movement of TEV-GUS, a recombinant TEV strain encoding GUS (Dolja et al., 1992), to noninoculated inflorescence tissue by 21 d post inoculation (Mahajan et al., 1998). Transgenic C24 plants expressing functional RTM1 fusion protein were expected to restrict TEV-GUS to inoculated leaves. Non-transgenic C24 and as well as C24 transformed with RTM1:GFP (non-fused GFP expressed under control of the RTM1 regulatory sequence; Fig. 2) allowed long-distance movement of TEV-GUS (Fig. 5). However, C24 lines expressing RTM1:RTM1 (non-fused RTM1 expressed from the RTM1 regulatory sequence; Fig. 2) or RTM1:GFP-RTM1 restricted long-distance movement of TEV-GUS (Fig. 5). Therefore, the GFP-RTM1 fusion protein expressed in transgenic plants from the RTM1 regulatory sequence was functional. The ability of the RTM2-GFP fusion protein to function to restrict long-distance TEV movement was not assessed.
Figure 5.
Transgenic complementation of rtm1 phenotype by RTM1:GFP-RTM1. GUS activity assays of TEV-GUS-inoculated wild-type Col-0 (non-susceptible) and C24 (susceptible) plants and selected T2 C24 lines expressing RTM1:GFP, RTM1:GFP-RTM1, or RTM1:RTM1. Inflorescence tissue from at least 10 T2 individuals was analyzed for GUS activity at 21 d post-inoculation. The mean GUS activity value (+sd) is shown. Note that the lack of GUS activity (restricted TEV-GUS accumulation) in inflorescence tissue indicates the presence of functional RTM1 activity (Chisholm et al., 2000).
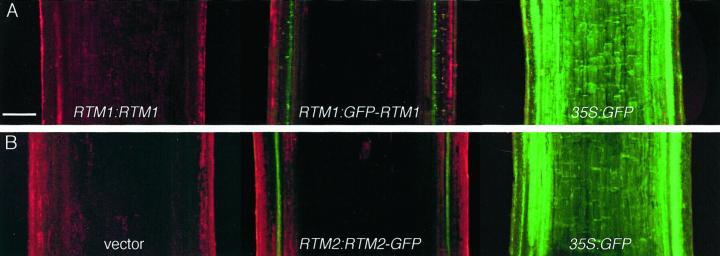
Confocal laser scanning microscopy was used to localize GFP-RTM1 and RTM2-GFP fusion proteins in longitudinal sections of stem tissue from transgenic Arabidopsis plants (Fig. 6). No GFP was detected in C24 plants expressing RTM1:RTM1, or in rtm2-1 plants transformed with empty pSLJ755I5 vector (Fig. 6, A and B, respectively, left image). Green fluorescence was detected in most or all cells of C24 and rtm2-1 plants constitutively expressing 35S:GFP (Fig. 6, A and B, respectively, right image). In C24 plants expressing RTM1:GFP-RTM1, files of punctate fluorescence were detected in vascular-proximal cells (Fig. 6A, center). Fluorescence was also detected in columns of vascular-proximal cells in rtm2-1 plants expressing RTM2:RTM2-GFP (Fig. 6B, center). Although the GUS expression analysis suggested that the RTM1 and RTM2 regulatory sequences were preferentially active in the phloem, this fluorescence pattern indicated that the GFP fusion proteins, when expressed from the RTM1 or RTM2 regulatory sequences, remain in vascular-associated cells.
Figure 6.
Detection of GFP in transgenic Arabidopsis plants. A, Longitudinal sections of stem tissue from C24 plants transformed with RTM1:RTM1 (left), RTM1:GFP-RTM1 (center), or 35S:GFP (right). B, Longitudinal sections of stem tissue from rtm2-1 plants transformed with empty vector (left), RTM2:RTM2-GFP (center) or 35S:GFP. Confocal laser scanning images of red fluorescence (from chlorophyll) and green fluorescence (GFP) were merged using Laser Sharp 3.2. Scale bar = 200 μm, all images at equal magnification.
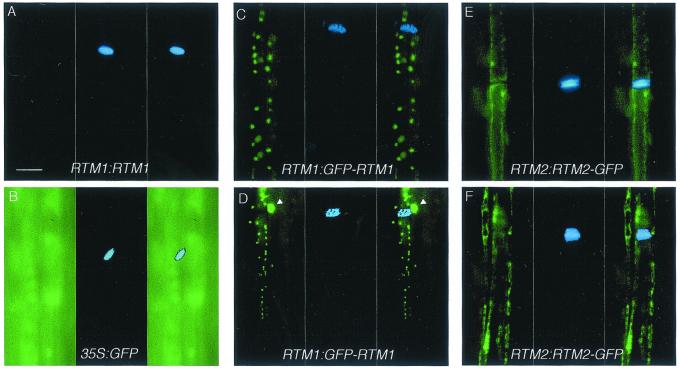
To determine the identity of cells containing fluorescence in the RTM1:GFP-RTM1 and RTM2:RTM2-GFP transgenic lines, epifluorescence microscopy was used to analyze GFP fluorescence in stem sections stained with the fluorescent dye, aniline blue. Aniline blue identifies SEs by binding to callose deposits on sieve plates between adjacent SEs. No green fluorescence was detected in SEs of C24 plants expressing RTM1:RTM1, although sieve plates were easily identified (Table I; Fig. 7A). Green fluorescence was detected in virtually all cells from stem tissue of C24 plants transformed with 35S:GFP, including cells immediately adjacent to SEs (Table I; Fig. 7B). Whether GFP was present in SEs in 35S:GFP plants was difficult to assess due to high levels of GFP in the surrounding tissue. In contrast to plants expressing 35S:GFP, plants expressing RTM1:GFP-RTM1 or RTM2:RTM2-GFP contained green fluorescence primarily in structures that also contained aniline blue staining (Fig. 7, C–F), indicating GFP-RTM1 and RTM2-GFP accumulate in SEs when expressed from the respective RTM1 and RTM2 regulatory sequences. Within SEs, the GFP-RTM1 fluorescence pattern was punctate, with fluorescence confined to spheres with diameters of approximately 1 to 2 μm (Fig. 7, C and D). The RTM2-GFP fluorescence was prominent near the perimeter of SEs (Fig. 7, E and F). Whereas fluorescence from RTM2-GFP was only seen in SEs (adjacent SEs are visible in Fig. 7F, though only one sieve plate is in the field of view), fluorescence from GFP-RTM1 was also detected in cells that were not stained with aniline blue but that were immediately adjacent to the SEs (Table I; Fig. 7D). In stems of C24 plants transformed with 35S:GFP-RTM1, fluorescence was detected in virtually all cell types examined (Table I; data not shown), indicating that GFP-RTM1 does not accumulate in SEs solely due to diffusion from surrounding tissues.
Table I.
Cell types containing GFP fluorescence in stem tissue of transgenic Arabidopsis plants
| Constructb | Cell Typea
|
|||||
|---|---|---|---|---|---|---|
| Cortex | Endodermis | Phloem
|
Xylem | Pith | ||
| SE | Adjacent to SEc | |||||
| pSLJ755I5 | − | − | − | − | − | − |
| RTM1:RTM1 | − | − | − | − | − | − |
| RTM1:GFP-RTM1 | − | − | + | + | − | − |
| RTM2:RTM2-GFP | − | − | + | − | − | − |
| 35S:GFP | + | + | ndd | + | + | + |
| 35S:GFP-RTM1 | + | + | + | + | + | + |
+, Cell type contained GFP when examined by epifluorescence microscopy; −, no fluorescence detected in cell type.
DNA construct (see Fig. 2) expressed in transgenic Arabidopsis plants.
Phloem-associated cells other than SEs.
nd, Not determined. High levels of diffuse GFP in cells and tissues adjacent to SEs prevented determination of whether or not SEs contained GFP.
Figure 7.
Localization of GFP-RTM1 and RTM2-GFP to SEs. Longitudinal sections of transgenic Arabidopsis plants expressing RTM1:RTM1 (A), 35S:GFP (B), RTM1:GFP-RTM1 (C and D), and RTM2:RTM2-GFP (E and F) were examined for GFP fluorescence (left panel in each set) and aniline blue fluorescence (center panel). Images of GFP and aniline blue fluorescence were merged (right panel) to show relative localization of GFP and aniline blue. Arrowheads in (D) indicate GFP-RTM1 fluorescence in cell adjacent to SE. Two adjacent SEs are visible in F. Scale bar = 20 μm, all images at equal magnification.
DISCUSSION
To understand how the RTM system restricts long-distance movement of TEV, RTM1 and RTM2 accumulation and expression patterns were characterized. The RTM1 protein was not detected by immunoblot analysis of wild-type Arabidopsis tissues, likely because it was expressed in a limited number of cells. However, functional RTM1 expressed from a 35S promoter was detected and shown to accumulate in a soluble (non-membrane, non-particulate) fraction. Combined with results of the protein-protein interaction experiments and structural information about the JR domain (Ruffet et al., 1992; Lee et al., 1998), we propose that RTM1 accumulates as a multimer in a soluble form.
Independent experiments showed that the RTM1 and RTM2 regulatory sequences were functional primarily in or around phloem. When the GUS coding sequence was expressed under control of RTM1 or RTM2 regulatory sequences, GUS activity was confined to phloem-associated tissues. Moreover, fusion proteins containing RTM1 or RTM2 and GFP accumulated in SEs when expressed from the RTM1 or RTM2 regulatory sequences, respectively. In fact, the RTM2-GFP fusion protein was detected exclusively in SEs. The GFP-RTM1 fusion protein was detected in SEs as well as in cells immediately adjacent to SEs, which were likely companion cells (CCs).
The RTM1 and RTM2 proteins may contain specific information for transport to, or accumulation in, SEs. However, Imlau et al. (1999) showed that GFP, without any additional sequences, enters and moves though SEs of transgenic Arabidopsis and tobacco (Nicotiana tabacum) when expressed from a CC-specific promoter, suggesting that at least some proteins can passively diffuse from CCs to SEs. Diffusion of GFP from CCs into SEs is apparently due to its small size (26.7 kD) and, possibly, lack of a signal for retention in the CC (Imlau et al., 1999). Using fluorescent dextrans, Kempers and van Bel (1997) found that the size exclusion limit of plasmodesmata between CCs and SEs of Vicia faba was greater than 10 kD but less than 40 kD. The GFP-RTM1 and RTM2-GFP proteins are approximately 45.9 and 67.7 kD, respectively. Although the possibility that GFP-RTM1 and RTM2-GFP diffuse into SEs from CCs cannot be excluded, it seems less likely given their sizes. Transport of RTM1 and RTM2 to the SEs might require molecular chaperones, as is generally assumed for large proteins that traffic through plasmodesmata (Mezitt and Lucas, 1996). RTM1 or RTM2 may conversely function themselves as chaperones, facilitating not only their own transport to SEs, but also transport of specific other proteins or macromolecules, including virus proteins or particles. It is interesting that the RTM2 protein has a domain with strong sequence and predicted structural similarity to plant small HSPs (Whitham et al., 2000).
The specific activity of the RTM1 and RTM2 regulatory sequences in phloem-associated tissues and the accumulation of RTM1 and RTM2 fusion proteins in SEs strongly suggests that these proteins function within phloem-associated tissues and/or SEs to restrict long-distance movement of TEV. There are multiple possibilities for how the RTM system could function within SEs. Long-distance movement of TEV requires the functions of at least four virus proteins, including HC-Pro, CI, NIa, and capsid proteins (Dolja et al., 1994; Cronin et al., 1995; Dolja et al., 1995; Kasschau et al., 1997; Schaad et al., 1997; Carrington et al., 1998). Components of the RTM system might directly or indirectly inhibit these proteins to prevent TEV movement through SEs. Proteins, transcripts, and defense signals, including signals for RNA silencing, all move long-distance through the plant vascular system (for review, see Oparka and Turgeon, 1999). Movement of these molecules into and through SEs may involve interaction with a long-distance transport system. The RTM1 and RTM2 proteins might be components of such a transport system, but with functions that result in exclusion of TEV. For example, the RTM factors may function as structural factors within a complex that occludes interaction with TEV movement proteins or particles. Alternatively, the RTM system might be required to transport a defense signal for the establishment of a TEV-restrictive state in systemic tissues. The TEV specificity in this scenario could be explained by differential sensitivity to the defense response or to a specific failure of TEV to suppress the response.
Additional characterization of functions of the RTM1 and RTM2 proteins, as well as isolation of RTM3, will not only further the understanding of this unique virus restriction system, but may provide insight to other systemic plant processes.
MATERIALS AND METHODS
Expression of RTM1 in Escherichia coli and Production of RTM1 Antibody
The RTM1 coding sequence was amplified using primers (sequences available on request) that added BamHI and NotI restriction sites to the 5′ and 3′ ends, respectively. The PCR product was purified, digested with BamHI and NotI, and inserted into pET-23a (Novagen, Madison, WI) at the 5′ end of a poly-His tag coding sequence. Ligated DNA was introduced into BL21 (DE3) pLysS cells (Novagen). Cells carrying pET23a-RTM1 were grown overnight and induced by adding isopropyl-β-d-thiogalactopyranoside to a final concentration of 0.4 mm. Induced cultures were grown at 30°C for 1 h or overnight at 20°C. Recombinant protein was purified using Ni2+ resin (Quick 300 cartridges, Novagen) following manufacturer's instructions and used for production of antibodies in four Rhode Island red chickens (Infinitech, Ramona, CA).
Isolation of Plant Protein, Immunoblot Analysis, and Crude Membrane Fractionation
Plant tissue was ground in 3 volumes (w/v) of lysis buffer (0.1% [v/v] Triton X-100, 0.069% [v/v] β-mercap-toethanol, 34 mm N-lauroyl sarcosine, 10 mm EDTA, and 40 mm NaH2PO4 pH 7.0). Debris was removed by centrifugation at 3,000g. Protein concentration of the soluble fraction was measured according to the method of Bradford (Bradford, 1976). Protein samples were equilibrated, denatured in dissociation buffer (2% [w/v] SDS, 10% [v/v] glycerol, 10% [v/v] β-mercaptoethanol, 0.02% [w/v] bromphenol blue, and 62.5 mm Tris pH 6.8), and approximately 50 μg was subjected to SDS-PAGE. Immunoblot analysis was done as described (Whitham et al., 1999) using 1:1,000 diluted primary antibody and 1:10,000 diluted horseradish peroxidase-conjugated secondary antibody.
For crude membrane fractionations, tissue from Col-0 plants expressing 35S:RTM1 (see below) was ground in 4 volumes (w/v) of buffer Q (50 mm Tris, pH 7.4, 15 mm MgCl2, 10 mm KCl, 20% [v/v] glycerol, 0.1% [v/v] β-mercaptoethanol, 5 μg/mL leupeptin, and 2 μg/mL aprotinin). Samples were subjected to centrifugation at 3,000g for 10 min to remove nuclei, chloroplasts, cell wall, and debris. After centrifugation, the supernatant (S3) was spun at 30,000g for 1 h to obtain crude membrane (P30) and soluble (S30) fractions. A portion of the S30 fraction was spun at 200,000g for 3 h, resulting in soluble (S200) and insoluble (P200) fractions. Samples were equilibrated in dissociation buffer and resolved by SDS-PAGE.
Yeast Two-Hybrid Analysis
Yeast two-hybrid analyses were done using LexA fusion expression plasmids (Finley and Brent, 1996). The RTM1 coding sequence was amplified by reverse transcription-PCR from Col-0 poly(A+) RNA using primers that added EcoRI and XhoI restriction sites to the 5′ and 3′ ends, respectively. The reverse transcription-PCR products were purified, digested with EcoRI and XhoI, and inserted between the EcoRI and XhoI sites of the pEG202 “prey” and pJG4-5 “bait” plasmids. Yeast cells were transformed with plasmid DNA using a lithium acetate method (Ausubel et al., 1995). Quantitative β-galactosidase assays were done as described (Daròs et al., 1999) using three independent cultures for each combination of constructs.
Production of RTM1 and RTM2 Fusion Constructs
To isolate the RTM1 regulatory sequences, genomic sequence surrounding RTM1 (including 1,150 nucleotides [nt] upstream and 760 nt downstream of the RTM1 coding sequence) was amplified using PCR primers that added a SacI site to the 5′ end of the upstream sequence and a XhoI site to the 3′ end of the downstream sequence, and that created a cloning site containing BamHI and PstI sites in place of the RTM1 coding sequence. The PCR product was digested and inserted between the SacI and XhoI sites of pBluescript II KS− (Stratagene, La Jolla, CA) to generate pBS-RTM1pro. The GUS coding sequence was amplified using primers that added a BamHI and PstI site to the 5′ and 3′ ends, respectively. The PCR product was purified, digested, and inserted between the BamHI and PstI sites of pBS-RTM1pro to generate pBS-RTM1:GUS. The RTM1:GUS expression cassette (Fig. 2) was excised from pBS-RTM1:GUS by digestion with SacI and XhoI and transferred to pSLJ755I5 (Jones et al., 1992).
To place the GUS coding sequence under control of the RTM2 regulatory sequences, the GUS sequence was amplified using primers that added a BglII site to both the 5′ and 3′ ends. Purified PCR product was digested with BglII and inserted at the 3′ end of the RTM2 sequence in pBS 3.1 (Whitham et al., 2000) to generate pBS-RTM2:RTM2-GUS. The pBS 3.1 plasmid contains a 3.1-kb Col-0 genomic EcoRI fragment that includes RTM2 and all necessary regulatory sequences (Whitham et al., 2000). The RTM2 regulatory sequences and the GUS coding sequence, but not the RTM2 coding sequence, were amplified from pBS-RTM2:RTM2-GUS by inverse PCR. The PCR product was self-ligated to generate pBS-RTM2:GUS. The RTM2:GUS expression cassette (Fig. 2) was inserted into pSLJ755I5 at the EcoRI site.
To create a translational fusion between the GFP and RTM1 coding sequences (GFP-RTM1), the RTM1 coding region was amplified using primers that added a BglII and BamHI site to the 5′ and 3′ ends, respectively. The PCR product was purified, digested, and inserted in the BamHI site at the 3′ end of GFP in pRTL2-smGFP, which is a pRTL2-based plasmid (Restrepo et al., 1990) containing the smGFP coding sequence (Davis and Vierstra, 1998) adjacent to a cauliflower mosaic virus 35S promoter. The GFP-RTM1 sequence was amplified by PCR, purified, digested, and inserted into pBS-RTM1pro as above. The RTM1:GFP-RTM1 expression cassette (Fig. 2) was transferred to pSLJ755I5 using SacI and XhoI.
To create a translational fusion between RTM2 and GFP, the GFP coding region was amplified using primers that added BamHI sites to both the 5′ and 3′ ends. Purified PCR product was digested and inserted into the BglII site at the 3′ end of the RTM2 sequence in pBS 3.1. This placed the RTM2-GFP fusion under control of the RTM2 regulatory sequences. The RTM2:RTM2-GFP expression cassette (Fig. 2) was inserted into pSLJ755I5 at the EcoRI site.
Transformation of Arabidopsis Plants
The pSLJ755I5-derived constructs were transferred to Agrobacterium tumefaciens strain GV3101 and introduced into Arabidopsis ecotypes and mutant lines as described (Chisholm et al., 2000). Transformants were selected on soil saturated with 25 μg/mL glufosinate ammonium (Finale, AgroEvo, Montvale, NJ).
In Situ Histochemical Analysis of GUS Activity
Whole plant tissue was infiltrated with the histochemical substrate 5-bromo-4-chloro-3-indolyl-β-d-glucuronide (X-gluc, 2.25 mm) under vacuum for 20 min. Infiltrated whole tissues were incubated at 37°C for 2 h. Hand sections of stem tissue were floated on 2.25 mm X-gluc for 30 min. Tissue was cleared with 75% (v/v) ethanol at 70°C.
Virus Inoculations and GUS Activity Assays
Rosette leaves of 4-week-old Arabidopsis plants were dusted with carborundum and inoculated with TEV-GUS, a recombinant TEV strain encoding GUS (Dolja et al., 1992). GUS activity assays were done as described using inflorescence tissue at 21 d post inoculation (Mahajan et al., 1998). Inoculated leaves from plants that scored negative in systemic GUS activity assays were tested for virus infection by in situ histochemical assay (Dolja et al., 1992).
Fluorescence Microscopy
Hand sections of fresh stem tissue were used for confocal laser scanning microscopy or epifluorescence microscopy. Confocal laser scanning microscopy was used to detect GFP and chlorophyll autofluorescence (red). Green and red images were merged using Laser Sharp 3.2 (Bio-Rad, Hercules, CA). Epifluorescence microscopy was done using an Olympus BX50 microscope (Tokyo). A U-MNB filter cube with a DM500 dichroic mirror, BP470-490 exciter filter, and BA515 barrier filter was used for detection of GFP fluorescence. To detect sieve plates, sections were incubated with decolorized 0.05% (w/v) aniline blue for 15 min at 20°C and washed three times with water prior to microscopy. A U-MNU filter cube with a DM400 dichroic mirror, BP360-370 exciter filter, and BA420 barrier filter was used to detect aniline blue fluorescence. Images of GFP and aniline blue fluorescence were merged using Adobe Photoshop 5.5 (Adobe Systems, San Jose, CA).
ACKNOWLEDGMENTS
We thank Andrew Sharp, Rachael Parkin, and Christa Weathers for assistance with generation and maintenance of transgenic plants. We are grateful to Vincent Franceschi and the Washington State University Electron Microscopy Center for advice regarding confocal laser scanning microscopy and aniline blue staining.
Footnotes
This work was supported by the National Institutes of Health (grant nos. AI43288 and AI27832) and by the U.S. Department of Agriculture (grant no. NRI 98–35303–6485).
Article, publication date, and citation information can be found at www.plantphysiol.org/cgi/doi/10.1104/pp.010479.
LITERATURE CITED
- Ausubel F, Brent R, Kingston RE, Moore DD, Seidman JG, Smith JA, Struhl K, editors. Short Protocols in Molecular Biology. Ed 3. New York: John Wiley & Sons; 1995. [Google Scholar]
- Bones AM, Rossiter J. The myrosinase-glucosinolate system, its organization and biochemistry. Physiol Plant. 1996;97:194–208. [Google Scholar]
- Bradford MM. A rapid and sensitive method for the quantitation of microgram quantities of protein utilizing the principle of protein-dye binding. Anal Biochem. 1976;72:248–254. doi: 10.1006/abio.1976.9999. [DOI] [PubMed] [Google Scholar]
- Carrington JC, Jensen PE, Schaad MC. Genetic evidence for an essential role for potyvirus CI protein in cell-to-cell movement. Plant J. 1998;14:393–400. doi: 10.1046/j.1365-313x.1998.00120.x. [DOI] [PubMed] [Google Scholar]
- Carrington JC, Kasschau KD, Mahajan SK, Schaad MC. Cell-to-cell and long-distance movement of viruses in plants. Plant Cell. 1996;8:1669–1681. doi: 10.1105/tpc.8.10.1669. [DOI] [PMC free article] [PubMed] [Google Scholar]
- Chisholm ST, Mahajan SK, Whitham SA, Yamamoto ML, Carrington JC. Cloning of the Arabidopsis RTM1 gene, which controls restriction of long-distance movement of tobacco etch virus. Proc Natl Acad Sci USA. 2000;97:489–494. doi: 10.1073/pnas.97.1.489. [DOI] [PMC free article] [PubMed] [Google Scholar]
- Cronin S, Verchot J, Haldeman-Cahill R, Schaad MC, Carrington JC. Long-distance movement factor: a transport function of the potyvirus helper component-proteinase. Plant Cell. 1995;7:549–559. doi: 10.1105/tpc.7.5.549. [DOI] [PMC free article] [PubMed] [Google Scholar]
- Daròs JA, Schaad MC, Carrington JC. Functional analysis of interaction between VPg-proteinase (NIa) and RNA polymerase (NIb) of tobacco etch potyvirus using conditional and suppressor mutants. J Virol. 1999;73:8732–8740. doi: 10.1128/jvi.73.10.8732-8740.1999. [DOI] [PMC free article] [PubMed] [Google Scholar]
- Davis SJ, Vierstra RD. Soluble, highly fluorescent variants of green fluorescent protein (GFP) for use in higher plants. Plant Mol Biol. 1998;36:521–528. doi: 10.1023/a:1005991617182. [DOI] [PubMed] [Google Scholar]
- Dolja VV, Haldeman R, Robertson NL, Dougherty WG, Carrington JC. Distinct functions of capsid protein in assembly and movement of tobacco etch potyvirus in plants. EMBO J. 1994;13:1482–1491. doi: 10.1002/j.1460-2075.1994.tb06403.x. [DOI] [PMC free article] [PubMed] [Google Scholar]
- Dolja VV, Haldeman-Cahill R, Montgomery AE, VandenBosch KA, Carrington JC. Capsid protein determinants involved in cell-to-cell and long distance movement of tobacco etch potyvirus. Virology. 1995;207:1007–1016. doi: 10.1006/viro.1995.1023. [DOI] [PubMed] [Google Scholar]
- Dolja VV, McBride HJ, Carrington JC. Tagging of plant potyvirus replication and movement by insertion of β-glucuronidase into the viral polyprotein. Proc Natl Acad Sci USA. 1992;89:10208–10212. doi: 10.1073/pnas.89.21.10208. [DOI] [PMC free article] [PubMed] [Google Scholar]
- Finley RL, Brent R. Interaction trap cloning with yeast. In: Glover D, Hames B, editors. DNA Cloning-Expression Systems: A Practical Approach. Oxford: Oxford University Press; 1996. pp. 169–203. [Google Scholar]
- Imlau A, Truernit E, Sauer N. Cell-to-cell and long-distance trafficking of the green fluorescent protein in the phloem and symplastic unloading of the protein into sink tissues. Plant Cell. 1999;11:309–322. doi: 10.1105/tpc.11.3.309. [DOI] [PMC free article] [PubMed] [Google Scholar]
- Jones JD, Shlumukov L, Carland F, English J, Scofield SR, Bishop GJ, Harrison K. Effective vectors for transformation, expression of heterologous genes, and assaying transposon excision in transgenic plants. Transgenic Res. 1992;1:285–297. doi: 10.1007/BF02525170. [DOI] [PubMed] [Google Scholar]
- Kasschau KD, Cronin S, Carrington JC. Genome amplification and long-distance movement functions associated with the central domain of tobacco etch potyvirus helper component-proteinase. Virology. 1997;228:251–262. doi: 10.1006/viro.1996.8368. [DOI] [PubMed] [Google Scholar]
- Kempers R, van Bel AJE. Symplastic connections between sieve element and companion cell in the stem phloem of Vicia faba L. have a molecular exclusion limit of at least 10 kDa. Planta. 1997;201:195–201. [Google Scholar]
- Lee X, Thompson A, Zhang Z, Ton-that H, Biesterfeldt J, Ogata C, Xu L, Johnston RA, Young NM. Structure of the complex of Maclura pomifera agglutinin and the T-antigen disaccharide, Galβ1,3GalNAc. J Biol Chem. 1998;273:6312–6318. doi: 10.1074/jbc.273.11.6312. [DOI] [PubMed] [Google Scholar]
- Mahajan SK, Chisholm ST, Whitham S, Carrington JC. Identification and characterization of a locus (RTM1) in Arabidopsis thaliana that restricts long-distance movement of tobacco etch virus. Plant J. 1998;14:177–186. doi: 10.1046/j.1365-313x.1998.00105.x. [DOI] [PubMed] [Google Scholar]
- Mezitt LM, Lucas WJ. Plasmodesmal cell-to-cell transport of proteins and nucleic acids. Plant Mol Biol. 1996;32:251–273. doi: 10.1007/BF00039385. [DOI] [PubMed] [Google Scholar]
- Murdock LL, Huesing JE, Nielsen SS, Pratt RC, Shade RE. Biological effects of plant lectins on the cowpea weevil. Phytochemistry. 1990;29:85–89. [Google Scholar]
- Oparka KJ, Turgeon R. Sieve elements and companion cells: traffic control centers of the phloem. Plant Cell. 1999;11:739–750. doi: 10.1105/tpc.11.4.739. [DOI] [PMC free article] [PubMed] [Google Scholar]
- Restrepo MA, Freed DD, Carrington JC. Nuclear transport of plant potyviral proteins. Plant Cell. 1990;2:987–998. doi: 10.1105/tpc.2.10.987. [DOI] [PMC free article] [PubMed] [Google Scholar]
- Ruffet E, Paquet N, Frutiger S, Hughes GJ, Jaton JC. Structural and electron-microscopic studies of jacalin from jackfruit (Artocarpus integrifolia) show that this lectin is a 65 kDa tetramer. Biochem J. 1992;286:131–134. doi: 10.1042/bj2860131. [DOI] [PMC free article] [PubMed] [Google Scholar]
- Schaad MC, Lellis AD, Carrington JC. VPg of tobacco etch potyvirus is a host genotype-specific determinant for long-distance movement. J Virol. 1997;71:8624–8631. doi: 10.1128/jvi.71.11.8624-8631.1997. [DOI] [PMC free article] [PubMed] [Google Scholar]
- Whitham S, Yamamoto M, Carrington JC. Selectable viruses and Arabidopsis thaliana gain-of-susceptibility mutants. Proc Natl Acad Sci USA. 1999;96:772–777. doi: 10.1073/pnas.96.2.772. [DOI] [PMC free article] [PubMed] [Google Scholar]
- Whitham SA, Anderberg RJ, Chisholm ST, Carrington JC. Arabidopsis RTM2 gene is necessary for specific restriction of tobacco etch virus and encodes an unusual small heat shock-like protein. Plant Cell. 2000;12:569–582. doi: 10.1105/tpc.12.4.569. [DOI] [PMC free article] [PubMed] [Google Scholar]


