Abstract
Caveolin-2 is a member of the caveolin gene family with no known function. Although caveolin-2 is coexpressed and heterooligomerizes with caveolin-1 in many cell types (most notably adipocytes and endothelial cells), caveolin-2 has traditionally been considered the dispensable structural partner of the widely studied caveolin-1. We now directly address the functional significance of caveolin-2 by genetically targeting the caveolin-2 locus (Cav-2) in mice. In the absence of caveolin-2 protein expression, caveolae still form and caveolin-1 maintains its localization in plasma membrane caveolae, although in certain tissues caveolin-1 is partially destabilized and shows modestly diminished protein levels. Despite an intact caveolar membrane system, the Cav-2-null lung parenchyma shows hypercellularity, with thickened alveolar septa and an increase in the number of endothelial cells. As a result of these pathological changes, these Cav-2-null mice are markedly exercise intolerant. Interestingly, these Cav-2-null phenotypes are identical to the ones we and others have recently reported for Cav-1-null mice. As caveolin-2 expression is also severely reduced in Cav-1-null mice, we conclude that caveolin-2 deficiency is the clear culprit in this lung disorder. Our analysis of several different phenotypes observed in caveolin-1-deficient mice (i.e., abnormal vascular responses and altered lipid homeostasis) reveals that Cav-2-null mice do not show any of these other phenotypes, indicating a selective role for caveolin-2 in lung function. Taken together, our data show for the first time a specific role for caveolin-2 in mammalian physiology independent of caveolin-1.
Caveolae were first morphologically described in the 1950s by early electron microscopists (31, 52). These curious 50- to 100-nm membrane invaginations are most commonly found in terminally differentiated cells, such as adipocytes, endothelial cells, smooth and skeletal muscle cells, and epithelial cells. In the ensuing years, several functions were proposed for these structures, including transcytosis, potocytosis, and the concentration of certain membrane proteins.
A major advance in the study of caveolae was the discovery of the 21- to 24-kDa caveolar marker protein named caveolin (now called caveolin-1) (38). Along with concomitantly developed biochemical purification techniques, caveolin-1 served as an important means to identify such compartments and to study their function. The functional role of caveolin-1 is now a primary focus of the caveolar research field.
In an effort to discover other novel resident proteins of caveolae, Scherer and colleagues identified a second caveolin homologue through the microsequencing of purified adipocyte caveolar membranes. This ≈20-kDa protein, named caveolin-2, was ≈38% identical and 58% similar to caveolin-1 (44). Further study showed that in many respects caveolin-2 was tightly coregulated with caveolin-1. The two tissues with the highest caveolin-1 expression (adipose tissue and lung) are also the primary sites of caveolin-2 expression (44). Likewise, differentiation of 3T3-L1 fibroblasts to adipocytes leads to a ≈25-fold increase in the mRNA and protein levels of both caveolin-1 and caveolin-2 (44).
However, the relationship between caveolin-1 and caveolin-2 goes beyond simple coexpression. The two proteins interact tightly to form a very stable high-molecular-mass heterooligomer of ≈14 to 16 individual subunits (42) and are highly colocalized to caveolae. Although caveolin-1 also has the ability to form high-molecular-mass homooligomeric complexes, caveolin-2 remains in a monomer-dimer form in the absence of caveolin-1 (44). Similarly, caveolin-2 is found predominantly localized to plasma membrane caveolae in the presence of caveolin-1 (44). When overexpressed alone, however, caveolin-2 remains trapped in the Golgi compartment and shows reduced expression. Thus, caveolin-2 requires coexpression with caveolin-1 for the proper trafficking of caveolin-2 to the cell surface and plasmalemmal caveolae (28, 33).
Outside of these structural and associative studies, the normal physiological role of caveolin-2 remains enigmatic. Although numerous reports have implicated caveolin-1 in the biogenesis and functioning of caveolae, the exact role of caveolin-2 in these contexts remains unknown. Furthermore, discordance between the expression of caveolin-1 and -2 has never been observed in either normal tissues or primary cultured cells, and as such the selective analysis of caveolin-1 in physiologically significant studies on caveolae has not been achieved.
This is apparent in recent reports on the phenotypic characterization of Cav-1-null mice (4, 36). Cav-1-null mice present with several interesting abnormalities: they lack morphologically identifiable caveolae, they have severe pulmonary dysfunction due to lung parenchymal hyperproliferation, and they have dysfunctional vasoconstrictive-vasodilatory responses secondary to constitutive endothelial nitric oxide synthase activation. In addition, we have recently discovered that caveolin-1 deficiency imparts resistance to diet-induced obesity and marked dyslipidemia in the form of hypertriglyceridemia and dysregulated postprandial free fatty acid levels (35). However, in all Cav-1−/− tissues examined thus far, caveolin-2 levels are also dramatically reduced by ≈95% due to its degradation via the proteasome system (36). We find that the residual caveolin-2 in these Cav-1-null cells remains dissociated from caveolar fractions and instead resides trapped within the Golgi compartment. Therefore, the functional implications of caveolin-1 deficiency in these mice remain confounded by the near-complete ablation of caveolin-2 levels as well.
To directly resolve this issue, we have now generated and performed a detailed characterization of Cav-2-null mice. Importantly, these Cav-2-null mice show little or no change in caveolin-1 protein expression, no abnormalities in caveolin-1 protein trafficking, and no defects in the formation of caveolae. However, these mice do have a subset of the phenotypes described for Cav-1-null mice. Cav-2-null mice show clear pulmonary defects, with alveolar septal thickening, endothelial cell hyperproliferation, and exercise intolerance. In addition, we find that Cav-2-null mice have unperturbed vasoconstrictive-vasodilatory responses and unperturbed body weights and remain normolipidemic, indicating that the vasculature and adipocyte-related phenotypes in Cav-1-null mice are truly caveolin-1 dependent. These findings provide the first direct evidence of a function for caveolin-2 in vivo. Thus, we conclude that the pulmonary phenotype of Cav-1-null mice is secondary to a caveolin-2 deficiency. Importantly, these Cav-2-null mice will also allow us to study the function of caveolin-1 and caveolae in the absence of caveolin-2.
MATERIALS AND METHODS
Materials.
Antibodies and their sources were as follows: anti-caveolin-1 monoclonal antibody (MAb) 2297, anti-caveolin-2 MAb 65, and anti-caveolin-3 MAb 26 (42, 45, 47) (gifts of Roberto Campos-Gonzalez, BD Transduction Laboratories, Inc.); anti-caveolin-1 polyclonal antibody (PAb) N-20 and anti-vascular endothelial growth factor receptor (VEGF-R) PAb C-20 (Santa Cruz Biotechnology); and anti-β-tubulin TUB-2.1 (Sigma).
Construction of targeting vector.
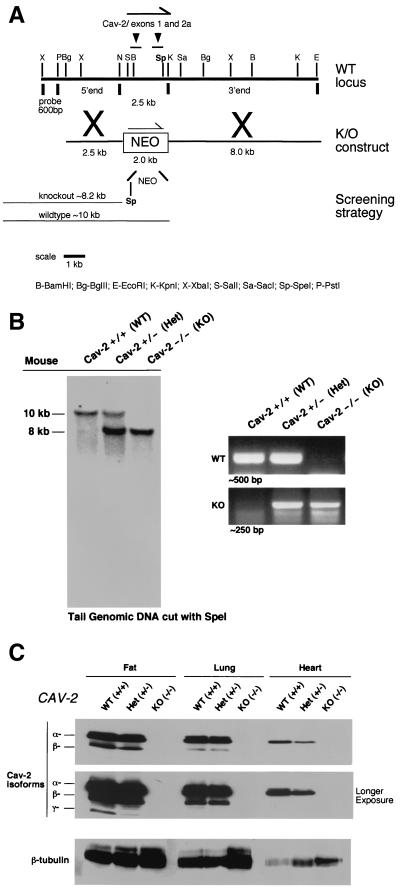
A ≈100-kb bacterial artificial chromosome (BAC) clone containing the caveolin-2 locus was isolated from a mouse ES-129/SvJ II BAC genomic library (Genome Systems, Inc.) by using probes corresponding to the murine caveolin-2 cDNA (6). By subcloning portions of this BAC clone into the vector pBS-SK+ (Stratagene) and using bacterial colony hybridization screening (according to the method of Grunstein and Hogness [16]), smaller fragments containing the caveolin-2 exons were isolated. Further restriction mapping and Southern blotting allowed the determination of the detailed genomic organization for the caveolin-2 locus (Fig. 1) (6). Due to the proximity of the first and second exons of caveolin-2 to one another (383 bp), the targeting vector was designed to ablate these regions in the genome. Briefly, a ≈2.5-kb BglII-NotI fragment that is ≈100 bp 5′ to the first exon and a ≈8.0-kb KpnI-EcoRI fragment that is ≈100 bp 3′ to the second exon of the caveolin-2 gene were used to flank the neomycin resistance cassette (neo) in the targeting vector pGT-N29 (New England Biolabs), as shown in Fig. 1A.
FIG. 1.
Targeted disruption of the caveolin-2 gene produces a null mutation. (A) The caveolin-2 locus (containing the first two exons) and the targeting construct (containing the neomycin resistance cassette [NEO] with flanking segments homologous to the locus) are shown in schematic format in this ≈13-kb map. The transcriptional orientations of the neomycin resistance cassette and the caveolin-2 locus are delineated by arrows. Note that homologous recombination would eliminate a 2.5-kb genomic segment containing caveolin-2 exons 1 and 2 and introduce a new restriction site (SpeI), which was used to screen for positive ES cell clones. The 600-bp XbaI-PstI probe used for Southern blot analysis is located 5′ of the targeting vector, as shown. (B) Southern blot analysis of SpeI-digested tail DNA from offspring of caveolin-2 heterozygote (Het) intercrosses. The ≈8-kb band signifiesthe appropriate targeted disruption of the caveolin-2 locus. The absence of a wild-type (WT) ≈10.0-kb band signifies the generation of the Cav-2-knockout (KO) animal. An alternative PCR-based strategy used to determine the genotype of animals is also shown. The absence of a ≈500-bp wild-type band signifies the generation of a Cav-2-knockout animal. (C) Lysates from three tissue types with various levels of caveolin-2 expression (fat, lung, and heart) were prepared for mice of all three genotypes. Protein (30 μg) was loaded in each lane, subjected to SDS-PAGE, and immunoblotted with anti-caveolin-2 MAb (clone 26). A longer exposure of the same blot is also shown. Equal protein loading was assessed by using the anti-β-tubulin MAb (clone 2.1).
Screening of homologously recombined ES cells and generation of germ line chimeras.
WW6 embryonic stem (ES) cells (gift of Pamela Stanley [18]) were electroporated with the linearized targeting construct (40 μg) and selected with G418 (150 μg of active component per ml; Gibco-BRL), as described previously (5). Homologous recombination in 200 selected ES clones was assessed via Southern blot analysis. Briefly, genomic DNA was digested with SpeI and hybridized with a 600-bp XbaI-PstI probe; Cav-2-positive and -negative clones produced a ≈10.0-kb wild-type and a ≈8.2-kb knockout band (as shown in Fig. 1). Four Cav-2-positive ES clones were microinjected into C57BL/6 blastocysts, of which two gave rise to male chimeras with significant ES contribution (as determined by an agouti coat color). By mating with C57BL/6 females and genotyping of offspring tail DNA via Southern and PCR analysis, germ line transmission was confirmed for two separate clones. F1 male and female heterozygous animals were interbred to obtain caveolin-2-deficient animals. To facilitate the genotyping of all future mice, we also devised a four-primer PCR-based screening strategy. The wild-type-specific forward and reverse primers were derived from Cav-2 exon 1 (5′-CTGGAGACCGAGAAGGCCGATG-3′) and Cav-2 intron 1 (5′-CCAGCATTAGCAATGGGACC-3′), respectively. The knockout-specific forward and reverse primers were derived from the Cav-2 upstream promoter sequence (5′-CCAAGGCTGGGAGCGGGAAC-3′) and the neomycin cassette (5′-CAGAAAGCGAAGGAGCAAAGC-3′). Two separate PCRs (wild-type and knockout) were performed which resulted in a ∼500-bp wild-type and a ∼250-bp knockout band, respectively. PCR conditions were as follows: 95°C for 5 min; 35 cycles of 95°C for 1 min, 54°C for 1 min, and 72°C for 1 min 50 s; and then 72°C for 7 min for both reactions.
Electron microscopic analysis of the lung and adipose tissue.
Lung tissue and perigonadal adipose tissue samples were fixed with 2.5% glutaraldehyde in 0.1 M sodium cacodylate buffer, postfixed with 1% osmium tetroxide followed by 1% uranyl acetate, dehydrated through a graded series of ethanol, and embedded in LX112 resin (LADD Research Industries, Burlington, Vt.). Ultrathin sections were cut on a Reichert Ultracut E, stained with uranyl acetate followed by lead citrate, and viewed on a Jeol 1200EX transmission electron microscope at 80 kV.
Immunoblot analysis.
Freshly dissected tissue samples were washed thoroughly with phosphate-buffered saline (PBS) and either snap-frozen in liquid N2 or immediately homogenized with lysis buffer (10 mM Tris [pH 7.5], 50 mM NaCl, 1% Triton X-100, 60 mM octylglucoside) containing protease inhibitors (Roche Biochemicals). Protein concentrations were quantified with the bicinchoninic acid reagent (Pierce), and the volume required for 10 μg of protein was determined. Samples were separated by sodium dodecyl sulfate-polyacrylamide gel electrophoresis (SDS-PAGE) (12.5% acrylamide) and transferred to nitrocellulose. The nitrocellulose membranes were stained with Ponceau S (to visualize protein bands), followed by immunoblot analysis. All subsequent wash buffers contained 10 mM Tris (pH 8.0), 150 mM NaCl, and 0.05% Tween 20, which was supplemented with 1% bovine serum albumin (BSA) and 2% nonfat dry milk (Carnation) for the blocking solution and 1% BSA for the antibody diluent. Primary antibodies were used at a 1:500 dilution. Horseradish peroxidase-conjugated secondary antibodies (1:5,000 dilution; Pierce) were used to visualize bound primary antibodies with the Supersignal chemiluminescence substrate (Pierce).
Purification of caveola-enriched membrane fractions.
Caveola-enriched membrane fractions were purified essentially as we described previously (41): 200 mg of lung tissue was placed in 2 ml of MES-buffered saline (MBS; 25 mM MES [morpholineethanesulfonic acid, pH 6.5], 150 mM NaCl) containing 1% Triton X-100 and solubilized by using quick 10-s bursts of a rotor homogenizer and passing 10 times through a loose-fitting Dounce homogenizer. The sample was mixed with an equal volume of 80% sucrose (prepared in MBS lacking Triton X-100), transferred to a 12-ml ultracentrifuge tube, and overlaid with a discontinuous sucrose gradient (4 ml of 30% sucrose and 4 ml of 5% sucrose, both prepared in MBS lacking detergent). The samples were subjected to centrifugation at 200,000 × g (39,000 rpm in a TH-641 Sorvall rotor) for 16 h. A light-scattering band was observed at the 5-30% sucrose interface. Twelve 1-ml fractions were collected, and 50-μl aliquots of each fraction were subjected to SDS-PAGE and immunoblotting.
Immunofluorescence microscopy of MEFs.
Primary mouse embryonic fibroblasts (MEFs) were obtained from day 13.5 embryos essentially as described (36). MEFs were fixed for 30 min in PBS containing 2% paraformaldehyde, rinsed with PBS, and quenched with 50 mM NH4Cl for 10 min. The cells were then incubated in permeabilization buffer (PBS with 0.2% BSA and 0.1% Triton X-100) for 10 min, washed with PBS, and double-labeled with a 1:400 dilution of anti-caveolin-1 PAb N-20 and a 1:200 dilution of anti-caveolin-2 MAb for 60 min. After being rinsed three times with PBS, secondary antibodies (7.5 μg/ml) (lissamine-rhodamine [LRSC]-conjugated goat anti-rabbit immunoglobulin [Ig] and fluorescein isothiocyanate [FITC]-conjugated goat anti-mouse Ig) (Jackson Immunochemicals) were added for a period of 60 min. Cells were washed three times with PBS, and slides were mounted with Slow-Fade antifade reagent (Molecular Probes). A Bio-Rad MR600 confocal fluorescence microscope was used for visualization of bound secondary antibodies.
Velocity gradient centrifugation.
Samples were dissociated in MES-buffered saline containing 60 mM octylglucoside. Solubilized material was loaded atop a 5 to 40% linear sucrose gradient and centrifuged at 50,000 rpm for 10 h in an SW60 rotor (Beckman) (40, 42, 44, 49). Gradient fractions were collected from above and subjected to immunoblot analysis. Molecular mass standards for velocity gradient centrifugation were as we described previously (40, 42, 44, 49).
Preparation of lung paraffin sections.
Mice of the indicated genotypes were sacrificed, and the lungs were removed and placed in 10% formalin. The lungs were then inflated by injecting fixative with a syringe directly into the lungs to preserve the alveolar structure. The tissue was fixed for 2 h, washed in PBS for 20 min, and dehydrated through a graded series of ethanol washes. The tissue was then treated with xylene for 40 min at room temperature and then with paraffin for 1 h at 55°C.
The tissue was then embedded, and 5-μm-thick sections were cut using a Microm (Baxter Scientific) microtome and placed on Super-Frostplus slides (Fisher). Slides were then stained with hematoxylin and eosin (H&E) according to standard laboratory protocols. All photographs were taken with a Zeiss digital imaging system.
Quantitation of nuclei.
Sections of lung tissue from mice of the indicated genotypes stained with H&E were examined using a Zeiss Axiophot. Using a 40× objective, five random fields were photographed for each genotype, and all the nuclei within those regions were manually tabulated using a hand-held counter.
Immunostaining of lung paraffin sections.
Sections of lung tissue from mice of the indicated genotypes were deparaffinized in xylene for 4 min, rehydrated through a graded series of ethanol, and placed in PBS. Sections were preblocked with 2% horse serum for 20 min and then washed with PBS for 10 min. The sections were incubated with a given primary antibody at room temperature for 1 h. An FITC-conjugated or LSRC-conjugated secondary antibody was added to the sections after a 10-min wash in PBS. After a 30-min incubation with the secondary antibody, the sections were washed in PBS for 20 min. Prolong antifade reagent was then added to prevent bleaching of the fluorochrome. Samples were imaged with an Olympus IX 70 inverted microscope.
Assessment of exercise tolerance.
A 4-liter beaker filled with water (25°C) was used as a swimming pool to assess the exercise tolerance of male mice. Briefly, a very light weight (a paper clip; 0.4 g; ≈1.25% of their body weight) was attached to the tail of a mouse with a body weight of ≈30 to 32 g. The mouse was gently placed in the water and carefully observed. The time at which the mouse was initially unable to maintain complete buoyancy was recorded, and the mouse was immediately removed from the pool. No mice were injured in these experiments.
Aortic ring studies of vasoconstriction and vasorelaxation.
Mice of the indicated genotypes (4.5 months old) were sacrificed by CO2 asphyxiation. The thoracic aorta was dissected and cut into cylindrical segments of ≈3 mm in length. Five to six rings from three mice were obtained for each genotype. Rings were immediately placed in ice-cold Krebs-Henseleit buffer containing NaCl, 110 mM; KCl, 4.8 mM; CaCl2, 2.5 mM; MgSO4, 1.2 mM; KH2PO4, 1.2 mM; NaHCO3, 25 mM; glucose, 11 mM; and dextrose, 11 mM, in glass-distilled water. Briefly, the rings were suspended by two hooks (25-μm thickness) inserted into the lumen and mounted in a vessel myograph system (7-ml organ bath; Danish Myo Technology, Aarhus, Denmark) containing Krebs-Henseleit buffer. The organ chambers were maintained at 32 ± 0.05°C and continuously bubbled with 95% O2 and 5% CO2 to maintain a pH of 7.4 ± 0.1. The mouse aortas were subjected to a resting tension of 1.2 g, and isometric tension was recorded using a transducer coupled to a MacLab data acquisition system. Following a 60-min equilibration period, with frequent washings (about every 15 min), the rings were constricted with a submaximal concentration of phenylephrine (10 μM), and acetylcholine (10−8 to 10−4 M) or nitro-l-arginine methyl ester (l-NAME) (100 μM) was injected when the phenylephrine contractile response achieved steady state (≈5 min).
Analysis of plasma metabolites and lipoproteins.
Mouse plasma was drawn from the tail vein and decanted directly into heparinized capillary tubes (Fisher Scientific). Where indicated, fasting blood samples were collected at 7:00 a.m., 12 h after removal of the food, and postprandial blood samples were collected at 12:00 a.m., 3 h after the beginning of the room's dark cycle. Glucose, cholesterol, triglyceride, and free fatty acid levels were measured with standard enzymatic colorimetric assays (Sigma and Wako Biochemicals).
Statistical analysis.
All results are presented as the mean ± standard error of the mean. Except where noted, the statistical significance of the data was determined via the two-tailed Student t test using Microsoft Excel.
RESULTS
Generation of caveolin-2-deficient mice via targeted disruption of the caveolin-2 locus.
We previously determined the genomic organization of the caveolin-2 locus and found that exons 1 and 2 are spaced within ≈383 bp of each other, while exon 3 is further downstream (7, 8). Therefore, we generated a targeting vector designed to replace the first two exons and a small portion of the 5′ promoter sequence with the neomycin resistance cassette (neo) (Fig. 1A).
WW6 ES cells (18) were electroporated with the targeting vector, and 200 clones were selected with G418. Homologous recombination at this locus is predicted to create a new restriction site, SpeI, which can be used to identify positive ES cell clones by Southern blot analysis (Fig. 1A). Six clones were determined to be positive in this manner; germ line chimeras were derived from two of these clones. We subsequently back-crossed these chimeras with C57BL/6 mice to yield heterozygous offspring, a cohort of which were interbred to produce the Cav-2-null progeny. Southern blot and PCR-based methods of assessing the targeted locus were performed on the first series of live offspring, confirming the predicted loss of a wild-type 10.0-kb band on Southern and the 500-bp band on PCR analysis (Fig. 1B). Genotyping of offspring from such heterozygous intercrosses revealed that there is no reduced viability of the Cav-2-null mice and that mice of all three genotypes are present at the expected Mendelian frequency (Cav-2+/+, 24.5%; Cav-2+/−, 48.1%; Cav-2−/−, 27.4%; n = 310 animals).
Although caveolin-2 is expressed in numerous tissues at various levels, it is found in abundance in all locations expressing caveolin-1 (terminally differentiated cells, namely, adipocytes, endothelial cells, type I pneumocytes, smooth muscle cells, and fibroblasts) (42, 44). Furthermore, caveolin-2 expression is completely absent in striated skeletal and cardiac muscle cells, where, in contrast, caveolin-3, another member of the caveolin gene family, is selectively expressed (42, 47). In order to verify whether the targeted disruption of the caveolin-2 locus led to a truly null mutation, we determined the expression of the caveolin-2 protein in adipose, lung, and heart tissue from mice of all three genotypes (wild type, heterozygote, and knockout; Fig. 1C). In all tissues examined, ablation of the caveolin-2 locus leads to a concomitant loss of caveolin-2 protein expression; β-tubulin is shown as an equal protein-loading control.
In addition, several points are worth noting: (i) these mice are deficient in all caveolin-2 isoforms (the full-length 162-amino-acid α- and the shorter β- and γ-isoforms [42]), (ii) the ablation of the caveolin-2 locus in only one chromosome, as in the heterozygous animals, is sufficient to partially reduce protein levels, and (iii) although caveolin-2 is expressed in the cardiac tissue of wild-type and heterozygous mice (Fig. 1C), caveolin-2 expression is derived from endothelial and fibroblastic cells within the heart and not the cardiac myocytes themselves (42).
Absence of caveolin-2 affects caveolin-1 expression in certain tissues but does not perturb its ability to localize to and form caveolae.
The molecular components required for caveolar biogenesis have been studied by numerous investigators. Based on several observations, the general consensus remains that caveolin-1 plays an essential role in the formation of caveolae. Downregulation of caveolin-1 in H-Ras- and v-Abl-transformed NIH 3T3 fibroblasts or by antisense strategies results in a concomitant reduction in caveolae at the membrane (12, 21), while overexpression of caveolin-1 in a lymphocytic cell line, cells that do not endogenously express the protein, is sufficient to allow the formation of caveolae (10). Conclusive evidence was recently provided when it was shown that caveolin-1-deficient mice also lack caveolae (4, 36).
Despite the clear requirement for caveolin-1, the physiological role of caveolin-2 in this process remains unknown. Transformed fibroblasts have a nearly complete loss of caveolin-1 expression and the formation of caveloae, yet still express normal levels of caveolin-2 (12, 21). Therefore, it is implied that the presence of caveolin-2 alone is not sufficient to form caveolae. However, given that caveolin-1 and caveolin-2 are highly interdependent in vivo (i.e., they are coexpressed and interact in heterooligomeric complexes in all tissues examined), the dispensability of caveolin-2 for the formation of caveolae is not known. In this regard, analysis of Cav-1-null mice failed to provide any insights, as caveolin-2 protein levels are severely reduced due to caveolin-2 destabilization and its subsequent proteasomal degradation (36).
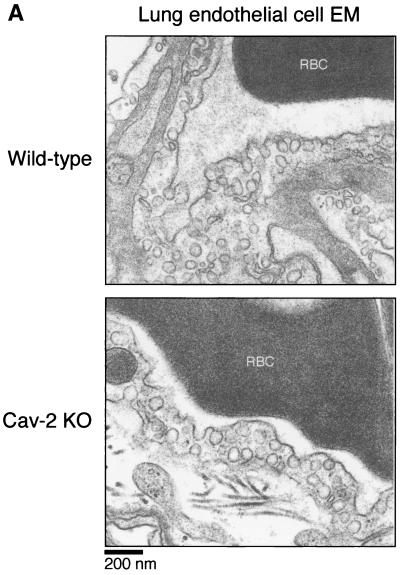
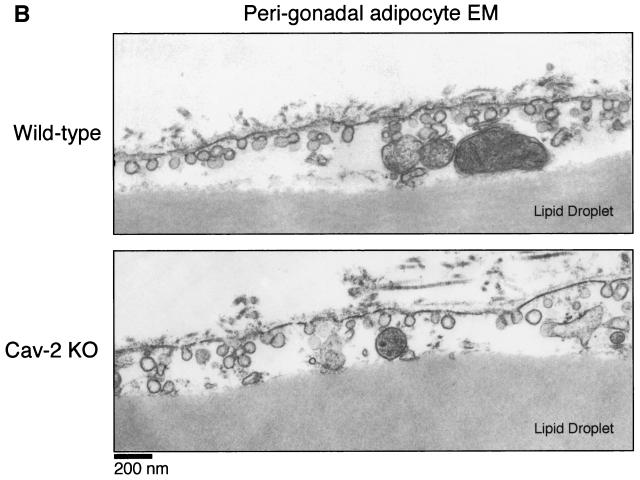
Thus, the generation of Cav-2-null mice provided us with the opportunity to test this assertion under physiological conditions. We chose the two tissue and cell types most abundantly expressing caveolae (perigonadal adipocytes and lung endothelial cells) and used standard transmission electron microscopy to visualize the plasma membrane (Fig. 2A and 2B). Caveolar microdomains (in the form of omega-shaped membrane-bound flasks and juxtamembrane vesicles) were present in adipocytes and endothelial cells of all genotypes, indicating that a loss of caveolin-2 does not affect the formation of caveloae.
FIG. 2.
Caveolae are not disrupted in caveolin-2-deficient mice. Lung and perigonadal adipose tissue were processed from wild-type and Cav-2-null mice for transmission electron microscopy (EM), as detailed in the text. Analyses were performed at 30,000× and 16,000× magnifications for lungs and adipose tissue, respectively (for ease of view, the images shown were magnified further). The plasma membranes of numerous cells were scanned for caveolae, defined as uniform 50- to 100-nm flask-shaped membrane invaginations. The scale bar is shown at the lower left corner. RBC, red blood cell.
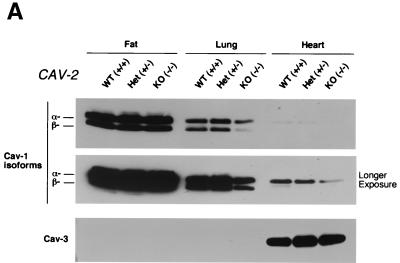
As the caveolin gene family comprises caveolin-1, -2, and -3, we were interested to determine any possible counterregulatory or compensatory behavior by caveolin-1 and caveolin-3 in Cav-2-null tissues. We immunoblotted the same tissue samples used to compare caveolin-2 expression in mice of different genotypes (Fig. 1C) for caveolin-1 and caveolin-3. Caveolin-1 expression appeared to be reduced to various levels in certain Cav-2−/− tissues (Fig. 3A). For example, although adipose tissue showed no decrease in caveolin-1 expression, both lung and heart showed a nearly twofold reduction in caveolin-1 expression. Caveolin-3 levels remained unperturbed, however, and showed the expected expression pattern (i.e., muscle-specific expression) (Fig. 3A). Since in caveolin-2 heterozygous animals caveolin-1 levels remain unperturbed despite a reduction in caveolin-2 (Fig. 1C), it seems that the absence of but not the reduction in caveolin-2 is sufficient to cause a modest decrease in caveolin-1 levels in vivo. In support of these current findings, we have previously shown that transient expression of the cDNA encoding caveolin-2 in CHO cells upregulates the endogenous expression level of caveolin-1 by ≈2-fold (33), while transient expression of caveolin-3 under identical conditions does not affect caveolin-1 expression levels.
FIG. 3.
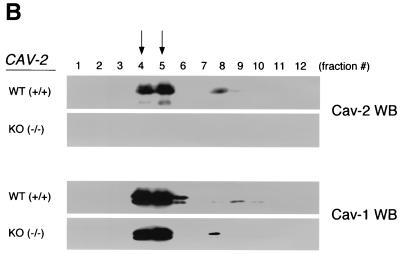
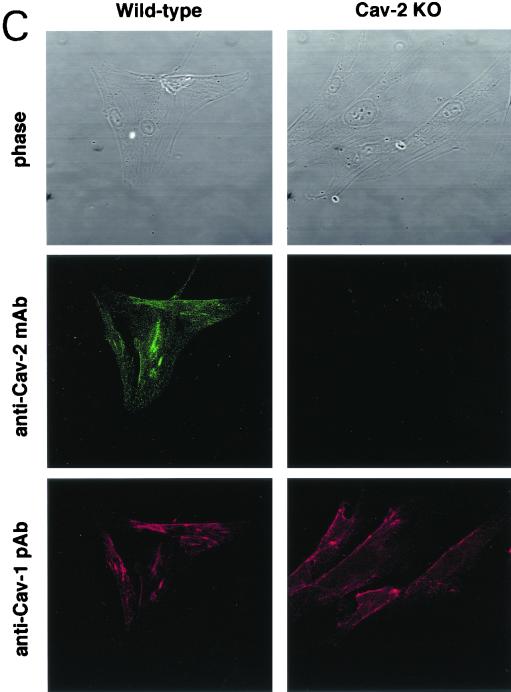
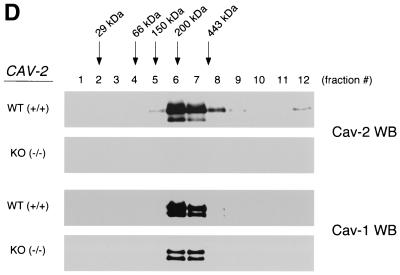
Caveolin-1 expression is mildly reduced but caveolin-1 remains localized to plasma membrane caveolae in Cav-2-null mice. (A) Lysates (30 μg) from the tissues shown in Fig. 1C were loaded in each lane, subjected to SDS-PAGE, and immunoblotted with anti-caveolin-1 MAb (clone 2297) and anti-caveolin-3 MAb (clone 65). A longer exposure of the same blot is also shown. Both caveolin-1 and caveolin-3 are expressed in Cav-2-knockout (KO) mice; however, caveolin-1 expression shows a mild reduction in some tissues (≈50% of wild-type levels in lung and heart). Equal protein loading was assessed using the anti-β-tubulin MAb (clone 2.1). (B) Lung tissue from wild-type (WT) and Cav-2-knockout mice was homogenized thoroughly in lysis buffer containing 1% Triton X-100 and subjected to sucrose gradient centrifugation, a procedure that separates caveolar microdomains from other cellular constituents (23). Twelve fractions, of which fractions 4 to 5 and 8 to 12 are considered of caveolar and noncaveolar origin, respectively, were collected and subjected to SDS-PAGE. Immunoblotting with anti-caveolin-2 MAb (clone 26) and anti-caveolin-1 MAb (clone 2297) was used to determine the localization of caveolin-2 and caveolin-1 in these gradient fractions. Arrows point at the caveola-enriched gradient fractions (4 and 5). (C) Formaldehyde-fixed wild-type and Cav-2-knockout MEFs were doubly immunostained with anti-caveolin-1 PAb (N20) and anti-caveolin-2 MAb (clone 26). Bound primary antibodies were visualized with distinctly tagged secondary antibodies (see text). (D) Lung tissue samples from wild-type and Cav-2-knockout mice were homogenized thoroughly in lysis buffer containing 60 mM octylglucoside and subjected to velocity gradient centrifugation, an established procedure that allows the assessment of the size of caveolin oligomers (40, 42, 44, 49). Briefly, solubilized material was loaded atop a 5 to 40% sucrose density gradient and subjected to centrifugation for 10 h. Twelve fractions were recovered, and a 20-μl aliquot from each fraction was analyzed by SDS-PAGE and Western blotting with anti-caveolin-2 MAb (clone 26) and anti-caveolin-1 MAb (clone 2297). Arrows mark the positions of molecular mass standards. Note that caveolin-1 migrates as a high-molecular-mass oligomer of ≈200 to 400 kDa (see fractions 6 and 7) in both wild-type and Cav-2-knockout lung tissue samples. Thus, caveolin-2 expression is not required for the formation of high-molecular-mass caveolin-1 oligomers. Upper panels, caveolin-2 immunoblots; lower panels, caveolin-1 immunoblots.
The in vivo relationship between caveolin-1 and caveolin-2 is unique. Although caveolin-1 is able to form homooligomers consisting of ≈14 to 16 individual molecules (26, 27), it is also capable of forming similar-sized heterooligomers with caveolin-2 (2, 42) and colocalizes with caveolin-2 in caveolae (42). At present, it is not known how caveolin-1 would behave in the absence of caveolin-2. The generation of caveolin-2-deficient mice provided us the opportunity to definitively resolve this possible requirement in vivo.
Due to the abundance of type I pneumocytes and endothelial cells, lung tissue is a great source for the purification and molecular analysis of caveolae (23). In order to determine the localization of caveolin-1 in Cav-2-null mice, we subjected mouse lung tissue to extraction and sucrose gradient ultracentrifugation, a procedure with which we have previously separated caveolar microdomains from other cellular constituents. Via this method, it is possible to dramatically concentrate caveolin-1 and caveolin-2 with respect to total cellular protein (23, 48). The outputs of this centrifugation consist of 12 equal fractions (of which fractions 4 to 5 and 8 to 12 are considered to be of caveolar and noncaveolar origin, respectively). As shown in Fig. 3B, caveolin-1 and -2 are enriched heavily in the caveolar fractions of wild-type lungs. Similarly, in caveolin-2-deficient lungs, caveolin-1 remains biochemically associated with caveloae.
We also approached this issue morphologically by looking at the subcellular localization of caveolin-1 in primary MEFs, cells that have been widely used for the study of caveolin-1 and -2. Figure 3C shows a series of micrographs of wild-type and Cav-2-knockout MEFs coimmunostained with anti-caveolin-1 polyclonal and anti-caveolin-2 monoclonal antibodies. There is a distinct and overlapping membrane localization for caveolin-1 and -2 in wild-type cells; similarly, caveolin-1 maintains its punctate plasma membrane localization in caveolin-2-deficient MEFs (Fig. 3C). Based on the above results, we conclude that in the absence of caveolin-2, caveolin-1 levels are modestly decreased, but not critically enough to abrogate its normal localization to plasma membrane caveolae or its ability to form caveolae.
Purified caveolin-1 exists as a high-molecular-mass homooligomer of ≈200 to 350 kDa when recombinantly produced in a bacterial expression system (22, 40). However, endogenous caveolin-1 heterooligomerizes with caveolin-2 in vivo to form similar high-molecular-mass oligomers (2, 42). Thus, it remains unknown whether caveolin-1 normally requires caveolin-2 to form these high-molecular-mass oligomers in vivo. To address this issue directly, we next used velocity gradient centrifugation to assess the oligomeric state of caveolin-1 in lung tissue samples derived from wild-type and Cav-2-null mice. Interestingly, Fig. 3D shows that solubilized caveolin-1 migrates as a high-molecular-mass oligomer of ≈200 to 400 kDa (see fractions 6 and 7; lower panels) in both wild-type and Cav-2-knockout lung tissue samples. Thus, caveolin-2 expression is not required for the formation of high-molecular-mass caveolin-1 oligomers. These results are consistent with our previous in vitro data showing that bacterially expressed-purified recombinant full-length caveolin-1 does not require coexpression with caveolin-2 to form high-molecular-mass oligomers of ≈200 to 350 kDa (22).
Phenotypic and histological examination of Cav-2−/− mice reveals severe lung pathology.
Cav-2-null mice are both viable and fertile. We initially established a large cohort consisting of mice from all genotypes, the eldest of which are now 12 months of age. Although no overt phenotypic abnormalities have been detected, routine histopathological examination of Cav-2-null mice at 4 to 5 months of age (n = 4 male and 4 female) showed several important findings in lung tissue.
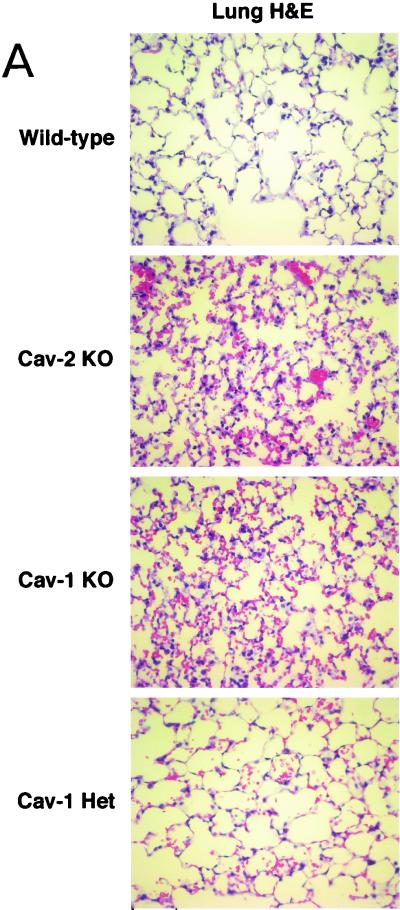
Figure 4A (upper two panels) shows H&E-stained sections of lung parenchyma from wild-type and caveolin-2-deficient animals. Note that in caveolin-2-deficient mice, the alveolar spaces appeared significantly smaller or constricted, with thickened alveolar septa and hypercellularity. These lung defects are strikingly similar to the ones recently reported for the caveolin-1-deficient mice (4, 36) and led us to do a direct age-matched, sex-matched comparison between the lungs of Cav-2-null and Cav-1-null mice. The lungs are histologically indistinguishable, with caveolin-1-deficient lungs displaying similar degrees of hypercellularity, alveolar constriction, and septal thickening (Fig. 4A).
FIG. 4.
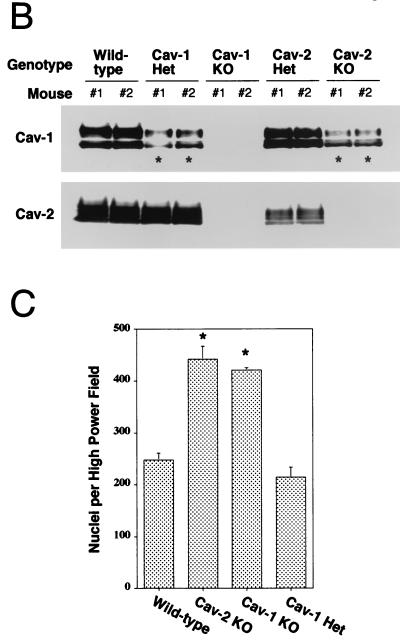
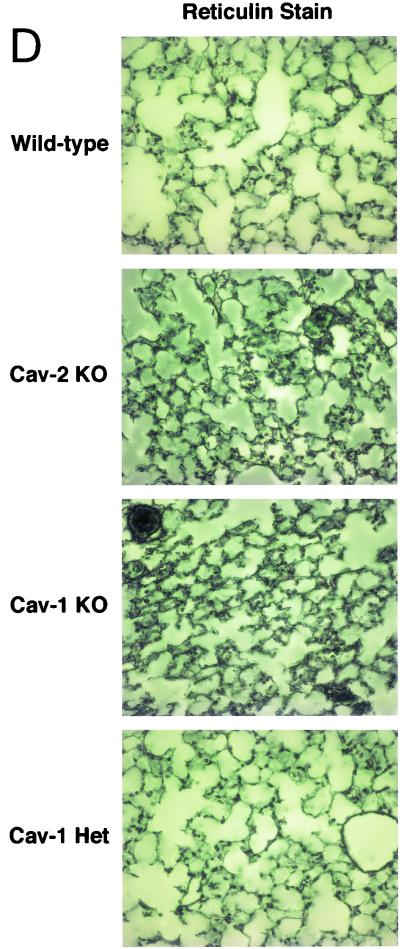
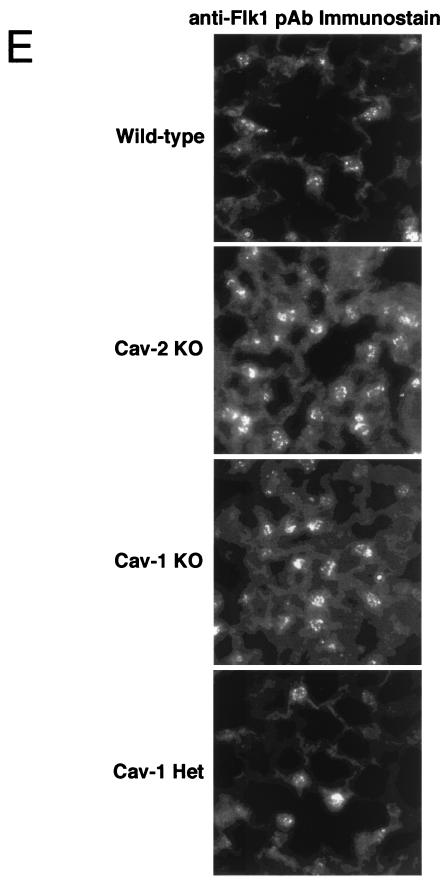
Caveolin-2-deficient mice show lung abnormalities identical to those of caveolin-1-deficient mice. (A) Routine histology (H&E) was performed on lung tissue from mice of four different genotypes, wild type (WT), Cav-2-knockout (KO), Cav-1-knockout, and caveolin-1 heterozygote (Het), and examined using a Zeiss Axiophot with a 40× objective. (B) Lysates from lung tissue were prepared from two mice of each of the four different genotypes (wild-type, Cav-2-null, Cav-1-null, and caveolin-1 heterozygote). A total of 30 μg of protein was loaded in each lane, subjected to SDS-PAGE, and immunoblotted with anti-caveolin-1 MAb (clone 2297) and anti-caveolin-2 MAb (clone 26). Note that caveolin-1 heterozygote mice and Cav-2-null mice show the same levels of caveolin-1 protein expression (asterisks). (C) Wild-type, Cav-2-null, Cav-1-null, and caveolin-1 heterozygote mouse lung tissue sections stained with H&E were examined using a Zeiss Axiophot. Via the 40× objective, five random fields were photographed for each genotype, and all the nuclei within those regions were manually tabulated with a hand-held counter. (D) Wild-type, Cav-2-null, Cav-1-null, and caveolin-1 heterozygote mouse lung tissue sections were subjected to reticulin staining (a major component of basement membranes) and examined using a Zeiss Axiophot with a 40× objective. (E) Lung paraffin sections from wild-type, Cav-2-null, Cav-1-null, and caveolin-1 heterozygote mice were immunostained with an endothelial marker, anti-VEGF-R (Flk-1) IgG. Bound primary antibodies were detected with a fluorescently labeled secondary antibody.
The highly surprising nature of these findings raises certain pivotal questions. It is clear that Cav-1-null mice have a severe reduction in caveolin-2 levels in all tissues examined, including the lung (4, 36). Thus, the direct implications of caveolin-1 deficiency in the observed lung pathology remained confounded. However, although the mice described here are purely caveolin-2 deficient, they still have a nearly twofold decrease in caveolin-1 levels. We are fortunate in this respect, based on our previous analysis of caveolin-1 heterozygous mice; levels of caveolin-1 in these heterozygous mice are also decreased by approximately twofold, with no effect on caveolin-2 levels (36). Figure 4B shows an immunoblot analysis of caveolin-1 and -2 in mice of all possible caveolin genotypes and demonstrates the comparable levels of caveolin-1 in Cav-1+/− and Cav-2−/− mice. Therefore, if any of the lung abnormalities are caveolin-1 related, the caveolin-1 heterozygous mice should manifest them to the same degree. In contrast, the lungs of Cav-1+/− mice are entirely normal (Fig. 4A, lower panel), definitively implicating caveolin-2 in this hypercellular “restrictive-type” lung disorder.
We next quantified the apparent hypercellularity in Cav-2-null mice more rigorously using H&E-stained paraffin sections by manually counting the number of nuclei per high-power field. As expected, both Cav-2- and Cav-1-null mice had increases in cell number (nearly twofold) compared to their wild-type or caveolin-1 heterozygous counterparts (Fig. 4C).
The recent reports of Cav-1-null mice had also indicated an increased extracellular matrix deposition, albeit of differing composition. The study of Drab et al. noted enhanced fibrosis (in the form of trichrome-stainable collagen), while the study of Razani et al. noted enhanced reticulin staining (indicative of increased basement membrane deposition) with little or no fibrosis. We used similar staining methods on wild-type, Cav-2-null, Cav-1-null, and caveolin-1 heterozygous mice and found markedly elevated reticulin deposition in both Cav-2- and -1-deficient mice, but not in the control or Cav-1+/− mice (Fig. 4D). In contrast, trichrome staining of these lungs showed no evidence of collagen deposition (data not shown), leading us to conclude that a deficiency in caveolin-2 can lead to a reactive deposition or reorganization of the basement membrane, but not fibrosis.
As endothelial cells are one of the major cell types in lung tissue and are known to normally express high levels of caveolin-1 and -2, we examined the status of lung endothelial cells in wild-type, Cav-2-null, Cav-1-null, and caveolin-1 heterozygous animals. Transmission electron microscopy revealed that endothelial cells from both wild-type and Cav-2-null mice contain an abundance of caveolae (Fig. 2A). Thus, we used antibodies to VEGF-R (Flk-1) as a marker for endothelial cells. Immunostaining of paraffin sections with anti-VEGF-R IgG revealed that the number of lung endothelial cells was similarly increased in both Cav-2- and Cav-1-null animals. For example, in wild-type and Cav-1+/− animals, we routinely observed ≈4 to 6 VEGF-R-positive endothelial cells per 40× field, while in Cav-2-null and Cav-1-null animals there were ≈15 to 20 VEGF-R-positive endothelial cells per 40× field. Representative images for each genotype are shown in Fig. 4E. Thus, we conclude that a major fraction of the observed hypercellularity is due to endothelial cells.
In contrast to caveolin-1-deficient mice, vasoconstriction and vasorelaxation responses in caveolin-2-deficient mice are not altered.
From the above results, it is obvious that a selective loss of caveolin-2 can mirror one of the major phenotypes of Cav-1-null mice. This led us to examine several of the other positive findings described in caveolin-1-deficient animals in the hope of determining the relative contributions from caveolin-1 and caveolin-2 to the observed phenotypes.
In vitro studies have shown that caveolin-1 functions as a tonic inhibitor of endothelial nitric oxide synthase (13, 19, 25). A physiological verification of these results was presented in the analysis of Cav-1-null mice, where we and others showed a blunted response of caveolin-1-deficient aortic vessels to vasoconstrictive agents and a hyperreactivity to nitric oxide-mediated vasorelaxation (4, 36).
Using the same apparatus from our previous caveolin-1 study, we assessed the vascular tone of isolated mouse aortic rings in response to vasoconstriction or vasorelaxation. For this purpose, we employed phenylephrine (an α1-adrenergic receptor agonist) as a vasoconstrictor, and acetylcholine to induce nitric oxide-dependent relaxation. To demonstrate a selective role for endothelial nitric oxide synthase in these physiological responses, we took advantage of the availability of a well-characterized arginine-based nitric oxide synthase inhibitor, known as l-NAME (nitro-l-arginine methyl ester).
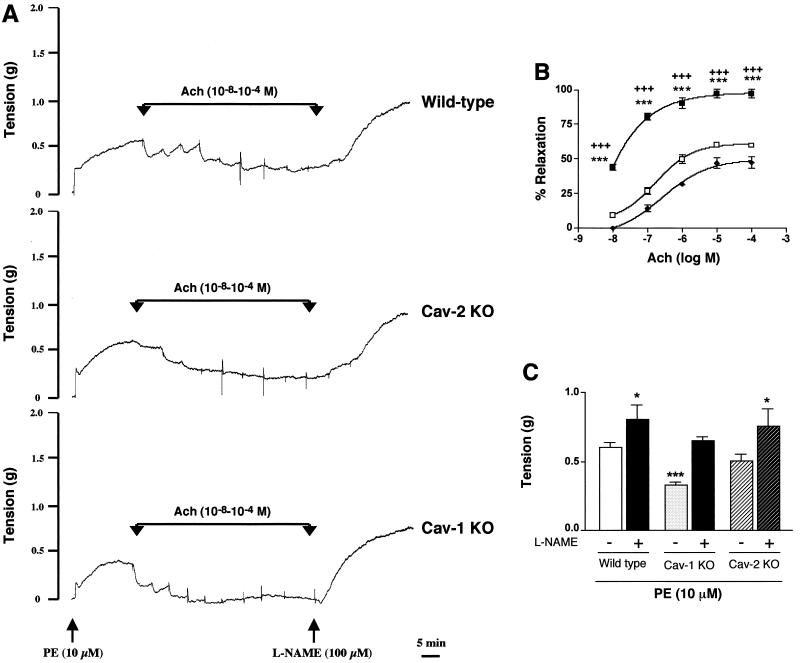
As shown in Fig. 5, in contrast to Cav-1-null mice, aortic rings isolated from the Cav-2-null mice were not significantly different from their wild-type counterparts in all parameters examined. The results of representative experiments on aortic rings from each genotype (wild type versus caveolin-2 KO versus caveolin-1 KO) are shown in Fig. 5A. As illustrated, when the phenylephrine-induced contractile response achieved steady state, a cumulative dose-response curve was constructed for acetylcholine-induced relaxation. Following the construction of the acetylcholine dose-response curve, l-NAME was added to all rings.
FIG. 5.
Caveolin-2-deficient mice do not show abnormal nitric oxide-dependent modulation of aortic contraction. (A) Representative traces of wild-type, Cav-2-knockout (KO), and Cav-1-knockout concentration-dependent acetylcholine (Ach, 10−8 to 10−4)-induced relaxation, followed by addition of l-NAME (100 μM), which induced further contraction of the mouse aorta. Note the appearance of spontaneous oscillatory contractions in the acetylcholine dose-response curve in aortic rings from the wild-type and Cav-2-knockout mice, and their absence from tracings obtained on aortic rings from the Cav-1-null mouse. As such, for comparative purposes, the percent relaxation (B) was calculated from the steady-state trough of relaxation observed for each acetylcholine concentration. The arrows indicate the times of addition of increasing amounts of acetylcholine (10−8, 3 × 10⁻⁸, 10−7, 3 × 10⁻⁷, 10−6, 3 × 10⁻⁶, 10−5, 3 × 10⁻⁵, and 10−4 M). PE, phenylephrine. (B) Concentration-dependent relaxation induced by acetylcholine (Ach) in aortas constricted with 10 μM phenylephrine from wild-type (⧫), Cav-1-knockout (KO) (▪), and Cav-2-knockout (□) mice. Points represent mean ± standard error of the mean for 11 (wild-type), 6 (Cav-1-knockout), and 7 (Cav-2-knockout) rings from three mice each. ∗∗∗, P < 0.0001, Cav-1 knockout versus wild type. +++, P < 0.0001, Cav-1 knockout versus Cav-2 knockout. (C) l-NAME (100 μM) modulation of phenylephrine (PE)-induced contraction in mouse aorta from wild-type, Cav-1-null, and Cav-2-null mice. Points represent the mean ± standard error of the mean for 11 (wild-type), 6 (Cav-1-knockout), and 7 (Cav-2-knockout) rings from three mice each. ∗, P < 0.05, and ∗∗∗, P < 0.0001 versus wild-type control with no l-NAME treatment, two-way analysis of variance for repeated measures.
The steady-state maximal tension response to phenylephrine in the wild-type aortic rings was identical to that observed for Cav-2-null mice, while both were nearly twofold greater than the corresponding phenylephrine-induced contractile response in aortic rings from the Cav-1-null mice (Fig. 5B, P < 0.05). In addition, acetylcholine induced a concentration-dependent relaxation response in aortic rings from mice of all three genotypes. However, significantly greater acetylcholine-induced relaxation was observed in aortic rings from the Cav-1-null mice than in aortic rings from the wild-type or Cav-2-null mice at all acetylcholine concentrations examined (Fig. 5A and B).
Finally, after addition of l-NAME, the steady-state contractile response in the continuing presence of phenylephrine was enhanced in aortic rings from mice of all three genotypes; however, the increase was significantly greater for the Cav-1-null mice (Fig. 5A and C). Moreover, the steady-state phenylephrine-induced contractile response after addition of l-NAME was indistinguishable for all three types of mice.
In summary, we observed that Cav-2-null mice show unremarkable differences in both vasoconstrictive and vasodilatory responses to phenylephrine and acetylcholine, respectively. However, in line with a selective role for caveolin-1 in endothelial nitric oxide synthase inhibition, Cav-1-null mice had impaired vasoconstrictor and potentiated vasorelaxation responses that could be restored by treatment with l-NAME, a well-characterized nitric oxide synthase inhibitor. Therefore, we conclude that tonicity in the vasculature is exclusively a Cav-1-mediated event.
Cav-2-null mice have severe exercise intolerance.
Caveolin-1-deficient mice have been found to be exercise intolerant (4, 36). Although this observation was initially attributed to the histologically abnormal lungs, a confounding variable is the finding that Cav-1-null vasculature is also hyperresponsive to vasodilatory agents. Their lack of exercise capacity could simply be a result of inefficient vessel reactivity (i.e., an inability to shunt arterial blood flow to metabolically active organs). Since Cav-2-null mice have the same lung pathology as Cav-1-knockouts but normal vascular responses, we grossly assessed the possible physical consequences of these lung abnormalities by subjecting these animals to a swimming test. In this way, we could directly compare the exercise tolerance of wild-type, caveolin-1-deficient, and caveolin-2-deficient mice.
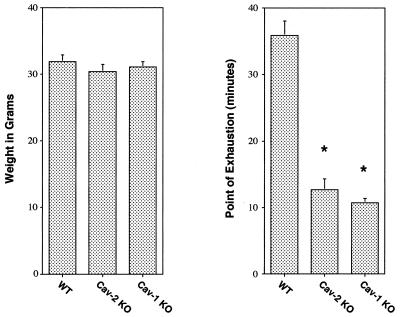
Figure 6 shows that wild-type animals were able to swim for up to ≈40 min, while both caveolin-2- and caveolin-1-deficient animals were exhausted after only ≈10 to 12 min. Thus, caveolin-2- and caveolin-1-deficient mice clearly show comparable levels of exercise intolerance compared with their weight-, age-, and sex-matched wild-type littermates. Given the lack of vascular compromise in the Cav-2-null animals, we conclude that the hyperproliferative lung disorder is the primary determinant of this impaired exercise capacity.
FIG. 6.
Caveolin-2-deficient mice exhibit inadequate exercise capacity. Weight-matched and age-matched (4.5 months) male wild-type (n = 8), Cav-2-knockout (KO) (n = 5), and Cav-1-knockout (n = 5) mice were subjected to a swimming test (see Materials and Methods). Note that wild-type animals were able to swim for up to 40 min (gauged as the point of exhaustion), while both caveolin-1- and caveolin-2-deficient animals swam for only approximately 8 to 12 min (a ≈3- to 4-fold change). Thus, both caveolin-1- and caveolin-2-deficient mice clearly show exercise intolerance, as would be predicted from their similar morphological lung abnormalities.
In contrast to caveolin-1-deficient mice, Cav-2-null mice have normal body weights, adipose tissue morphology, and serum metabolites.
Caveolar organelles and caveolin-1 and -2 protein expression are most abundant in adipocytes (9, 29, 42-44). There are possible functional consequences for such high caveolin expression in adipocytes. Photoaffinity labeling has identified caveolin-1 as a major plasma membrane fatty acid-binding protein in adipocytes (14, 51). Furthermore, caveolin-1 moves from the plasma membrane to lipid droplets in response to free fatty acids (30, 34), and the β-isoform of caveolin-2 is constitutively localized to lipid droplets in certain cell types (11). As such, the caveolins are the first known integral membrane protein components of lipid droplets. If caveolin-1 and -2 have a role in lipid droplet homeostasis, the absence of either protein could lead to perturbations in the balance between lipolysis and lipogenesis.
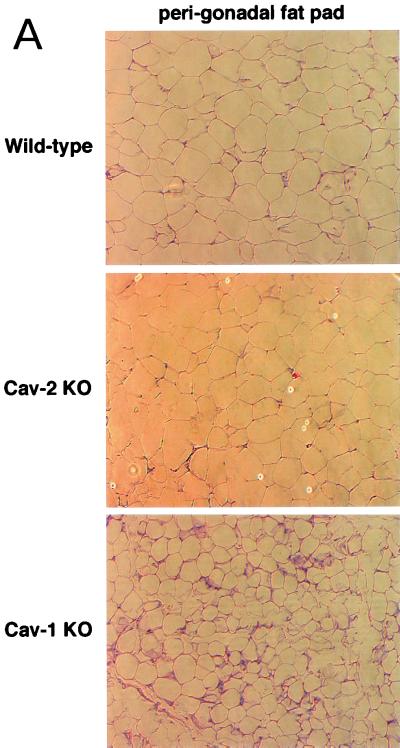
Recently, our follow-up of caveolin-1-deficient cohorts into old age revealed significantly lower body weights compared to wild-type controls. We went on to show that caveolin-1-deficient mice have problems with lipid metabolism and adipocyte function (35). Initially, young Cav-1-knockout mice have a partial lipodystrophic phenotype, with severe reductions in two major fat depots, the hypodermal fat layer and the mammary fat pad. In addition, Cav-1-null mice are hypertriglyceridemic and resistant to diet-induced obesity. With increasing age, a systemic decompensation in lipid accumulation occurs in Cav-1-null mice, resulting in significant reductions in all fat pads examined, with histologically smaller adipocytes and a poorly differentiated hypercellular adipose parenchyma (see Fig. 7A, lower panel). Lipid droplet size in Cav-1-null adipocytes is generally ≈2- to 3-fold smaller than in wild-type adipocytes.
FIG. 7.
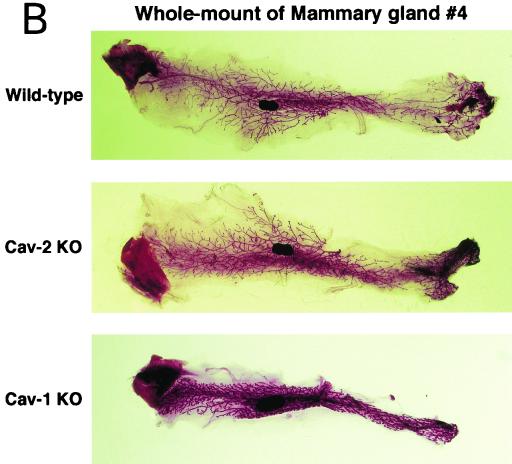
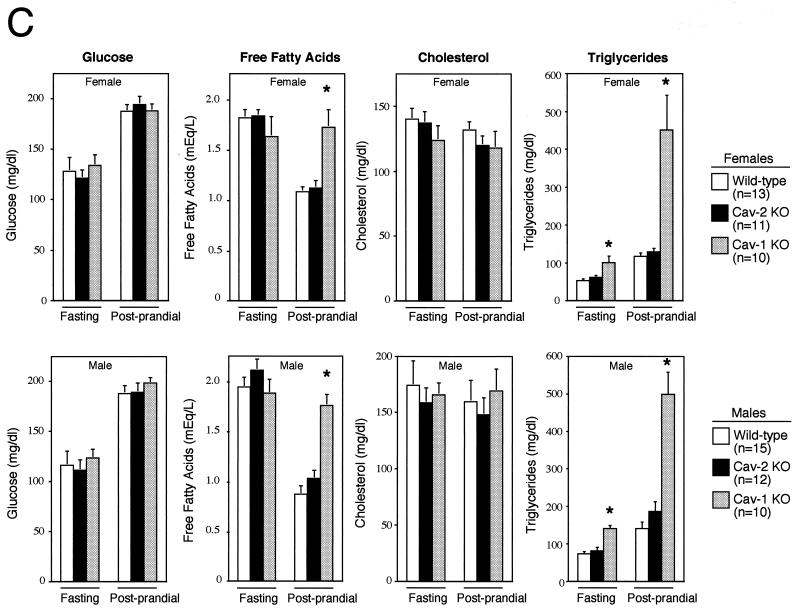
Cav-2-null mice have normal body weights, adipose tissue morphology, and serum metabolites. (A) Routine histology (H&E) was performed on several different adipose tissue regions (perigonadal fat pads are shown) of 1-year-old wild-type and Cav-2-null mice, an age at which the adipose tissue of Cav-1-null mice has been shown to display heterogeneously sized adipocytes, marked interstitial fibrosis, and hypercellularity. No differences between wild type and Cav-2 knockouts (KO) are apparent. (B) The entire left-side mammary gland 4 of wild-type, Cav-2-knockout, and Cav-1-knockout females was dissected and subjected to whole-mount preparation. Carmine dye staining of the mammary tissue allowed visualization of the ductal architecture and density. (C) Fasting blood samples were collected at 7:00 a.m. (12 h after removal of food) and postprandial blood was collected at 12:00 a.m. (after 3 h of feeding in the dark) from 3-month-old wild-type, Cav-2-knockout (KO), and Cav-1-knockout cohorts. Glucose, cholesterol, triglyceride, and free fatty acid levels in plasma were measured colorimetrically.
Again, as the Cav-1-null mice also have a drastic reduction in caveolin-2 levels, it is not clear which protein is the actual culprit in this perturbed lipid homeostasis phenotype. In order to directly compare the ability of wild-type, Cav-2-null, and Cav-1-null mice to gain weight, we first assessed weight differences in a cohort of mice at two different time points, 3 months and 12 months of age. Although mice of all three genotypes had similar weights at 3 months of age, there was a gradual size difference that emerged between the Cav-1-null and either wild-type or Cav-2-null mice (Table 1). At 12 months, the caveolin-1-deficient mice were on average ≈5 to 7 g (or >15% of body weight) lighter. A thorough analysis of organ weights in these mice indicated that the fat pads in Cav-1-null mice are the primary organ system with significantly reduced size and weight; in contrast, the fat pads in Cav-2-null mice are comparable in size and weight to those of wild-type mice (data not shown). These results show that resistance to obesity is exclusively a Cav-1-dependent process, with no contribution from caveolin-2.
TABLE 1.
Body weights of mouse cohorts at two different ages
| Age (mo) | Mean body wt (g) ± SEMa
|
|||
|---|---|---|---|---|
| Gender | Wild type (n = 10) | Cav-2 knockout (n = 10) | Cav-1 knockout (n = 10) | |
| 3 | Female | 19.9 ± 0.5 | 19.8 ± 0.4 | 18.6 ± 0.7 |
| Male | 27.7 ± 1.3 | 26.4 ± 0.8 | 27.0 ± 1.9 | |
| 12 | Female | 39.8 ± 2.6 | 41.5 ± 3.2 | 33.0 ± 2.1* |
| Male | 45.4 ± 2.1 | 46.1 ± 2.8 | 40.1 ± 1.1* | |
* indicates statistical significance (P < 0.05).
We also conducted a histopathological evaluation of adipose tissues in Cav-2-null mice, with the purpose of more carefully assessing lipid droplet size and morphology. Fat pads from subcutaneous mammary gland 4, perigonadal, and perirenal regions were prepared and stained with H&E. Figure 7A shows a representative section from perigonadal adipose tissue with unremarkable differences between wild-type and Cav-2-null mice. As the mammary gland and hypodermal fat pads are, respectively, reduced in size and completely absent in Cav-1-null mice, we also assessed these specific adipose regions in Cav-2-null mice. Figure 7B shows whole mounts of mammary gland 4 from wild-type, Cav-1-null, and Cav-2-null mice. There are no differences grossly (Fig. 7B) or histologically (data not shown) between caveolin-2-deficient and wild-type mammary glands, whereas the Cav-1-null tissue is overtly reduced in size, primarily due to a reduction in the size of adipocytes. Similarly, Cav-2-null mice possess a normal hypodermal fat layer.
We had previously found that a loss of caveolin-1 leads to alterations in triglycerides and free fatty acids, especially in the postprandial state. Therefore, we compared the levels of triglycerides and free fatty acids as well as glucose and cholesterol (two other metabolites whose metabolism might involve the caveolins or caveolae) in wild-type, Cav-2-null, and Cav-1-null mice in the fasted and postprandial states. As shown in Fig. 7C, Cav-2-null mice are indistinguishable from their wild-type counterparts in all parameters examined; in contrast, we observed the expected increases in postprandial triglyceride and free fatty acid levels in caveolin-1-deficient mice. Thus, the dyslipidemia observed in caveolin-1-deficient mice is exclusively due to a loss of caveolin-1 and not caveolin-2.
DISCUSSION
Studies of mice with a disrupted caveolin-1 locus reveal several interesting phenotypes, namely, loss of morphological caveolae and vascular, pulmonary, and adipose tissue abnormalities. However, these results are confounded by the fact that caveolin-2 protein levels are dramatically reduced in Cav-1-null mice, leaving open the possibility that several of the proposed functional roles for caveolin-1 could be actually be due to a loss of caveolin-2.
Here, we directly addressed the functional significance of caveolin-2 by genetically targeting the caveolin-2 locus in mice. In the absence of caveolin-2, caveolin-1 is only partially destabilized, with modestly diminished protein levels in several tissues, although it maintains its high degree of localization to plasma membrane caveolae. Furthermore, the loss of caveolin-2 does not disrupt caveolar biogenesis, indicating that only caveolin-1 is necessary and sufficient to form caveolae in vivo.
We focused our initial histological and physiological characterization of these mice on organ systems that are perturbed in Cav-1-null mice (the lungs, the vasculature, and adipose tissue). Surprisingly, we found that the pulmonary defects previously attributed to a caveolin-1 deficiency are in large part recapitulated in these Cav-2-null mice. Examination of the lung parenchyma shows hypercellularity, with thickened alveolar septa and an increase in the number of vascular endothelial growth factor receptor (Flk-1)-positive endothelial cells. However, our analysis of endothelial nitric oxide synthase signaling in aortic ring experiments revealed that the vascular response is normal in Cav-2-null animals. Furthermore, caveolin-2-deficient mice are not dyslipidemic or resistant to diet-induced obesity. Therefore, this is the first indication that caveolin-2 has distinct functions in vivo and is responsible for some of the physiological roles previously attributed to caveolin-1.
Due to significant dissimilarity with the caveolin-1 protein sequence, caveolin-2 has remained enigmatic since its discovery. Its protein sequence does not contain many of the conserved residues that have been implicated in the functionality of caveolin-1, e.g., in membrane attachment, the formation of caveolae, and the compartmentalization and inhibition of signaling molecules (37, 40, 46). For example, the caveolin-2 protein sequence diverges tremendously from those of caveolin-1 and -3 in the oligomerization and scaffolding domains, regions critical for caveolin oligomer formation and binding to signaling molecules (44). At present, Cav-2's only physiological role is heterooligomerization with caveolin-1 in tissues coexpressing the two proteins (42). This lack of knowledge is in part due to a traditionally lopsided focus on the roles of caveolin-1, the first caveolin to be discovered. However, it also relates to the fact that only caveolin-1 has been positively identified in several disparate screens for novel proteins involved in cellular transformation and cholesterol and free fatty acid binding, among other findings (14, 15, 39, 50).
Therefore, the lung phenotypes observed in caveolin-2-deficient mice would never have been predicted a priori . Based on its lack of characteristic caveolin domains (e.g., the scaffolding domain), it can be speculated that caveolin-2 might act as a Cav-1-regulatory protein. As caveolin-1 can still form homooligomers in the absence of caveolin-2, it is plausible that homo-oligomerization of caveolin-1 might disrupt Cav-1's ability to function appropriately. In this scenario, we would expect the absence of caveolin-2 to either not affect or perhaps even accentuate caveolin-1 and caveolar function in vivo. This is clearly not what was observed; although Cav-2-null mice still express caveolin-1 and show abundant caveolar organelles, the phenotype of Cav-2-null lungs is identical to that reported previously for caveolin-1-deficient mice (4, 36).
Thus, is caveolin-2 functioning in some way independently of caveolae and Cav-1? This is not very plausible, given the fact that caveolin-2 is almost entirely localized to caveolar microdomains in a Cav-1-dependent manner both in vitro and in vivo (28, 33, 36). Therefore, we are led to conclude that in some tissues (i.e., lungs), caveolin-2 is somehow involved in caveolar and caveolin-1 function, where in its absence, caveolae and caveolin-1 can no longer carry out their normal repertoire of functions. A tissue-specific role for caveolin-2 is indicated here, in light of the fact that Cav-2- but not Cav-1-null adipocytes and vascular tone are apparently normal.
What is the role of caveolae and caveolins in the lung? The architecture of the alveolar septa (the primary site of gas exchange) is a thin cytoplasmic extension of the type I pneumocyte, a negligible layer of basement membrane and interstitial matrix, and the thin-walled endothelial cell. Despite this dearth of tissue mass (≈0.6 to 1 μm in thickness), up to 70% of the total plasma membrane in a typical septum is estimated to be composed of caveolae (17). Caveolae, in both plasmalemmal and fully invaginated forms, crowd the cytoplasmic extensions of both type I pneumocytes and endothelial cells (3). By sheer magnitude, these structures must serve an important role in lung physiology.
Cav-2-null lungs are highly hypercellular, with increased numbers of endothelial cells. As the caveolins and caveolae have been implicated in cellular proliferation in the context of tumorigenesis, this increase in cell number could be due simply to loss of caveolin-dependent cell cycle checkpoints (36). However, given the lack of hypercellularity in other Cav-2-null tissues, this scenario is not likely. Cellular proliferation is commonly observed in the fetal lung parenchyma as a reaction to increased mechanical stress and strains intrinsic to the breathing process (24). If the lung caveolae function in mitigating such mechanical forces during adulthood, perturbations of their function (as in the loss of Cav-2) could overcome the tolerable limits of stress and strain in the lung, leading to compensatory proliferation. In the same way, the lung vasculature is also subject to tremendous shear stresses from newly pumped blood from the right ventricle (24). Ineffective responses to such stresses could also lead to compensatory proliferation of endothelial cells. Indeed, caveolin-1 was recently shown to be involved in the mechanosensing and mechanotransduction of shear stress to downstream signaling elements such as the p42/44 mitogen-activated protein kinase cascade (32). Although the role of caveolin-2 was not assessed, it is highly likely to be involved in shear stress responses as well.
The Cav-2-null lungs also display a marked increase in basement membrane deposition (as identified by reticulin staining). Although we did not observe any changes in collagen (as identified by trichrome staining), such increases in the extracellular matrix along with pulmonary fibrosis are commonly observed pathologies in inhalant-induced alveolar damage (1). Interestingly, irradiation-induced lung injury or fibrosis leads to perturbations in caveolin-1 expression in both type I pneumocytes and endothelial cells (20). This would indicate that loss of caveolar function may be involved in the pathogenesis of alveolar damage.
The increased hypercellularity and basement membrane deposition in Cav-2-null lungs has obvious physiological consequences, as these mice are markedly exercise intolerant. Inability to meet the increased demand for rapid blood oxygenation is most likely to blame for this intolerance, which could be explained by decreased lung compliance or gas exchange (due to the thickened septa) or ineffective blood flow (due to poorly functioning endothelial cells). Thus, we have shown that caveolin-2, a protein previously thought to be dispensable for caveolar function, has a rather important role in lung architecture and function. Future studies will have to dissect the molecular basis for such lung abnormalities while taking into account reasons for the selective perturbations in caveolar function in caveolin-2-deficient mice versus the more generalized abnormalities in caveolin-1-deficient mice.
Acknowledgments
We thank Roberto Campos-Gonzalez for generously donating anticaveolin IgG, James Cleary and Daniel Michael (Betty Diamond's laboratory) for help with digital imaging of histology specimens, and Carolyn Marks for preparation and imaging of the caveolae by electron microscopy.
This work was supported by grants from the National Institutes of Health, the Muscular Dystrophy Association, the American Heart Association, and the Komen Breast Cancer Foundation to M.P.L. B.R. was supported by National Institutes of Health Medical Scientist Training Grant T32-GM07288.
REFERENCES
- 1.Crouch, E. 1990. Pathobiology of pulmonary fibrosis. Am. J. Physiol. 259:L159-184. [DOI] [PubMed] [Google Scholar]
- 2.Das, K., R. Y. Lewis, P. E. Scherer, and M. P. Lisanti. 1999. The membrane spanning domains of caveolins 1 and 2 mediate the formation of caveolin heterooligomers: implications for the assembly of caveolae membranes in vivo. J. Biol. Chem. 274:18721-18726. [DOI] [PubMed] [Google Scholar]
- 3.Dormans, J. A. 1983. The ultrastructure of various cell types in the lung of the rat: a survey. Exp. Pathol. 24:15-33. [DOI] [PubMed] [Google Scholar]
- 4.Drab, M., P. Verkade, M. Elger, M. Kasper, M. Lohn, B. Lauterbach, J. Menne, C. Lindschau, F. Mende, F. C. Luft, A. Schedl, H. Haller, and T. V. Kurzchalia. 2001. Loss of caveolae, vascular dysfunction, and pulmonary defects in caveolin-1 gene-disrupted mice. Science 293:2449-2452. [DOI] [PubMed] [Google Scholar]
- 5.Edelmann, W., K. Yang, A. Umar, J. Heyer, K. Lau, K. Fan, W. Liedtke, P. E. Cohen, M. F. Kane, J. R. Lipford, N. Yu, G. F. Crouse, J. W. Pollard, T. Kunkel, M. Lipkin, R. Kolodner, and R. Kucherlapati. 1997. Mutation in the mismatch repair gene Msh6 causes cancer susceptibility. Cell 91:467-477. [DOI] [PubMed] [Google Scholar]
- 6.Engelman, J. A., X. L. Zhang, F. Galbiati, and M. P. Lisanti. 1998. Chromosomal localization, genomic organization, and developmental expression of the murine caveolin gene family (caveolin-1, -2, and -3). Caveolin-1 and caveolin-2 genes map to a known tumor suppressor locus (6-A2/7q31). FEBS Lett. 429:330-336. [DOI] [PubMed] [Google Scholar]
- 7.Engelman, J. A., X. L. Zhang, F. Galbiati, D. Volonte, F. Sotgia, R. G. Pestell, C. Minetti, P. E. Scherer, T. Okamoto, and M. P. Lisanti. 1998. Molecular genetics of the caveolin gene family: implications for human cancers, diabetes, Alzheimer's disease, and muscular dystrophy. Am. J. Hum. Genet. 63:1578-1587. [DOI] [PMC free article] [PubMed] [Google Scholar]
- 8.Engelman, J. A., X. L. Zhang, and M. P. Lisanti. 1999. Sequence and detailed organization of the human caveolin-1 and -2 genes located near the D7S522 locus (7q31.1). Methylation of a CpG island in the 5′ promoter region of the caveolin-1 gene in human breast cancer cell lines. FEBS Lett. 448:221-230. [DOI] [PubMed] [Google Scholar]
- 9.Fan, J. Y., J.-L. Carpentier, E. van Obberghen, C. Grunfeld, P. Gorden, and L. Orci. 1983. Morphological changes of the 3T3-L1 fibroblast plasma membrane upon differentiation to the adipocyte form. J. Cell Sci. 61:219-230. [DOI] [PubMed] [Google Scholar]
- 10.Fra, A. M., E. Williamson, K. Simons, and R. G. Parton. 1995. De novo formation of caveolae in lymphocytes by expression of VIP21-caveolin. Proc. Natl. Acad. Sci. USA 92:8655-8659. [DOI] [PMC free article] [PubMed] [Google Scholar]
- 11.Fujimoto, T., H. Kogo, K. Ishiguro, K. Tauchi, and R. Nomura. 2001. Caveolin-2 is targeted to lipid droplets, a new “membrane domain” in the cell. J. Cell Biol. 152:1079-1085. [DOI] [PMC free article] [PubMed] [Google Scholar]
- 12.Galbiati, F., D. Volonté, J. A. Engelman, G. Watanabe, R. Burk, R. Pestell, and M. P. Lisanti. 1998. Targeted down-regulation of caveolin-1 is sufficient to drive cell transformation and hyperactivate the p42/44 MAP kinase cascade. EMBO J. 17:6633-6648. [DOI] [PMC free article] [PubMed] [Google Scholar]
- 13.Garcia-Cardena, G., P. Martasek, B. S. Siler-Masters, P. M. Skidd, J. C. Couet, S. Li, M. P. Lisanti, and W. C. Sessa. 1997. Dissecting the interaction between nitric oxide synthase and caveolin: functional significance of the nitric oxide synthase caveolin binding domain in vivo. J. Biol. Chem. 272:25437-25440. [DOI] [PubMed] [Google Scholar]
- 14.Gerber, G. E., D. Mangroo, and B. L. Trigatti. 1993. Identification of high affinity membrane-bound fatty acid-binding proteins using a photoreactive fatty acid. Mol. Cell. Biochem. 123:39-44. [DOI] [PubMed] [Google Scholar]
- 15.Glenney, J. R., Jr. 1989. Tyrosine phosphorylation of a 22-kDa protein is correlated with transformation by Rous sarcoma virus. J. Biol. Chem. 264:20163-20166. [PubMed] [Google Scholar]
- 16.Grunstein, M., and D. S. Hogness. 1975. Colony hybridization: a method for the isolation of cloned DNAs that contain a specific gene. Proc. Natl. Acad. Sci. USA 72:3961-3965. [DOI] [PMC free article] [PubMed] [Google Scholar]
- 17.Gumbleton, M. 2001. Caveolae as potential macromolecule trafficking compartments within alveolar epithelium. Adv. Drug Deliv. Rev. 49:281-300. [DOI] [PubMed] [Google Scholar]
- 18.Ioffe, E., Y. Liu, M. Bhaumik, F. Poirier, S. M. Factor, and P. Stanley. 1995. WW6: an embryonic stem cell line with an inert genetic marker that can be traced in chimeras. Proc. Natl. Acad. Sci. USA 92:7357-7361. [DOI] [PMC free article] [PubMed] [Google Scholar]
- 19.Ju, H., R. Zou, V. J. Venema, and R. C. Venema. 1997. Direct interaction of endothelial nitric-oxide synthase and caveolin-1 inhibits synthase activity. J. Biol. Chem. 272:18522-18525. [DOI] [PubMed] [Google Scholar]
- 20.Kasper, M., T. Reimann, U. Hempel, K. W. Wenzel, A. Bierhaus, D. Schuh, V. Dimmer, G. Haroske, and M. Muller. 1998. Loss of caveolin expression in type I pneumocytes as an indicator of subcellular alterations during lung fibrogenesis. Histochem. Cell Biol. 109:41-48. [DOI] [PubMed] [Google Scholar]
- 21.Koleske, A. J., D. Baltimore, and M. P. Lisanti. 1995. Reduction of caveolin and caveolae in oncogenically transformed cells. Proc. Natl. Acad. Sci. USA 92:1381-1385. [DOI] [PMC free article] [PubMed] [Google Scholar]
- 22.Li, S., K. S. Song, and M. P. Lisanti. 1996. Expression and characterization of recombinant caveolin: purification by poly-histidine tagging and cholesterol-dependent incorporation into defined lipid membranes. J. Biol. Chem. 271:568-573. [PubMed] [Google Scholar]
- 23.Lisanti, M. P., P. E. Scherer, J. Vidugiriene, Z.-L. Tang, A. Hermanoski-Vosatka, Y.-H. Tu, R. F. Cook, and M. Sargiacomo. 1994. Characterization of caveolin-rich membrane domains isolated from an endothelial-rich source: implications for human disease. J. Cell Biol. 126:111-126. [DOI] [PMC free article] [PubMed] [Google Scholar]
- 24.Liu, M., A. K. Tanswell, and M. Post. 1999. Mechanical force-induced signal transduction in lung cells. Am. J. Physiol. 277:L667-683. [DOI] [PubMed] [Google Scholar]
- 25.Michel, J. B., O. Feron, D. Sacks, and T. Michel. 1997. Reciprocal regulation of endothelial nitric-oxide synthase by Ca2+-calmodulin and caveolin. J. Biol. Chem. 272:15583-15586. [DOI] [PubMed] [Google Scholar]
- 26.Monier, S., D. J. Dietzen, W. R. Hastings, D. M. Lublin, and T. V. Kurzchalia. 1996. Oligomerization of VIP21-caveolin in vitro is stabilized by long chain fatty acylation or cholesterol. FEBS Lett. 388:143-149. [DOI] [PubMed] [Google Scholar]
- 27.Monier, S., R. G. Parton, F. Vogel, J. Behlke, A. Henske, and T. Kurzchalia. 1995. VIP21-caveolin, a membrane protein constituent of the caveolar coat, oligomerizes in vivo and in vitro. Mol. Biol. Cell 6:911-927. [DOI] [PMC free article] [PubMed] [Google Scholar]
- 28.Mora, R., V. L. Bonilha, A. Marmorstein, P. E. Scherer, D. Brown, M. P. Lisanti, and E. Rodriguez-Boulan. 1999. Caveolin-2 localizes to the Golgi complex but redistributes to plasma membrane, caveolae, and rafts when coexpressed with caveolin-1. J. Biol. Chem. 274:25708-25717. [DOI] [PubMed] [Google Scholar]
- 29.Napolitano, L. M. 1963. The differentiation of white adipose cells. An electron microscope study. J. Cell Biol. 18:663-679. [DOI] [PMC free article] [PubMed] [Google Scholar]
- 30.Ostermeyer, A. G., J. M. Paci, Y. Zeng, D. M. Lublin, S. Munro, and D. A. Brown. 2001. Accumulation of caveolin in the endoplasmic reticulum redirects the protein to lipid storage droplets. J. Cell Biol. 152:1071-1078. [DOI] [PMC free article] [PubMed] [Google Scholar]
- 31.Palade, G. E. 1953. Fine structure of blood capillaries. J. Appl. Phys. 24:1424. [Google Scholar]
- 32.Park, H., Y. M. Go, R. Darji, J. W. Choi, M. P. Lisanti, M. C. Maland, and H. Jo. 2000. Caveolin-1 regulates shear stress-dependent activation of extracellular signal-regulated kinase. Am. J. Physiol. Heart Circ. Physiol. 278:H1285-1293. [DOI] [PubMed] [Google Scholar]
- 33.Parolini, I., M. Sargiacomo, F. Galbiati, G. Rizzo, F. Grignani, J. A. Engelman, T. Okamoto, T. Ikezu, P. E. Scherer, R. Mora, E. Rodriguez-Boulan, C. Peschle, and M. P. Lisanti. 1999. Expression of caveolin-1 is required for the transport of caveolin-2 to the plasma membrane. Retention of caveolin-2 at the level of the Golgi complex. J. Biol. Chem. 274:25718-25725. [DOI] [PubMed] [Google Scholar]
- 34.Pol, A., R. Luetterforst, M. Lindsay, S. Heino, E. Ikonen, and R. G. Parton. 2001. A caveolin dominant negative mutant associates with lipid bodies and induces intracellular cholesterol imbalance. J. Cell Biol. 152:1057-1070. [DOI] [PMC free article] [PubMed] [Google Scholar]
- 35.Razani, B., T. P. Combs, X. B. Wang, P. G. Frank, D. S. Park, R. G. Russell, M. Li, B. Tang, L. A. Jelicks, P. E. Scherer, and M. P. Lisanti. 2002. Caveolin-1 deficient mice are lean, resistant to diet-induced obesity, and show hypertriglyceridemia with adipocyte abnormalities. J. Biol. Chem. 277:8635-8647. [DOI] [PubMed]
- 36.Razani, B., J. A. Engelman, X. B. Wang, W. Schubert, X. L. Zhang, C. B. Marks, F. Macaluso, R. G. Russell, M. Li, R. G. Pestell, D. Di Vizio, H. Hou, Jr., B. Knietz, G. Lagaud, G. J. Christ, W. Edelmann, and M. P. Lisanti. 2001. Caveolin-1 null mice are viable but show evidence of hyperproliferative and vascular abnormalities. J. Biol. Chem. 276:38121-38138. [DOI] [PubMed] [Google Scholar]
- 37.Razani, B., C. S. Rubin, and M. P. Lisanti. 1999. Regulation of cAMP-mediated signal transduction via interaction of caveolins with the catalytic subunit of protein kinase A. J. Biol. Chem. 274:26353-26360. [DOI] [PubMed] [Google Scholar]
- 38.Rothberg, K. G., J. E. Heuser, W. C. Donzell, Y. S. Ying, J. R. Glenney, and R. G. Anderson. 1992. Caveolin, a protein component of caveolae membrane coats. Cell 68:673-682. [DOI] [PubMed] [Google Scholar]
- 39.Sager, R., S. Sheng, A. Anisowicz, G. Sotiropoulou, Z. Zou, G. Stenman, K. Swisshelm, Z. Chen, M. J. C. Hendrix, P. Pemberton, K. Rafidi, and K. Ryan. 1994. RNA genetics of breast cancer: maspin as a paradigm. Cold Spring Harbor Symp. Quant. Biol. 59:537-546. [DOI] [PubMed] [Google Scholar]
- 40.Sargiacomo, M., P. E. Scherer, Z.-L. Tang, E. Kubler, K. S. Song, M. C. Sanders, and M. P. Lisanti. 1995. Oligomeric structure of caveolin: implications for caveolae membrane organization. Proc. Natl. Acad. Sci. USA 92:9407-9411. [DOI] [PMC free article] [PubMed] [Google Scholar]
- 41.Sargiacomo, M., M. Sudol, Z.-L. Tang, and M. P. Lisanti. 1993. Signal transducing molecules and GPI-linked proteins form a caveolin-rich insoluble complex in MDCK cells. J. Cell Biol. 122:789-807. [DOI] [PMC free article] [PubMed] [Google Scholar]
- 42.Scherer, P. E., R. Y. Lewis, D. Volonte, J. A. Engelman, F. Galbiati, J. Couet, D. S. Kohtz, E. van Donselaar, P. Peters, and M. P. Lisanti. 1997. Cell-type and tissue-specific expression of caveolin-2. Caveolins 1 and 2 colocalize and form a stable heterooligomeric complex in vivo. J. Biol. Chem. 272:29337-29346. [DOI] [PubMed] [Google Scholar]
- 43.Scherer, P. E., M. P. Lisanti, G. Baldini, M. Sargiacomo, C. Corley-Mastick, and H. F. Lodish. 1994. Induction of caveolin during adipogenesis and association of GLUT4 with caveolin-rich vesicles. J. Cell Biol. 127:1233-1243. [DOI] [PMC free article] [PubMed] [Google Scholar]
- 44.Scherer, P. E., T. Okamoto, M. Chun, I. Nishimoto, H. F. Lodish, and M. P. Lisanti. 1996. Identification, sequence and expression of caveolin-2 defines a caveolin gene family. Proc. Natl. Acad. Sci. USA 93:131-135. [DOI] [PMC free article] [PubMed] [Google Scholar]
- 45.Scherer, P. E., Z.-L. Tang, M. C. Chun, M. Sargiacomo, H. F. Lodish, and M. P. Lisanti. 1995. Caveolin isoforms differ in their N-terminal protein sequence and subcellular distribution: identification and epitope mapping of an isoform-specific monoclonal antibody probe. J. Biol. Chem. 270:16395-16401. [DOI] [PubMed] [Google Scholar]
- 46.Schlegel, A., and M. P. Lisanti. 2000. A molecular dissection of caveolin-1 membrane attachment and oligomerization. Two separate regions of the caveolin-1 C-terminal domain mediate membrane binding and oligomer/oligomer interactions in vivo. J. Biol. Chem. 275:21605-21617. [DOI] [PubMed] [Google Scholar]
- 47.Song, K. S., P. E. Scherer, Z.-L. Tang, T. Okamoto, S. Li, M. Chafel, C. Chu, D. S. Kohtz, and M. P. Lisanti. 1996. Expression of caveolin-3 in skeletal, cardiac, and smooth muscle cells. Caveolin-3 is a component of the sarcolemma and cofractionates with dystrophin and dystrophin-associated glycoproteins. J. Biol. Chem. 271:15160-15165. [DOI] [PubMed] [Google Scholar]
- 48.Song, K. S., Z.-L. Tang, S. Li, and M. P. Lisanti. 1997. Mutational analysis of the properties of caveolin-1. A novel role for the C-terminal domain in mediating homotypic caveolin-caveolin interactions. J. Biol. Chem. 272:4398-4403. [DOI] [PubMed] [Google Scholar]
- 49.Tang, Z.-L., P. E. Scherer, T. Okamoto, K. Song, C. Chu, D. S. Kohtz, I. Nishimoto, H. F. Lodish, and M. P. Lisanti. 1996. Molecular cloning of caveolin-3, a novel member of the caveolin gene family expressed predominantly in muscle. J. Biol. Chem. 271:2255-2261. [DOI] [PubMed] [Google Scholar]
- 50.Thiele, C., M. J. Hannah, F. Fahrenholz, and W. B. Huttner. 2000. Cholesterol binds to synaptophysin and is required for biogenesis of synaptic vesicles. Nat. Cell Biol. 2:42-49. [DOI] [PubMed] [Google Scholar]
- 51.Trigatti, B. L., R. G. Anderson, and G. E. Gerber. 1999. Identification of caveolin-1 as a fatty acid binding protein. Biochem. Biophys. Res. Commun. 255:34-39. [DOI] [PubMed] [Google Scholar]
- 52.Yamada, E. 1955. The fine structure of the gall bladder epithelium of the mouse. J. Biophys. Biochem. Cytol. 1:445-458. [DOI] [PMC free article] [PubMed] [Google Scholar]


