Abstract
The 3′ poly(A) tail of eukaryotic mRNAs plays an important role in the regulation of translation. The poly(A) binding protein (PABP) interacts with eukaryotic initiation factor 4G (eIF4G), a component of the eIF4F complex, which binds to the 5′ cap structure. The PABP-eIF4G interaction brings about the circularization of the mRNA by joining its 5′ and 3′ termini, thereby stimulating mRNA translation. The activity of PABP is regulated by two interacting proteins, Paip1 and Paip2. To study the mechanism of the Paip1-PABP interaction, far-Western, glutathione S-transferase pull-down, and surface plasmon resonance experiments were performed. Paip1 contains two binding sites for PABP, PAM1 and PAM2 (for PABP-interacting motifs 1 and 2). PAM2 consists of a 15-amino-acid stretch residing in the N terminus, and PAM1 encompasses a larger C-terminal acidic-amino-acid-rich region. PABP also contains two Paip1 binding sites, one located in RNA recognition motifs 1 and 2 and the other located in the C-terminal domain. Paip1 binds to PABP with a 1:1 stoichiometry and an apparent Kd of 1.9 nM.
Translation plays an important role in the regulation of gene expression and is implicated in the control of cell growth, proliferation, and differentiation (4, 12, 28). In eukaryotes, initiation is the rate-limiting step of translation under most circumstances and is a major target for regulation (12). The 5′cap structure (m7GpppN, where m is a methyl group and N is any nucleotide) of the mRNA is recognized by eukaryotic initiation factor 4F (eIF4F) (12). eIF4F is comprised of three subunits: (i) eIF4E, the cap binding protein; (ii) eIF4A, a bidirectional ATP-dependent RNA helicase; and (iii) eIF4G, a modular scaffolding protein which possesses binding sites for eIF4E and eIF4A and recruits the 40S ribosomal subunit to the mRNA via eIF3. Poly(A) binding protein (PABP) binds to the 3′ poly(A) tail of the mRNA. PABP is a phylogenetically conserved protein which functions in mRNA translation and stabilization (35) and is an essential protein in Saccharomyces cerevisiae, as deletion of the PAB1 gene is lethal (36). Human PABP is a 633-amino-acid (aa) protein which contains four RNA recognition motifs (RRMs) arranged in tandem and a proline-rich C-terminal domain (24, 32). RRMs 1 and 2 are the major contributors to the poly(A) binding activity of PABP (6, 24). PABP physically interacts with eIF4G (16, 26, 39), leading to the circularization of the mRNA by bridging the mRNA 5′ and 3′ extremities (closed-loop model) (18, 41). The closed-loop model explains the synergistic enhancement of translation by the 5′ cap structure and the 3′ poly(A) tail of the mRNA (10, 11, 37). By joining the 5′ and the 3′ ends of the mRNA, circularization may facilitate reinitiation of translation, initiation complex formation, or the 60S ribosome joining step (19, 38, 40).
Paip1 (PABP-interacting protein 1) is a 479-aa protein which has homology (25% identity and 39% similarity) with the central domain of human eIF4G (aa 420 to 890) (5). This segment of eIF4G contains one of the two known eIF4A binding sites (17). Consequently, Paip1 interacts with eIF4A (5). Paip1 was shown to stimulate translation of a reporter mRNA in cultured mammalian cells (5). Paip1 is also involved in mRNA turnover as part of a protein complex that stabilizes the c-fos proto-oncogene mRNA by binding to the major protein-coding-region determinant of instability (mCRD) (15). More recently, another PABP-interacting protein, Paip2, was identified (22). Paip2 is a highly acidic 127-aa protein (pI = 3.9) which represses translation in vitro and in transfected cells (22). Paip2 inhibits binding of PABP to the poly(A) tail and competes with Paip1 for binding to PABP (22).
The mechanism by which these PABP-interacting proteins compete for binding to PABP and regulate translation is not fully understood. To study the role of Paip1 in translation regulation, we undertook a detailed biochemical characterization of the interacting domains in Paip1 and PABP by using far-Western and glutathione S-transferase (GST) pull-down assays. In addition, the kinetic and thermodynamic constants for both the Paip1 and PABP interacting domains were determined by a surface plasmon resonance (SPR)-based biosensor (Biacore). Paip1 and PABP interact with a 1:1 stoichiometry, even though the interaction involves two distinct binding regions in each protein. This is in contrast to a 2:1 stoichiometry for the Paip2-PABP interaction (20).
MATERIALS AND METHODS
Plasmids.
pGST-Paip1 fragments 185-415, 326-479, and 415-479 were described previously (5). pGST-PABP fragments RRM1-4, RRM1-2, RRM3-4, RRM2-3, RRM1, RRM2, RRM3, RRM4, C1, and C2 and pcDNA3-GST-Paip2 were described previously (20). pGEX-6P2-Paip2, pcDNA3-Flag-Paip1, and pACTAG-2-Paip2 (which encodes hemagglutinin [HA]-Paip2) were described previously (22).
To generate pGST-HMK-PABP-His vector, PABP cDNA was PCR amplified using pET3b-PABP-His (20) as a template. The forward primer contained a BamHI site, a sequence encoding a peptide which contains a heart muscle kinase (HMK) phosphorylation site, and a SalI site (5′-GG/GGA/TCC/AGA/AGA/GCA/TCT/GTG/GTC/GAC/ATG/AAC/CCC/AGT/GCC/CCC/AGC-3′). The reverse primer included an XhoI site, a stop codon, a histidine tag (His6), and an XbaI site (5′GG/CTC/GAG/TTA/GTG/ATG/GTG/ATG/GTG/ATG/TCT/AGA/AAC/AGT/TGG/AAC/ACC/GGT/GGC-3′). The ATG and stop codons are underlined, and codons are separated by slashes. The resulting PCR product was digested with BamHI and XhoI and ligated in frame into pGEX6p1 (Amersham Pharmacia Biotech [APB]) digested with BamHI and XhoI. This vector codes for a fusion protein containing GST and HMK tags at the N terminus and a His6 tag at the C terminus. To construct pGST-HMK-PABP(C-term)-His, the partial PABP sequence (aa 374 to 633) was PCR amplified using pET3b-PABP-His as a template. The PCR product was digested with SalI and XbaI and ligated into pGST-HMK-PABP-His digested with SalI and XbaI. Similarly, to construct plasmids encoding GST-HMK-Paip1-His and fragments 116-479, 440-479, 1-415, 1-115, and 144-415, the respective Paip1 coding regions (numbers correspond to amino acids) were PCR amplified using pcDNA3-Paip1 (5) as a template. The resulting fragments were digested with SalI and XbaI and ligated to pGST-HMK-PABP-His digested with SalI and XbaI. pGST-HMK-Paip1 fragments 1-143, 116-143, and 410-439 were prepared similarly to the other Paip1 fragments, but an XhoI restriction site was used instead of an XbaI site, eliminating the His6 tag at the C terminus. To construct pET-His-HMK-PABP(RRM1-2), the partial PABP sequence (aa 1 to 179) was PCR amplified using pET3b-PABP-His as a template and then digested with XhoI and BamHI and ligated into pET-His-HMK (3) digested with XhoI and BamHI. pcDNA3-GST-Paip1 was obtained by subcloning the BamHI/XhoI Paip1 insert of pcDNA3-Flag-Paip1 into pcDNA3-GST (a kind gift of H. Imataka) digested with BamHI and XhoI.
Protein expression and purification.
For expression and purification of proteins, Escherichia coli BL21(λDE3) was transformed with bacterial expression vectors. After incubation at 30°C and induction with 0.2 mM IPTG (isopropyl-β-d-thiogalactopyranoside) for 3 h, bacteria were harvested by centrifugation. For the purification of GST-HMK-PABP(C-term)-His and GST-HMK-Paip1-His and fragments 116-479, 440-479, 1-415, 1-115, and 144-415, the bacterial pellets were resuspended in 1× phosphate-buffered saline (PBS) (137 mM NaCl, 2.7 mM KCl, 4.3 mM Na2HPO4 · 7H2O, 1.4 mM KH2PO4, pH 7.4)-10% glycerol-0.2% Triton X-100-Protease Inhibitor Cocktail Complete (Roche). The suspension was sonicated and centrifuged for 20 min at 23,000 × g in a DuPont Sorvall RC-5B centrifuge (SS34 rotor). The clarified supernatant was incubated with Talon metal affinity resin (Clontech) for 20 min at room temperature. The resin was washed three times with 1× PBS-0.2% Triton X-100-5 mM imidazole. Proteins were eluted with 1× PBS-10% glycerol-0.2% Triton X-100-250 mM imidazole. The fractions containing proteins were identified by Bio-Rad assay, pooled, diluted 10 times in cleavage buffer (50 mM Tris-HCl [pH 7.0], 150 mM NaCl, 1 mM EDTA, 1 mM dithiothreitol, 0.01% Triton X-100), and then incubated with glutathione-Sepharose resin (APB) for 15 min. Beads were washed three times with 10 volumes of cleavage buffer. Proteins were either eluted with 50 mM Tris-HCl (pH 8.5)-10 mM glutathione or processed for cleavage of the GST tag. The GST tag was cleaved on the resin by the addition of 40 μl (80 U) of PreScission protease (APB) per ml of resin (bed volume) and incubated at 4°C for 4 h to overnight, and the protein of interest was recovered from the supernatant. The expression and purification of GST-Paip1 fragments 185-415, 415-479, 326-479, 410-439, 1-143, and 116-143; GST-PABP fragments RRM1-4, RRM1-2, RRM3-4, RRM2-3, RRM1, RRM2, RRM3, RRM4, C1, and C2; and GST-Paip2 were performed on glutathione-Sepharose resin according to the instructions of the manufacturer (APB). GST-Paip2 was subjected to PreScission protease cleavage as described above. The purification of GST-HMK-PABP-His and PABP-His was performed as previously described (20). After elution from Talon metal affinity resin, the GST-HMK-PABP-His was diluted 10 times in cleavage buffer and purified on glutathione-Sepharose resin (APB) and/or subjected to PreScission protease cleavage as described above. His-HMK-PABP (RRM1-2) was purified on Talon metal affinity resin as described above. All recombinant proteins were dialyzed against 1× PBS buffer.
Antibodies and Western blotting.
Antibodies and their working dilutions were as follows: rabbit polyclonal anti-GST (a gift from Mathieu Miron and Josée Dostie), 1:1,000; rabbit polyclonal anti-PABP (1), 1:500; mouse monoclonal anti-Flag (Sigma), 1:1,000; mouse monoclonal anti-HA (Berkeley Antibody Company), 1:1,000; horseradish peroxidase-conjugated donkey anti-rabbit immunoglobulin G (APB), 1:5,000; and horseradish peroxidase-conjugated sheep anti-mouse immunoglobulin G (APB), 1:5,000. Proteins were resolved by sodium dodecyl sulfate-polyacrylamide gel electrophoresis (SDS-PAGE) (25) and transferred onto nitrocellulose membranes (Schleicher & Schuell) in 25 mM Tris-HCl (pH 7.5)-190 mM glycine-20% methanol. Membranes were blocked for 2 h at room temperature or overnight at 4°C with 5% skim milk in 1× PBS containing 0.05% Tween 20 (PBST). The membranes were incubated for 2 h at room temperature with primary antibodies diluted in PBST supplemented with 1% bovine serum albumin, followed by three 15-min washes in PBST. Membranes were subsequently incubated with peroxidase-coupled secondary antibodies diluted in PBST supplemented with 5% skim milk for 30 min at room temperature, followed by three 15 min washes in PBST. Detection of peroxidase-coupled secondary antibodies was performed with enhanced chemiluminescence (NEN) and exposure to an X-ray film (Kodak).
Far-Western analysis.
The procedure for far-Western analysis was previously described in detail (21). 32P-labeled HMK-PABP-His or 32P-labeled HMK-Paip1-His was used as a probe at 250,000 cpm/ml of hybridization solution.
GST pull-down assays.
Purified GST fusion proteins (2 to 10 μg) [GST, GST-HMK-Paip1-His, GST-Paip1(116-143), GST-HMK-Paip1(440-479)-His, GST-HMK-PABP-His, and GST-HMK-PABP(C-term)-His] were incubated for 15 min at 4°C with glutathione-Sepharose (10 μl) with 300 μl of pull-down buffer (PDB) (20 mM HEPES-KOH [pH 7.5], 100 mM KCl, 1 mM dithiothreitol, 0.5 mM EDTA, 10% glycerol, and 0.5% NP-40). The supernatant was removed, and non-GST recombinant proteins (2 to 10 μg) [HMK-PABP-His, His-HMK-PABP(RRM1-2), HMK-PABP(C-term)-His, HMK-Paip1(117-479)-His, and HMK-Paip1-His] were added together with 300 μl of PDB. The mixture was incubated for 2 h at 4°C. The resin was washed three times with 500 μl of PDB. Proteins were eluted with 40 μl of 1× Laemmli sample buffer (25). The samples were boiled for 5 min, resolved by SDS-PAGE, and stained with Coomassie blue R-250.
HeLa cells (grown to 80% confluence in a 10-cm-diameter dish) were infected with vaccinia virus vTF7-3 (9) for 1 h and then cotransfected with a combination of pcDNA3-GST, pcDNA3-GST-Paip1, pcDNA3-Flag-Paip1, pcDNA3-GST-Paip2, and pACTAG-2-Paip2 (10 μg of DNA total) by using Lipofectin (40 μl) (Gibco-BRL) according to the manufacturer's instructions. Cells were harvested at 16 h posttransfection and lysed in buffer A (20 mM Tris-HCl [pH 7.5], 100 mM KCl, 1 mM dithiothreitol, 0.5 mM EDTA, 10% glycerol, 0.5% NP-40). Cellular debris was removed by centrifugation at 16,000 × g for 15 min at 4°C. The protein concentration in the supernatant was determined by Bio-Rad assay. HeLa cell extracts (300 μg) were incubated with glutathione-Sepharose (25 μl) (APB) and incubated for 3 h at 4°C. The resin was washed four times with 1 ml of buffer A. Proteins were eluted with 1× Laemmli sample buffer. Samples were boiled for 5 min, resolved by SDS-PAGE, and processed for Western blotting.
Immunoprecipitation.
HeLa cell extracts (300 μg) were incubated with mouse monoclonal anti-Flag antibody (1 μl) (Sigma) for 3 h at 4°C. Protein A-Sepharose (25 μl) (APB) was added to the mixture and incubated for 1 h at 4°C. The resin was washed four times with 1 ml of buffer A. Proteins were eluted with 1× Laemmli sample buffer. Samples were boiled for 5 min, resolved by SDS-PAGE, and processed for Western blotting.
Immobilization of recombinant proteins on Biacore sensor chips.
Solutions of PABP-His (22.5 μg/ml), HMK-Paip1-His (12.5 μg/ml), and HMK-PABP(C-term)-His (20 μg/ml) in 10 mM formate buffer (pH 4.0) were used to immobilize the proteins on Pioneer B1 sensor chip surfaces by using the standard amine coupling procedure as previously described (7, 20). The same coupling procedure, in the absence of protein, was used to prepare mock (control) surfaces.
Experimental controls for Biacore experiments.
In preliminary experiments, PABP-His or HMK-PABP(C-term)-His (200 resonance units [RU]) was coupled to a dextran matrix on a Pioneer B1 sensor chip, and 100 nM HMK-Paip1-His was injected over these surfaces or a mock surface. Similarly, HMK-Paip1-His (200 RU) was coupled to a surface, and 50 nM PABP-His, PABP(RRM1-4), or HMK-PABP(C-term)-His was injected. Nonspecific interactions of HMK-Paip1-His with the dextran surface were negligible compared to the specific interactions recorded when the injections were performed over the PABP-His and HMK-PABP(C-term)-His surfaces. Likewise, PABP(RRM1-4) did not interact with the dextran surface but interacted specifically with the HMK-Paip1-His surface. However, PABP-His and HMK-PABP(C-term)-His interacted nonspecifically with the dextran surface of the Pioneer B1 sensor chip, as was previously observed with the CM5 sensor chip (20). Since PABP-His and HMK-PABP(C-term)-His could not be used as analytes (the protein flowing over the surface), their interactions were analyzed further only when they were used as ligands (the coupled proteins). The PABP-His, HMK-PABP(C-term)-His, and HMK-Paip1-His surfaces were used to determine the optimal regeneration conditions. Optimal regeneration was accomplished by using two 25-μl pulse injections (flow rate of 100 μl/min) of a 120 mM HCl solution for the HMK-Paip1-His surface and of a 60 mM HCl-20 mM n-octyl glucopyranoside solution for the PABP-His or HMK-PABP(C-term)-His surface. The regeneration procedures were followed by an EXTRACLEAN procedure and a RINSE procedure (Biacore Upgrade Instrument Handbook, APB, 1995).
To minimize artifacts due to mass transport and rebinding effects (13, 30, 31) or steric hindrance (crowding problems) (33) and to maintain a high signal-to-noise ratio, we determined the minimal amount of PABP-His, HMK-PABP(C-term)-His, or HMK-Paip1-His that needed to be coupled to the surface (200, 150, and 100 RU, respectively). The absence of mass transport limitations was confirmed experimentally by injecting HMK-Paip1-His solution over the PABP-His and HMK-PABP(C-term)-His surfaces, or by injecting PABP(RRM1-4) solution over the HMK-Paip1-His surface, at different flow rates ranging from 5 to 100 μl/min. There was no mass transport effect when the flow rate was higher than 20 μl/min for injections of PABP(RRM1-4) over the HMK-Paip1-His surface or when it was higher than 50 μl/min for injections of HMK-Paip1-His over the PABP-His and PABP(C-term)-His surfaces. Indeed, at these higher flow rates, after data analysis, the interaction curves (sensorgrams) were superimposable, indicating the absence of mass transport (data not shown).
Kinetic assays on the Biacore.
Kinetic experiments were carried out in duplicate at 25°C. The data collection rate was set to 10 Hz for every kinetic assay. HEPES-buffered saline (20 mM HEPES-KOH [pH 7.4], 150 mM NaCl, 3.4 mM EDTA, 0.05% Tween 20) was used as running buffer and to dilute the injected proteins. Kinetic experiments were carried out at a flow rate of 40 μl/min for PABP(RRM1-4) injections over an HMK-Paip1-His surface or at 100 μl/min for HMK-Paip1-His injections over PABP-His and HMK-PABP(C-term)-His surfaces. Different concentrations of HMK-Paip1-His or PABP(RRM1-4) were injected for 120 s over HMK-PABP(C-term)-His or HMK-Paip1-His optimized surfaces, respectively (see above) and over a mock surface, followed by a 240-s buffer injection. Different concentrations of HMK-Paip1-His were injected for 90 s over the PABP-His optimized surface and over a mock surface, followed by a 240-s buffer injection.
Biacore data preparation and analysis.
The data preparation was done as described elsewhere by the method of double referencing (34). The sensorgrams were transformed to concentration units by using the molecular weights of the injected proteins. All of the curves were reduced to 500 evenly spaced sampling points. For each set of individual curves, corresponding to injections of various concentrations of protein over the same surface, global fitting was carried out using different kinetic models available in the SPRevolution software (7). The models, parameter estimations, and statistical analyses used in this study were described in detail previously (20).
Multiple-binding experiments on the Biacore.
All multiple-binding experiments were carried out at a flow rate of 5 μl/min. For sequential injections, HMK-Paip1-His (1 μM) or Paip2 (100 nM) was injected (300 s) over a PABP-His surface (1,500 RU) and over a mock surface. Paip1 and Paip2 injections were followed by an injection (180 s) of PABP(RRM1-4) (100 nM). For preincubation experiments, HMK-Paip1-His (25 nM) was preincubated (or not) with PABP(RRM1-4) (75 nM) and injected (300 s) over an HMK-PABP(C-term)-His surface (150 RU) and over a control surface.
Sequences.
Paip1 and PABP sequences and amino acid numbers used in this paper are according to GenBank accession numbers AF013758 and Y00345, respectively.
RESULTS
Identification of a new PABP binding site in Paip1.
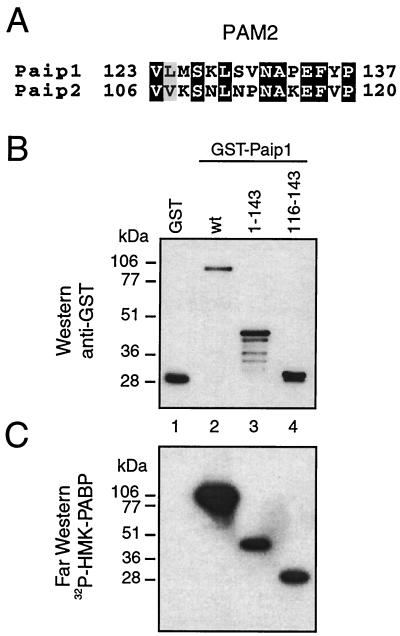
It was initially reported that the C-terminal region of Paip1 interacts with PABP (5), but the corresponding interaction domain in PABP was not identified. Subsequently, human Paip1 was shown to interact with RRMs 1 and 2 and the C terminus of the Xenopus PABP (14) and with the C terminus of human PABP (8). However, the precise binding sites in Paip1 and PABP were not defined, and the interactions were not quantified. We recently reported on the presence of two independent PABP binding sites in the translational repressor Paip2 (20). One binding site, PAM1 (for PABP-interacting motif 1), consists of a stretch of acidic amino acids in the middle of Paip2 (aa 22 to 75) and binds strongly to RRMs 2 and 3 of PABP (20). Interestingly, as for the PAM1 in Paip2, the C terminus of Paip1, which binds PABP (5), contains a region rich in acidic amino acids. The other binding site, PAM2, also termed the PABP C-terminal binding motif (8, 20, 23), resides in the C terminus of Paip2. It consists of 15 amino acids (aa 106 to 120) and binds to the C terminus of PABP (within aa 546 to 619 [20, 23]) with an affinity lower than that of the PAM1-PABP interaction (20). Alignment of the Paip1 and Paip2 amino acid sequences revealed similarity between PAM2 in Paip2 and a sequence in Paip1 spanning aa 123 to 137 (Fig. 1A). PAM2 also exists in several other proteins, including eukaryotic release factor 3, ataxin-2, and transducer of ErbB-2 (8, 23). PAM2 in Paip1 was not previously demonstrated to interact with PABP. To characterize the PAM2 in Paip1 (aa 123 to 137), we generated a GST-Paip1 full-length fusion protein and fragments containing aa 1 to 143 and 116 to 143 and expressed them in E. coli. Approximately equal amounts of the intact proteins, as determined by Western blotting using an anti-GST antibody, were loaded on the gel (Fig. 1B). A duplicate membrane was used for far-Western analysis with 32P-labeled HMK-PABP as a probe. GST-Paip1 and fragments 1-143 and 116-143 (Fig. 1C, lanes 2 to 4) interacted with the PABP probe, while GST did not (lane 1). This result defines a Paip1 minimal fragment (aa 116 to 143) containing the conserved PAM2, which is sufficient for PABP binding.
FIG. 1.
Identification of a new PABP binding site in Paip1. (A) Sequence alignment of PAM2 in Paip1 and Paip2 performed with PIMA multisequence alignment software (Baylor College of Medicine Search Launcher). Black and gray boxes indicate conserved and similar residues, respectively. (B) Purified GST and GST-Paip1 proteins (∼100 ng) were resolved by SDS-10% PAGE and transferred onto a nitrocellulose membrane. The membrane was probed with a rabbit polyclonal anti-GST antibody. (C) Autoradiography of a duplicate membrane processed for far-Western analysis with 32P-labeled HMK-PABP as a probe. Positions of molecular mass markers are shown on the left. wt, wild-type.
Characterization of PABP binding sites in Paip1.
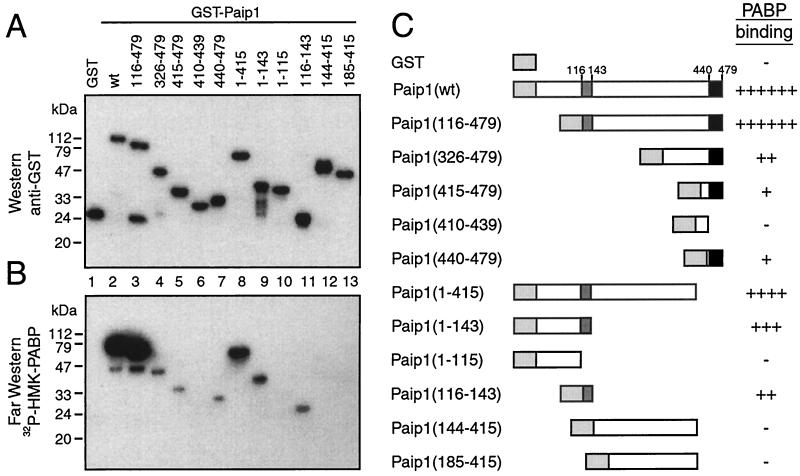
To further delineate the two PAMs in Paip1, additional GST-Paip1 fragments were generated. Approximately equal amounts of intact proteins, as revealed by a Western blot analysis with an anti-GST antibody, were loaded on the gel (Fig. 2A). A duplicate membrane was used for far-Western analysis with 32P-labeled HMK-PABP as a probe. GST-Paip1, but not GST, interacted strongly with PABP (Fig. 2B, lanes 1 and 2). N-terminal truncations of Paip1 were generated. Fragments 116-479, 326-479, 415-479, and 440-479, but not 410-439, interacted with PABP to various degrees (Fig. 2B, lanes 3 to 7). Together, these results more precisely demarcate the boundaries of the PAM1 in Paip1 within aa 440 to 479. To delineate the boundaries of the PAM2 in Paip1, C-terminal truncations of Paip1 were generated. Paip1 fragments 1-415 and 1-143 interacted strongly with PABP (Fig. 2B, lanes 8 and 9), but a further C-terminal deletion, generating fragment 1-115, abolished binding to PABP (lane 10). Thus, the boundaries of PAM2 in Paip1 map within aa 116 to 143 (lane 11). Consistent with these mapping results, Paip1 fragments 144-415 and 185-415 failed to interact with PABP (lanes 12 and 13). Taken together, these results demonstrate, similar to the case for Paip2, the existence of two independent PABP binding domains in Paip1: PAM2, which is N terminal, and PAM1, which is a C-terminal acidic domain (aa 116 to 143 and 440 to 479, respectively) (Fig. 2C).
FIG. 2.
Identification of PABP binding sites in Paip1. (A) Purified GST and GST-Paip1 proteins (∼100 ng) were resolved by SDS-10% PAGE and transferred onto a nitrocellulose membrane. The membrane was probed with a rabbit polyclonal anti-GST antibody. Positions of molecular mass markers are shown on the left. wt, wild-type. (B) Autoradiography of a duplicate membrane processed for far-Western analysis with 32P-labeled HMK-PABP as a probe. (C) Schematic diagram of the results from the interaction of GST-Paip1 fragments with PABP. Relative binding was evaluated visually. Light gray, dark gray, and black boxes represent GST, PAM2, and PAM1, respectively.
Characterization of Paip1 binding sites in PABP.
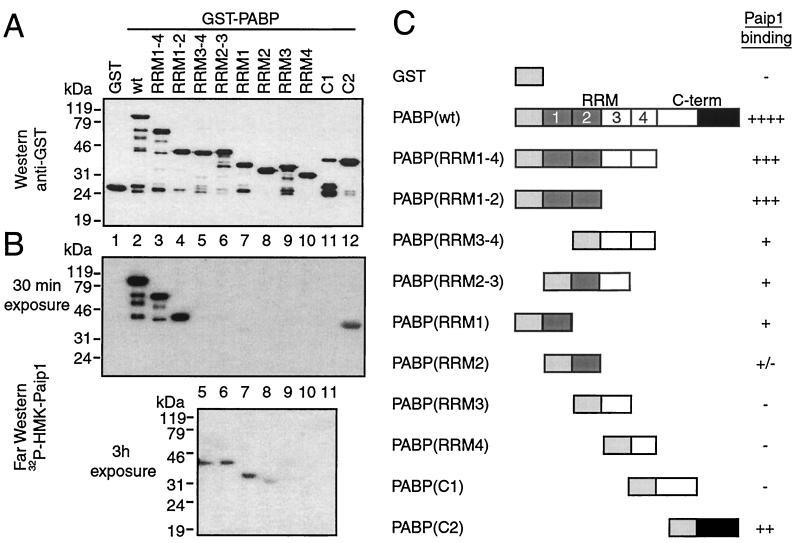
We next identified the Paip1 binding domains in PABP. Fragments of PABP were generated as GST fusion proteins and expressed in E. coli. Approximately equal amounts of intact proteins, as determined by Western blotting using an anti-GST antibody, were loaded on the gel (Fig. 3A). A duplicate membrane was used for far-Western analysis with 32P-labeled HMK-Paip1 as a probe. Paip1 did not interact with GST but interacted strongly with full-length PABP, RRM1-4, RRM1-2, and C2 (the second half of the C-terminal domain) (Fig. 3B, upper panel, lanes 1 to 4 and 12). Combinations of RRM domains, RRM3-4 and RRM2-3, and individual RRM1 and RRM2 domains interacted weakly with Paip1, while RRM3, RRM4, and C1 (the first half of the C-terminal domain) failed to interact with Paip1 (Fig. 3B, bottom panel, lanes 5 to 11). Thus, PABP contains two binding sites for Paip1, one within RRMs 1 and 2 and another in the extreme C terminus of PABP (Fig. 3C).
FIG. 3.
Identification of Paip1 binding sites in PABP. (A) Purified GST and GST-PABP proteins (∼100 ng) were subjected to SDS-10% PAGE and transferred onto a nitrocellulose membrane. The membrane was blotted with a rabbit polyclonal anti-GST antibody. Positions of molecular mass markers are shown on the left. wt, wild-type. (B) Autoradiography of a duplicate membrane processed for far-Western analysis with 32P-labeled HMK-Paip1 as a probe. The upper and lower panels represent 30-min and 3-h exposures against an X-ray film, respectively. (C) Schematic diagram of the results from the interaction of GST-PABP fragments with Paip1. Relative binding was evaluated visually. Light gray, dark gray, and black boxes represent GST, PABP(RRM1-2), and PABP(C-term) binding sites, respectively.
PAMs of Paip1 interact with defined PABP fragments in vitro.
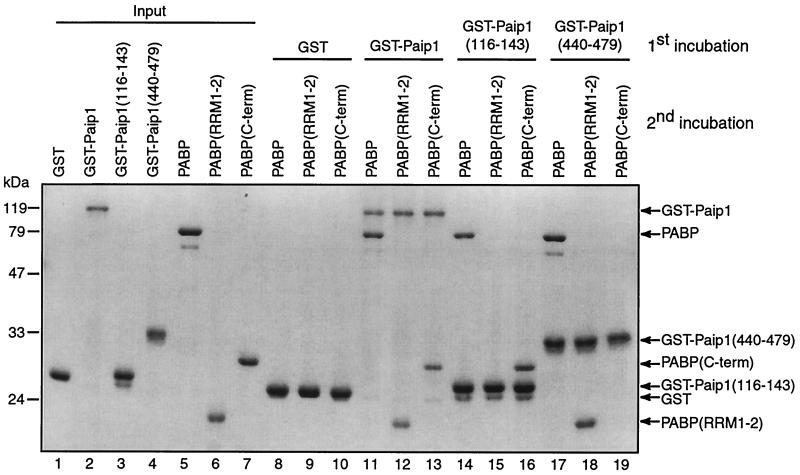
GST pull-down experiments were performed to determine which of the PAMs of Paip1 interacts with the two Paip1 binding domains in PABP. The recombinant proteins used in this experiment contained only minor amounts of degraded proteins (Fig. 4, input, lanes 1 to 7). GST did not interact with any of the PABP fragments (lanes 8 to 10), while full-length GST-Paip1 interacted with full-length PABP, PABP(RRM1-2) and PABP(C-term) (lanes 11 to 13). GST-Paip1(116-143) interacted with full-length PABP and PABP(C-term) but not with PABP(RRM1-2) (lanes 14 to 16). GST-Paip1(440-479) interacted with full-length PABP and PABP(RRM1-2) but not with PABP(C-term) (lanes 17 to 19). Thus, the PAM1 in Paip1 (aa 440 to 479) interacts with the RRM1 and -2 region of PABP, and the PAM2 in Paip1 (aa 116 to 143) interacts with the C-terminal region of PABP. Paip1 and PABP most probably associate independently of RNA, since treatment of the protein mixtures with a combination of RNase A and micrococcal nucleases did not abolish the interaction (data not shown).
FIG. 4.
Interactions of Paip1 fragments with PABP fragments in vitro. GST and GST-Paip1 fragments (5 μg) were immobilized on glutathione-Sepharose for GST pull-down analysis and incubated with various PABP fragments (5 μg) as indicated. Bound proteins were eluted in Laemmli sample buffer and resolved by SDS-10% PAGE. Recombinant proteins (1 μg) were loaded in lanes 1 to 7 (input). The gel was stained with Coomassie blue R-250. Positions of the molecular mass markers are shown on the left. Proteins are identified on the right.
PABP(RRM1-4) and PABP(C-term) interact with Paip1 with a 1:1 stoichiometry as determined by SPR.
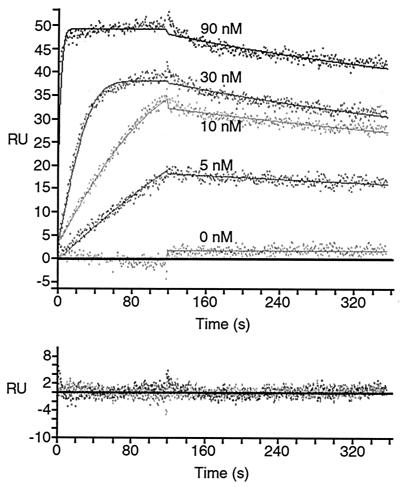
To obtain quantitative thermodynamic and kinetic measurements and to determine the stoichiometry of the Paip1-ABP interaction, experiments were conducted on an SPR-based biosensor (Biacore). In a typical SPR experiment, one of the binding partners is immobilized on the sensor chip surface (the ligand in SPR terminology) and the other binding partner is injected in solution over the sensor chip surface (the analyte in SPR terminology). The mass accumulation of the analyte on the surface, which results from its binding to the ligand, is recorded in RU, which are directly proportional to the analyte mass. To study the Paip1 interaction with PABP(RRM1-4), different concentrations of PABP(RRM1-4) were injected over an optimized Paip1 surface and a mock surface (see Materials and Methods). The resulting set of curves was then analyzed by curve fitting using numerical integration methods (see Materials and Methods). When a kinetic model adequately depicts a molecular interaction, the residuals (difference between the experimental points and the calculated points) will be minimal and randomly distributed around a zero value. This results in low values for the standard deviation of the residuals, and the Z1 and Z2 statistics, as described in detail previously (2, 20). The quality of the fit (Fig. 5) and the values of the residual statistics (Table 1) showed that the Paip1 interaction with PABP(RRM1-4) is described well by a simple one-to-one (1:1) model, in which one PABP(RRM1-4) molecule interacts with one Paip1 molecule.
FIG. 5.
SPR analysis of the interaction between PABP(RRM1-4) and Paip1. PABP(RRM1-4) was injected, at the concentrations indicated, over a Paip1 surface (100 RU) and over a mock surface. Data were treated and integrated with a simple 1:1 model. (Top panel) Experimental sensorgrams (points) and calculated fits (solid lines). (Bottom panel) Related residuals (difference between calculated and experimental data points). Related kinetic constants are listed in Table 1.
TABLE 1.
Kinetic and thermodynamic constants for the Paip1-PABP(RRM1-4) interaction calculated by globally fitting the experimental data set shown in Fig. 5 to a simple 1:1 model
| Parameter | Value in simple model (mean ± SD) |
|---|---|
| kass1 (M−1/s−1) | (1.31 ± 0.03) × 106 |
| kdiss1 (s−1) | (7.4 ± 0.3) × 10−4 |
| Surface activity (RU) | 55.3 ± 0.5 |
| Kd (nM) | 0.56 ± 0.03 |
| SD of residuals (RU) | 1.080 |
| Z1 statistic | 14.54 |
| Z2 statistic | 2.372 |
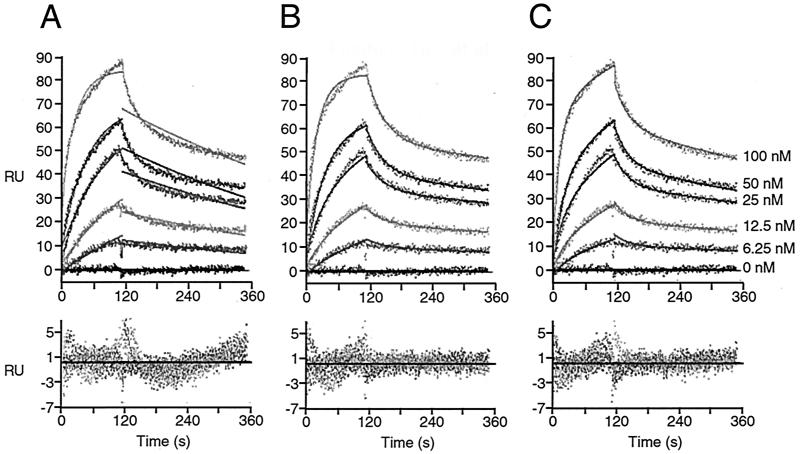
Next, we studied the interaction of Paip1 with the C-terminal region of PABP. PABP(C-term) was coupled to the surface, and Paip1 was used as the analyte. The analysis of the sensorgrams yielded poor fits when a simple 1:1 interaction model was applied (Fig. 6A; Table 2). Since potential artifacts such as mass transport limitation and rebinding or crowding problems were eliminated (see Materials and Methods), it is likely that this deviation from a simple binding model could be due to a more complex interaction mechanism, as was observed for Paip2 binding to PABP(C-term) (20). Therefore, two more complex models were examined. The first assumes that two Paip1 molecules bind to one PABP(C-term) molecule (two-to-one [2:1] model) (Fig. 6B). The second involves an initial binding event between one Paip1 and one PABP(C-term) molecule, followed by a rearrangement of the Paip1-PABP(C-term) complex (1:1 rearrangement model) (Fig. 6C). The 2:1 model did not accommodate the data from the Paip1 interaction with PABP(C-term) as well as the 1:1 rearrangement model, as judged by visual inspection (compare Fig. 6B and C, especially the sensorgram curve at 100 nM) and the values of the residual statistics (in particular the Z2 value) (Table 2).
FIG. 6.
SPR analysis of the interaction between PABP(C-term) and Paip1. Paip1 was injected, at the concentrations indicated, over a PABP(C-term) surface (150 RU) and over a mock surface. Data were treated and integrated with a simple 1:1 model (A), a 2:1 model (B), or a 1:1 model with rearrangement of the protein complex (C). (Top panels) Experimental sensorgrams (points) and calculated fits (solid lines). (Bottom panels) Related residuals. Related kinetic constants are listed in Table 2.
TABLE 2.
Kinetic and thermodynamic constants for the Paip1-PABP(C-term) interaction calculated by globally fitting the experimental data set shown in Fig. 6 to various kinetic models
| Parameter | Value (mean ± SD) in:
|
||
|---|---|---|---|
| Simple model | 2:1 stoichiometry model | Rearrangement model | |
| kass1 (M−1 s−1) | (3.7 ± 0.1) × 105 | (3.7 ± 0.2) × 105 | (4.9 ± 0.1) × 105 |
| kdiss1 (s−1) | (1.79 ± 0.05) × 10−3 | (3.0 ± 0.2) × 10−2 | (2.5 ± 0.1) × 10−2 |
| kass2 (M−1 s−1) | NAa | (3.8 ± 0.1) × 105 | (1.23 ± 0.05) × 10−2b |
| kdiss2 (s−1) | NA | (7.2 ± 0.9) × 10−4 | (1.5 ± 0.07) × 10−3 |
| Surface activity (RU) | 37.6 ± 0.5 | 25.9 ± 0.5 | 53.4 ± 0.7 |
| Kd1 (nM) | 4.7 ± 0.2c | 79 ± 10 | 52 ± 4 |
| Kd2 (nM) | NA | 1.8 ± 0.3 | 0.12 ± 0.01d |
| Kdapp (nM) | 4.7 ± 0.2 | NA | 5.7 ± 1e |
| SD of residuals (RU) | 2.089 | 1.370 | 1.337 |
| Z1 statistic | 32.67 | 18.89 | 17.49 |
| Z2 statistic | 2.887 | 0.635 | 0.375 |
NA, not applicable.
Per second.
Kd1 = kdiss1/kass1.
No unit.
Kdapp = [KA1 × (1 + KA2)]−1, with KA1 = Kd1−1 and KA2 = Kd2−1.
The kinetic and equilibrium constants related to the fitting of the PABP(RRM1-4) and PABP(C-term) interactions with Paip1 are listed in Tables 1 and 2. The affinity of the PABP(RRM1-4)-Paip1 interaction is approximately 10-fold higher than that of the PABP(C-term)-Paip1 interaction [Kd = 0.56 nM for PABP(RRM1-4) (simple 1:1 model); Kdapp = 5.7 nM for PABP(C-term) (1:1 rearrangement model)] (Tables 1 and 2).
Full-length PABP interacts with Paip1 with a 1:1 stoichiometry as determined by SPR.
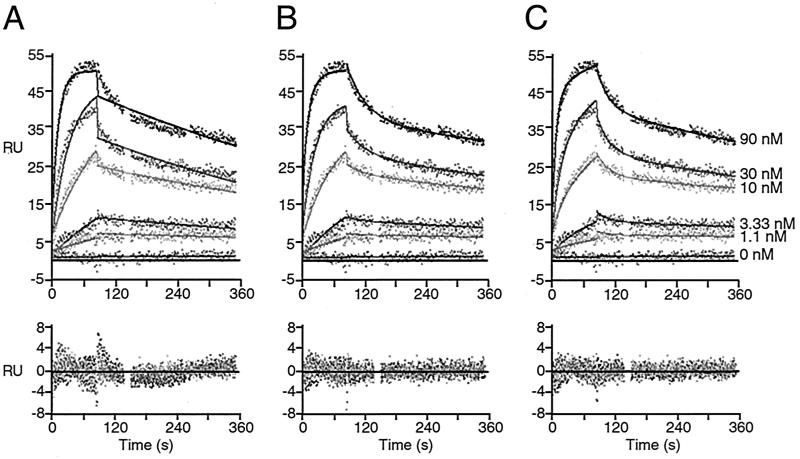
We next determined the kinetic and thermodynamic constants for the interaction of full-length PABP with Paip1. Paip1 was injected over a PABP surface at different concentrations (from 0 to 90 nM). The analysis of the sensorgrams yielded a poor fit when a simple 1:1 interaction model was used (Fig. 7A). Since PABP possesses two binding sites for Paip1 and vice versa, as determined by far-Western (Fig. 2 and 3) and GST-pull-down (Fig. 4) experiments, and because the Paip1-PABP(C-term) interaction is consistent with a rearrangement model (Fig. 6; Table 2), such a deviation from a simple kinetic model is not surprising. Consequently, two more complex kinetic models were considered. First, a 2:1 model in which two Paip1 molecules bind to one PABP molecule was applied. Also, a 1:1 rearrangement model in which an initial binding event is followed by a rearrangement of the complex was examined. The 2:1 model and the 1:1 rearrangement model displayed similar fits and statistical values (Fig. 7B and C; Table 3). It is therefore difficult to discriminate between these two complex kinetic models by using this approach.
FIG. 7.
SPR analysis of the interaction between PABP and Paip1. Paip1 was injected, at the concentrations indicated, over a PABP surface (200 RU) and over a mock surface. Data were treated and integrated with a simple 1:1 model (A), a 2:1 model (B), or a 1:1 model with rearrangement of the protein complex (C). (Top panels) Experimental sensorgrams (points) and calculated fits (solid lines). (Bottom panels) Related residuals. Related kinetic constants are listed in Table 3.
TABLE 3.
Kinetic and thermodynamic constants for the full-length PABP-Paip1 interaction calculated by globally fitting the experimental data set shown in Fig. 7 to various kinetic models
| Parameter | Value (mean ± SD) in:
|
||
|---|---|---|---|
| Simple model | 2:1 stoichiometry model | Rearrangement model | |
| kass1 (M−1 s−1) | (9.0 ± 0.2) × 105 | (2.8 ± 0.3) × 105 | (1.11 ± 0.03) × 106 |
| kdiss1 (s−1) | (1.34 ± 0.04) × 10−3 | (2.7 ± 0.2) × 10−2 | (2.5 ± 0.2) × 10−2 |
| kass2 (M−1 s−1) | NAa | (1.35 ± 0.04) × 106 | (1.44 ± 0.06) × 10−2b |
| kdiss2 (s−1) | NA | (7.19 ± 0.06) × 10−4 | (1.32 ± 0.08) × 10−3 |
| Surface activity (RU) | 59.7 ± 0.8 | 43.4 ± 0.9 | 78.7 ± 1.4 |
| Kd1 (nM) | 1.48 ± 0.09c | 96 ± 16 | 22.6 ± 0.8 |
| Kd2 (nM) | NA | 0.53 ± 0.06 | 0.091 ± 0.009d |
| Kdapp (nM) | 1.48 ± 0.09 | NA | 1.9 ± 0.3e |
| SD of residuals (RU) | 1.396 | 1.024 | 1.046 |
| Z1 statistic | 20.97 | 11.33 | 11.77 |
| Z2 statistic | 2.328 | 1.328 | 1.461 |
NA, not applicable.
Per second.
Kd1 = kdiss1/kass1.
No unit.
Kdapp = [KA1 × (1 + KA2)]−1, with KA1 = Kd1−1 and KA2 = Kd2−1.
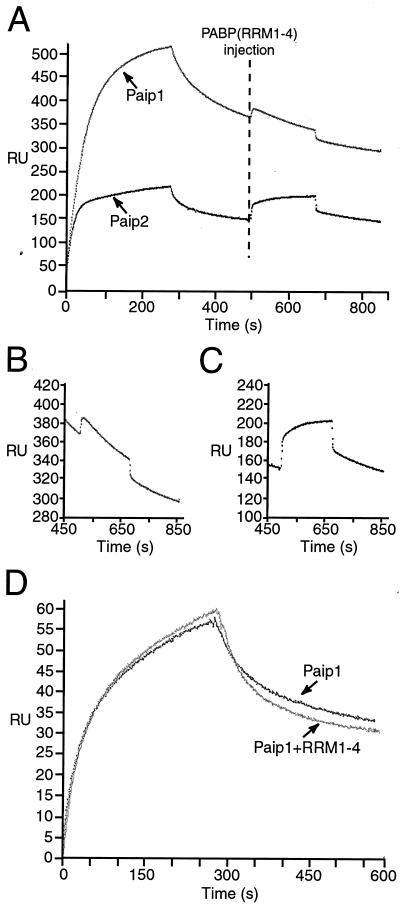
To address the question of stoichiometry, we asked whether PABP(RRM1-4) can bind to Paip1 that is prebound to full-length PABP. The rationale for this experiment is as follows: if two Paip1 molecules interact independently with the two binding sites on one PABP molecule, one PAM1 in one of the two Paip1 molecules should be free to interact with PABP(RRM1-4). Paip1 was injected over a PABP surface or a control surface, followed by a PABP(RRM1-4) injection. The experiment was also performed with Paip2 as a positive control, since it binds to PABP with a 2:1 stoichiometry (20). PABP(RRM1-4) failed to associate significantly with the Paip1 that was prebound to the PABP surface (Fig. 8A and B) (there is no change in the shape of the dissociation curve), whereas it associated with the Paip2 that was prebound to the PABP surface (Fig. 8A and C) [there is a change in the shape of the dissociation curve due to the association of RRM(1-4)]. Thus, in contrast to Paip2, Paip1 could not recruit PABP(RRM1-4) when it was already prebound to the full-length PABP. These results suggest that both PAMs in one Paip1 molecule simultaneously interact with one PABP molecule and are not available to associate with PABP(RRM1-4). Additional experiments were performed to address this issue (see below).
FIG. 8.
Stoichiometry of the PABP-Paip1 interaction determined by SPR. (A) Interactions between PABP(RRM1-4) and Paip1 or Paip2 captured on a PABP surface. Paip1 (1 μM) or Paip2 (100 nM) was injected over a PABP surface (1,500 RU) and a mock surface. The Paip1 and Paip2 injections were followed by an injection of PABP(RRM1-4) (100 nM) (dashed line). (B and C) Enlargements of PABP(RRM1-4) binding curves shown in panel A after injection of PABP(RRM1-4) for Paip1 (B) or Paip2 (C). (D) PABP(C-term) interactions with Paip1-PABP(RRM1-4) complex. Paip1 (25 nM) preincubated (or not) with PABP(RRM1-4) (75 nM) was injected (300 s) over a PABP(C-term) surface (150 RU) and a mock surface.
If the above interpretation is correct, then Paip1 would be expected to simultaneously interact with PABP(RRM1-4) and PABP(C-term) fragments. To examine this, Paip1 (25 nM) was preincubated with PABP(RRM1-4) (75 nM) and was injected over a PABP(C-term) surface or a control surface (Fig. 8D). Considering the Kd of the Paip1-PABP(RRM1-4) interaction (Kd = 0.56 nM [Table 1]), the majority of the injected Paip1 should be complexed with PABP(RRM1-4) at the concentrations used. The Paip1-PABP(RRM1-4) complex interacted with the PABP(C-term) surface (Fig. 8D). The dissociation observed in the case of the Paip1-PABP(RRM1-4) injection differed somewhat from that corresponding to the injection of Paip1 in the absence of PABP(RRM1-4) (Fig. 8D). This is likely due to the fact that two distinct dissociation events are being monitored: the PABP(RRM1-4) dissociation from the Paip1-PABP(C-term) complex and the Paip1-PABP(RRM1-4) dissociation from the PABP(C-term), hence altering the shape of the dissociation curves. PABP(RRM1-4) did not interact with the PABP(C-term) surface (data not shown; see also Fig. 9B). These results suggest that Paip1 can associate simultaneously with PABP(RRM1-4) and PABP(C-term) and support the 1:1 rearrangement model (i.e., 1:1 stoichiometry with two contact sites).
FIG. 9.
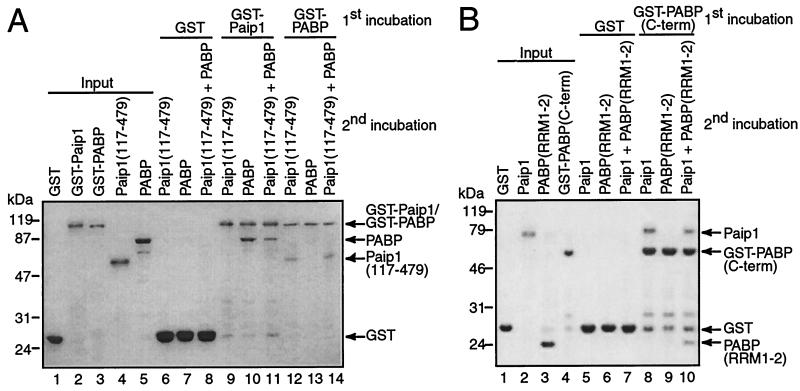
Stoichiometry of the PABP-Paip1 interaction in vitro. GST pull-down assays were performed with purified PABP and Paip1 fragments. (A) GST, GST-Paip1, and GST-PABP (5 μg) were immobilized on glutathione-Sepharose beads and incubated with Paip1(117-479) and/or PABP (5 μg). (B) GST and GST-PABP(C-term) (10 μg) were immobilized on glutathione-Sepharose beads and incubated with Paip1 (2.4 μg) and/or PABP(RRM1-2) (1.8 μg). Bound proteins were eluted in Laemmli loading buffer and analyzed by SDS-11% PAGE. One microgram of each protein was loaded as input. The gels were stained with Coomassie blue R-250. Positions of the molecular mass markers are shown on the left of each panel. Proteins are identified on the right of each panel. The presence of additional bands is due to protein degradation.
PABP and Paip1 interact with a 1:1 stoichiometry in vitro.
To validate the 1:1 stoichiometry rearrangement model obtained by SPR, we examined whether two Paip1 molecules could interact simultaneously with one PABP molecule by using GST pull-down assays with two differently tagged Paip1 proteins (Fig. 9A). Full-length GST-Paip1 was immobilized on glutathione-Sepharose, and Paip1(117-479) in combination with full-length PABP was then incubated with the matrix. Paip1(117-479), which possesses both PAMs, was used instead of full-length Paip1, as the latter comigrated with a degradation product of PABP in SDS-PAGE. The proteins used in this pull-down experiment were predominantly intact as observed by SDS-PAGE followed by Coomassie blue staining (Fig. 9A, input, lanes 1 to 5). GST immobilized on glutathione-Sepharose did not interact with Paip1(117-479) or full-length PABP (lanes 6 to 8). GST-Paip1 interacted with full-length PABP but not with Paip1(117-479) (lanes 9 and 10). Importantly, Paip1(117-479) did not coprecipitate with the GST-Paip1-PABP complex (lane 11). To determine whether two different PABP molecules can interact simultaneously with one Paip1 molecule, we used the same proteins and performed the reverse experiment. GST-PABP pulled down Paip1(117-479) but did not coprecipitate full-length PABP in the presence or absence of Paip1(117-479) (lanes 12 to 14). These results are consistent with a 1:1 stoichiometry for the interaction of PABP and Paip1. It is possible that these negative results reflect the inability to effectively pull down a ternary complex. However, these results were supported by further pull-down experiments as detailed below.
To further confirm the SPR results suggesting that one Paip1 molecule could contact the RRMs and the C-terminal regions of PABP simultaneously (1:1 stoichiometry with two contact sites), we performed additional GST pull-down assays with PABP fragments (Fig. 9B). The proteins used in this pull-down experiment were predominantly intact as observed by SDS-PAGE followed by Coomassie blue staining (Fig. 9B, input, lanes 1 to 4). GST did not interact with full-length Paip1 and PABP(RRM1-2) (lanes 5 to 7). GST-PABP(C-term) clearly precipitated full-length Paip1 but not PABP(RRM1-2) (lanes 8 and 9). Interestingly, GST-PABP(C-term) associated with PABP(RRM1-2) in the presence of full-length Paip1 (lane 10). This result confirms that Paip1 can interact simultaneously with RRMs 1 and 2 and the C-terminal domain of PABP and supports the 1:1 stoichiometry model. In addition, this experiment demonstrates that the interactions between Paip1 and the different PABP regions are relatively stable and that these pull-down experiments can effectively detect a ternary complex.
PABP and Paip1 interact with a 1:1 stoichiometry in HeLa cell extracts.
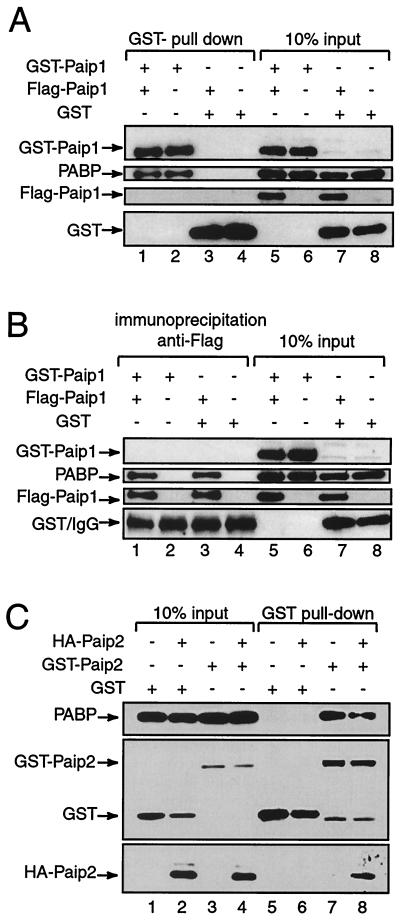
We wished to further establish the 1:1 stoichiometry model that was based on in vitro data by carrying out experiments using GST pull-down assays and immunoprecipitation with extracts prepared from HeLa cells. HeLa cells were cotransfected with various combinations of pcDNA3-GST, pcDNA3-GST-Paip1, and pcDNA3-Flag-Paip1, followed by GST pull-down assays on cell extracts. The levels of expression of recombinant GST, GST-Paip1, and Flag-Paip1, as well as endogenous PABP, are shown for each cotransfection set (Fig. 10A, lanes 5 to 8). Both GST and GST-Paip1 bound efficiently to the glutathione-Sepharose resin (lanes 1 to 4). As expected, endogenous PABP was associated with GST-Paip1 but not with GST (compare lanes 1 and 2 to lanes 3 and 4). However, Flag-Paip1 failed to associate with the GST-Paip1-PABP complex (lane 1) or GST (lane 3). To ensure that the transfected Flag-Paip1 protein is capable of binding to PABP, immunoprecipitation experiments with anti-Flag antibody were performed. The levels of expression of transfected proteins and endogenous PABP are shown for each cotransfection set (Fig. 10B, lanes 5 to 8). Flag-Paip1 immunoprecipitated with anti-Flag antibody and was associated with endogenous PABP (lanes 1 and 3). GST-Paip1 did not coprecipitate with the Flag-Paip1-PABP complex (lane 1). GST-Paip1 and GST were not immunoprecipitated with anti-Flag antibody (lanes 2 and 4). We estimate (by visual inspection) that the sensitivity of detection of the Flag-Paip1 and GST-Paip1 by the anti-Flag and anti-GST antibodies, respectively, is such that 0.5% of the transfected proteins would be detected in this assay. Approximately 10% of GST-Paip1 and Flag-Paip1 were precipitated with glutathione-Sepharose and Flag antibody, respectively (Fig. 10A, lanes 1 and 2, and B, lanes 1 and 3). Both proteins interact with similar affinity with endogenous PABP, since they both precipitated ∼5% of endogenous PABP (Fig. 10A, lanes 1 and 2, and B, lanes 1 and 3). Thus, if the stoichiometry of interaction were 2:1, equivalent amounts of both tagged Paip1 proteins would be expected to coprecipitate in a complex with PABP. This amount is ∼2.5% of the expressed GST-Paip1 or Flag-Paip1 and thus is fivefold above the level of detection (0.5% of the transfected proteins). Therefore, these data strongly suggest that only one Paip1 molecule can bind to one PABP molecule in cells, supporting the 1:1 stoichiometry model.
FIG. 10.
Stoichiometry of the PABP-Paip1 interaction in HeLa cell extracts. HeLa cells were cotransfected with different combinations of pcDNA3-GST, pcDNA3-GST-Paip1, pcDNA3-Flag-Paip1, pcDNA3-GST-Paip2, and pACTAG-2-Paip2 as indicated. GST pull-down assays using glutathione-Sepharose beads (A and C) or immunoprecipitations with anti-Flag antibody (B) were performed with protein extracts (300 μg) prepared from the transfected cells. Precipitated proteins (indicated as GST pull-down or immunoprecipitation anti-Flag) or expressed and endogenous proteins (30 μg; input) were resuspended in Laemmli sample buffer and resolved by and SDS-8 or 12.5% PAGE. Proteins were subsequently transferred onto a nitrocellulose membrane and detected by Western blotting with the following antibodies: anti-GST, anti-Flag, anti-HA, and anti-PABP (see Materials and Methods). Proteins are identified on the left of each panel. IgG, immunoglobulin G.
To further support this conclusion, it was pertinent to use a positive control for a 2:1 stoichiometry. We used Paip2, since we previously demonstrated that two Paip2 molecules could bind to one PABP molecule (20). We repeated these experiments with HeLa cells transfected with plasmids encoding GST, GST-Paip2, and HA-Paip2. The levels of expression of recombinant GST, GST-Paip2, and HA-Paip2 as well as endogenous PABP are shown for each cotransfection set (Fig. 10C, lanes 1 to 4). Both GST and GST-Paip2 were efficiently precipitated with glutathione-Sepharose resin (lanes 5 to 8). As expected, endogenous PABP coprecipitated with GST-Paip2 but not with GST (compare lanes 5 and 6 to lanes 7 and 8). Importantly, HA-Paip2 coprecipitated with the GST-Paip2-PABP complex (lane 8) but did not associate with GST (lane 6). This result confirms a 2:1 stoichiometry for the Paip2-PABP interaction and validates our technical approach. This control is particularly significant because the affinity of the PAM2 in Paip2 for PABP is 15-fold lower than that of Paip1 (Table 2) (20). Yet, in spite of the lower affinity, the simultaneous binding of two Paip2 molecules to PABP was detectable in the GST pull-down assay.
Taken together, our data demonstrate that Paip1 binds to PABP with a 1:1 stoichiometry and that the binding involves two contact sites on each of the interacting partners.
DISCUSSION
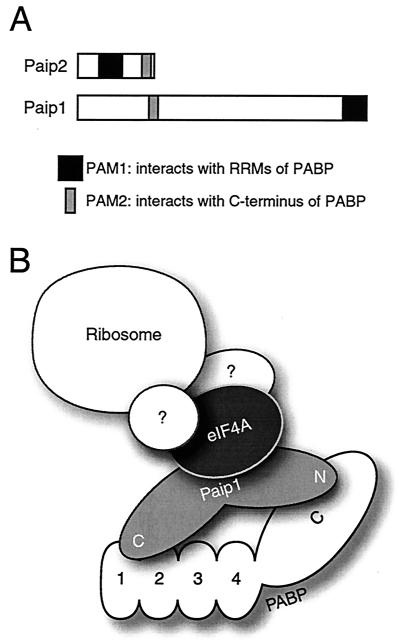
In this study, we mapped the mutual binding sites of Paip1 and PABP. Far-Western analysis revealed that both proteins contain two reciprocal binding sites (Fig. 2 and 3; a model is shown in Fig. 11A). Furthermore, GST pull-down experiments indicated that the PAM2 of Paip1 (aa 116 to 143) interacts within the last 138 aa of the C-terminal domain of PABP and that the acidic PAM1 of Paip1 (aa 440 to 479) interacts with the RRMs 1 and 2 of PABP (Fig. 4). Significantly, PAM1 and PAM2 are shared between Paip1 and Paip2. PAM1 is a 40- to 50-acidic-amino-acid-rich region (aa 440 to 479 in Paip1 and aa 22 to 75 in Paip2) which interacts with the RRMs of PABP (RRM1-2 and RRM2-3 for Paip1 and Paip2, respectively) (20). PAM2 is a conserved 15-amino-acid stretch (aa 123 to 137 of Paip1 and aa 106 to 120 of Paip2) that binds to the C terminus of PABP (Fig. 1A and 4).
FIG. 11.
Model of the Paip1-PABP interaction. (A) Schematic representation of the PAM1 and PAM2 domains in Paip1 and Paip2. PAM1 corresponds to aa 440 to 479 and 22 to 75 in Paip1 and Paip2, respectively. PAM2 is located at aa 123 to 137 and 106 to 120 in Paip1 and Paip2, respectively. (B) Paip1 and PABP interact with a 1:1 stoichiometry via two contact sites on each protein. The Paip1-PABP complex possibly interacts with eIF4A and other translation factors to participate in ribosome recruitment and translation initiation.
PAM1 of Paip1 was previously shown to interact with PABP (5). This region was further delimited here to a smaller stretch of amino acids (C-terminal 39 aa). In contrast, PAM2 of Paip1 was not identified in the original study because no Paip1 fragments N terminal of residue 135 were used for the mapping of PABP binding sites (5). Interestingly, PAM2 is conserved in several proteins with a role in translation, including Paip1, Paip2, and eukaryotic release factor 3, and in some with no apparent role in translation, such as ataxin-2 and transducer of ErbB-2 (8, 20, 23). Therefore, Paip1 and Paip2 may compete with C-terminal binding partners of PABP to modulate functions of PABP, such as translation, mRNA stabilization, or yet-unknown functions. In addition, the C-terminal domain of PABP, which interacts with PAM2, is conserved in the HYD family of ubiquitin ligases (8). Paip1 was shown to interact with the C terminus of the HYD ubiquitin ligase via PAM2 (8). These interactions could potentially target Paip1, Paip2, other PAM2 containing proteins, and possibly even PABP for degradation by the ubiquitination pathway (8). Ubiquitination may serve as a regulator of mRNA circularization and translation by affecting the half-lives of Paip1 and Paip2.
It was previously shown that Paip1 interacts with RRMs 1 and 2 (aa 3 to 182) of Xenopus PABP and with a C-terminal truncation of RRMs 1 and 2 (aa 3 to 137, compared to aa 1 to 189 of human PABP used in this study) (14). RRMs 1 and 2 are also responsible for the interaction of PABP with eIF4G (14). However, a C-terminal truncation of RRMs 1 and 2 of Xenopus PABP (aa 3 to 137) resulted in the loss of interaction with eIF4G (14). It will be important to investigate whether Paip1, eIF4G, and the poly(A) tail can bind simultaneously to RRMs 1 and 2 and to further characterize the effects of these interactions on translation. Unlike Paip1, Paip2 interacts with a sequence located within RRMs 2 and 3 and interferes with the binding of PABP to the poly(A) tail (20, 22), probably by steric hindrance. Paip1 also interacts with PABP fragments RRM2-3 and RRM3-4, but to a much lesser extent than with RRM1-2 (Fig. 3). It also interacts weakly with the individual RRM1 and RRM2 fragments (Fig. 3). Since RRMs 1 and 2 are responsible for most of the poly(A) binding activity of PABP (6, 24) and Paip1 interacts strongly with this region, additional experiments will be necessary to determine whether Paip1 binding to PABP affects the poly(A) binding affinity of PABP in solution. It is noteworthy, however, that Paip1 interacts with PABP which is bound to poly(A)-Sepharose (5).
The stoichiometry of the interactions of Paip1 with full-length PABP and PABP fragments was determined by a combination of SPR, GST pull-down, and immunoprecipitation experiments (Fig. 5 to 10). Paip1 interacts with both the RRMs and C-terminal fragments of PABP with a 1:1 stoichiometry (Fig. 5 and 6). Interestingly, the interactions of both Paip1 and Paip2 with the RRM region of PABP are well depicted by a simple 1:1 stoichiometry model, whereas their interactions with the C terminus of PABP are better depicted by a 1:1 stoichiometry rearrangement model. The interaction of Paip1 with the RRM region is about 10-fold stronger than that with the C-terminal domain of PABP (Kd = 0.56 and 5.7 nM, respectively [Tables 1 and 2]), compared to a >200-fold difference in Paip2 (Kd = 0.31 and 85 nM, respectively) (20). Strikingly, the kinetic and thermodynamic constants for the interactions between Paip1 and Paip2 with the PABP(RRM1-4) fragment are very similar (Kd = 0.56 and 0.31 nM, kass= 1.31 × 10⁶ and 1.9 × 10⁶ M−1 s−1, and kdiss = 7.4 × 10⁻⁴ and 6 × 10⁻⁴ s−1 for Paip1 and Paip2, respectively) (Table 1) (20).
In contrast to the similarity of the Paip1 and Paip2 interactions with the PABP(RRM1-4) region, the kinetic and thermodynamic constants for the interactions with the PABP(C-term) fragment are different. Paip1 has a 15-fold-higher affinity for the C terminus of PABP than Paip2 (Kdapp= 5.7 and 85 nM for Paip1 and Paip2, respectively) (Table 2) (20). This difference is mainly due to a higher association rate (kass1 = 4.9 × 10⁵ and 1.1 × 10⁵ M−1 s−1 for Paip1 and Paip2, respectively) (Table 2) (20) and to a higher rearrangement rate (kass2 = 12 × 10−3 and 3 × 10⁻³ s−1 for Paip1 and Paip2, respectively) (Table 2) (20). In both cases, the protein complex dissociation rates (kdiss1) are similar (2.3 × 10⁻² and 2.5 × 10⁻² s−1 for Paip1 and Paip2, respectively) (Table 2) (20). The difference in the affinities of Paip1 and Paip2 for the C-terminal region of PABP, as well as the existence of other C-terminal PABP binding partners, suggests that this region plays an important role in modulating the activity of PABP by recruiting different binding partners depending on their relative affinities and different local concentrations. The physiological significance of this needs to be examined.
We previously demonstrated that the interaction between Paip2 and full-length PABP is consistent with a 2:1 stoichiometry model (20). Paip2 exhibits the same affinity for the RRM and the C-terminal domains of PABP when full-length PABP or PABP fragments are used (20). In contrast, this study provides strong evidence that the interaction of Paip1 with PABP occurs with a 1:1 stoichiometry (Fig. 8 to 10). According to the SPR data, the interaction between Paip1 and full-length PABP has an apparent Kd of 1.9 nM (Table 3), which is intermediate to the Kds of the Paip1-PABP(RRM1-4) and Paip1-PABP(C-term) interactions (0.56 nM [Table 1] and 5.7 nM [Table 2], respectively). In light of the 1:1 stoichiometry model for the interaction between full-length PABP and Paip1 and the association rates for the interaction of the RRMs and the C terminus of PABP (compare kass1 in Tables 1 and 2), it is likely that Paip1 first binds to the RRM region and then contacts the C terminus of PABP. This multiple-contact mode of binding may weaken the RRMs-Paip1 interaction, thereby explaining why the Kd for Paip1 binding to full-length PABP falls between the Kd values determined for the PABP fragments. Interestingly, the kinetic constants for the rearrangement step of Paip1 binding to full-length PABP and to the C-terminal fragment of PABP are strikingly similar (compare kass2 and kdiss2 in Tables 2 and 3). This rearrangement step may correspond to a change in conformation, which occurs when Paip1 binds to the C terminus of PABP, in the contexts of both the fragment and full-length PABP. We found that the same kinetic model (1:1 stoichiometry with rearrangement) fit the data for the binding of Paip2 to the C terminus of PABP (20). It was suggested from nuclear magnetic resonance studies that Paip2, which is unfolded, becomes structured by an induced-fit mechanism upon binding to the C terminus of PABP (23). Accordingly, this induced folding of Paip2 may correspond to the rearrangement step that was detected by SPR. Since SPR also detected a rearrangement step for Paip1, it may be that Paip1 is unfolded and becomes structured upon binding.
Paip2, which is a small protein (14 kDa), interacts with PABP with a 2:1 stoichiometry (20); however, Paip1 interacts with a 1:1 stoichiometry. Interestingly, a similar 1:1 stoichiometry was shown for two other translation initiation factors. eIF4G possesses two separate eIF4A binding sites, one in its middle domain and the other in its C-terminal domain (17, 29). However, it was proposed that one eIF4A molecule contacts both eIF4A binding sites in eIF4G simultaneously (17, 29). This is also supported by in vivo data (27). It was shown that the eIF4A binding to the C terminus of eIF4G has a modulatory function (29). It is possible that a similar mechanism exists for the PABP-Paip1 interaction.
Since both Paip1 and eIF4G interact with eIF4A and PABP (5, 16, 17), it will be interesting to determine if these proteins are found together in a complex that regulates translation initiation and to elucidate the stoichiometry of these proteins in such a complex (Fig. 11B). It will also be important to map the eIF4A binding site in Paip1 as well as the Paip1 and eIF4G binding sites in eIF4A.
In conclusion, PABP possesses two Paip1 binding sites, one located within RRMs 1 and 2 and the other located within the C-terminal domain. Paip1 also possesses two PABP binding sites, PAM1 and PAM2. PAM1, the higher-affinity binding site, is located within the C terminus of Paip1 (aa 440 to 479) and binds to RRMs 1 and 2. PAM2, the lower-affinity binding site, is located within the N terminus of Paip1 (aa 116 to 143) and interacts with the C terminus of PABP. Paip1 interacts with PABP with a 1:1 stoichiometry, in contrast to Paip2, which binds to PABP with a 2:1 stoichiometry. These newly described interactions will serve as a basis to design dominant negative mutants of Paip1 and PABP which may be used to shed more light on the roles of these proteins and their mechanisms of action in translation regulation.
Acknowledgments
We thank C. Lister and C. Binda for excellent technical assistance and Y. Svitkin, H. Imataka, J. Berlanga, A. Brasey, and J. Dostie for helpful discussions. We thank A. Baass and D. Fantus for help in the preparation and purification of Paip1 deletion mutants. We thank M. Miron and J. Dostie for anti-GST antibody and H. Imataka for plasmid pcDNA3-GST.
This research was supported by a grant from the Canadian Institute of Health Research (CIHR). N.S. is a CIHR distinguished scientist and a Howard Hughes Medical Institute International Scholar. G.R., K.K., and A.K. are recipients of predoctoral studentships from the CIHR. G.R. is the recipient of a McGill Major studentship. G.D.C. is supported by the Protein Engineering Network of Centres of Excellence.
REFERENCES
- 1.Afonina, E., M. Neumann, and G. N. Pavlakis. 1997. Preferential binding of poly(A)-binding protein 1 to an inhibitory RNA element in the human immunodeficiency virus type 1 gag mRNA. J. Biol. Chem. 272:2307-2311. [DOI] [PubMed] [Google Scholar]
- 2.Bradley, J. V. 1968. Distribution-free statistical tests. Prentice-Hall Inc., Englewood Cliffs, N.J.
- 3.Chen, B. P., and T. Hai. 1994. Expression vectors for affinity purification and radiolabeling of proteins using Escherichia coli as host. Gene 139:73-75. [DOI] [PubMed] [Google Scholar]
- 4.Conlon, I., and M. Raff. 1999. Size control in animal development. Cell 96:235-244. [DOI] [PubMed] [Google Scholar]
- 5.Craig, A. W., A. Haghighat, A. T. Yu, and N. Sonenberg. 1998. Interaction of polyadenylate-binding protein with the eIF4G homologue PAIP enhances translation. Nature 392:520-523. [DOI] [PubMed] [Google Scholar]
- 6.Deardorff, J. A., and A. B. Sachs. 1997. Differential effects of aromatic and charged residue substitutions in the RNA binding domains of the yeast poly(A)-binding protein. J. Mol. Biol. 269:67-81. [DOI] [PubMed] [Google Scholar]
- 7.De Crescenzo, G., S. Grothe, R. Lortie, M. T. Debanne, and M. O'Connor-McCourt. 2000. Real-time kinetic studies on the interaction of transforming growth factor alpha with the epidermal growth factor receptor extracellular domain reveal a conformational change model. Biochemistry 39:9466-9476. [DOI] [PubMed] [Google Scholar]
- 8.Deo, R. C., N. Sonenberg, and S. K. Burley. 2001. X-ray structure of the human hyperplastic discs protein: an ortholog of the C-terminal domain of poly(A)-binding protein. Proc. Natl. Acad. Sci. USA 98:4414-4419. [DOI] [PMC free article] [PubMed] [Google Scholar]
- 9.Fuerst, T. R., E. G. Niles, F. W. Studier, and B. Moss. 1986. Eukaryotic transient-expression system based on recombinant vaccinia virus that synthesizes bacteriophage T7 RNA polymerase. Proc. Natl. Acad. Sci. USA 83:8122-8126. [DOI] [PMC free article] [PubMed] [Google Scholar]
- 10.Gallie, D. R. 1991. The cap and poly(A) tail function synergistically to regulate mRNA translational efficiency. Genes Dev. 5:2108-2116. [DOI] [PubMed] [Google Scholar]
- 11.Gallie, D. R. 1998. A tale of two termini: a functional interaction between the termini of an mRNA is a prerequisite for efficient translation initiation. Gene 216:1-11. [DOI] [PubMed] [Google Scholar]
- 12.Gingras, A.-C., B. Raught, and N. Sonenberg. 1999. eIF4 initiation factors: effectors of mRNA recruitment to ribosomes and regulators of translation. Annu. Rev. Biochem. 68:913-963. [DOI] [PubMed] [Google Scholar]
- 13.Glaser, R. W. 1993. Antigen-antibody binding and mass transport by convection and diffusion to a surface: a two-dimensional computer model of binding and dissociation kinetics. Anal. Biochem. 213:152-161. [DOI] [PubMed] [Google Scholar]
- 14.Gray, N. K., J. M. Coller, K. S. Dickson, and M. Wickens. 2000. Multiple portions of poly(A)-binding protein stimulate translation in vivo. EMBO J. 19:4723-4733. [DOI] [PMC free article] [PubMed] [Google Scholar]
- 15.Grosset, C., C. Y. Chen, N. Xu, N. Sonenberg, H. Jacquemin-Sablon, and A. B. Shyu. 2000. A mechanism for translationally coupled mRNA turnover: interaction between the poly(A) tail and a c-fos RNA coding determinant via a protein complex. Cell 103:29-40. [DOI] [PubMed] [Google Scholar]
- 16.Imataka, H., A. Gradi, and N. Sonenberg. 1998. A newly identified N-terminal amino acid sequence of human eIF4G binds poly(A)-binding protein and functions in poly(A)-dependent translation. EMBO J. 17:7480-7489. [DOI] [PMC free article] [PubMed] [Google Scholar]
- 17.Imataka, H., and N. Sonenberg. 1997. Human eukaryotic translation initiation factor 4G (eIF4G) possesses two separate and independent binding sites for eIF4A. Mol. Cell. Biol. 17:6940-6947. [DOI] [PMC free article] [PubMed] [Google Scholar]
- 18.Jacobson, A. 1996. Poly(A) metabolism and translation: the closed-loop model, p. 451-479. In J. W. B. Hershey, M. B. Mathews, and N. Sonenberg (ed.), Translational control. Cold Spring Harbor Laboratory Press, Cold Spring Harbor, N.Y.
- 19.Kahvejian, A., G. Roy, and N. Sonenberg. The mRNA closed loop model: the function of PABP and PABP-interacting proteins in mRNA translation. Cold Spring Harbor Symp. Quant. Biol., in press. [DOI] [PubMed]
- 20.Khaleghpour, K., A. Kahvejian, G. De Crescenzo, G. Roy, Y. V. Svitkin, H. Imataka, M. O'Connor-McCourt, and N. Sonenberg. 2001. Dual interactions of the translational repressor Paip2 with poly(A) binding protein. Mol. Cell. Biol. 21:5200-5213. [DOI] [PMC free article] [PubMed] [Google Scholar]
- 21.Khaleghpour, K., S. Pyronnet, A. C. Gingras, and N. Sonenberg. 1999. Translational homeostasis: eukaryotic translation initiation factor 4E control of 4E-binding protein 1 and p70 S6 kinase activities. Mol. Cell. Biol. 19:4302-4310. [DOI] [PMC free article] [PubMed] [Google Scholar]
- 22.Khaleghpour, K., Y. V. Svitkin, A. W. Craig, C. T. DeMaria, R. C. Deo, S. K. Burley, and N. Sonenberg. 2001. Translational repression by a novel partner of human poly(A) binding protein, Paip2. Mol. Cell 7:205-216. [DOI] [PubMed] [Google Scholar]
- 23.Kozlov, G., J. F. Trempe, K. Khaleghpour, A. Kahvejian, I. Ekiel, and K. Gehring. 2001. Structure and function of the C-terminal PABC domain of human poly(A)-binding protein. Proc. Natl. Acad. Sci. USA 98:4409-4413. [DOI] [PMC free article] [PubMed] [Google Scholar]
- 24.Kuhn, U., and T. Pieler. 1996. Xenopus poly(A) binding protein: functional domains in RNA binding and protein-protein interaction. J. Mol. Biol. 256:20-30. [DOI] [PubMed] [Google Scholar]
- 25.Laemmli, U. K. 1970. Cleavage of structural proteins during the assembly of the head of bacteriophage T4. Nature 227:680-685. [DOI] [PubMed] [Google Scholar]
- 26.Le, H., R. L. Tanguay, M. L. Balasta, C. C. Wei, K. S. Browning, A. M. Metz, D. J. Goss, and D. R. Gallie. 1997. Translation initiation factors eIF-iso4G and eIF-4B interact with the poly(A)-binding protein and increase its RNA binding activity. J. Biol. Chem. 272:16247-16255. [DOI] [PubMed] [Google Scholar]
- 27.Li, W., G. J. Belsham, and C. G. Proud. 2001. Eukaryotic initiation factors 4A (eIF4A) and 4G (eIF4G) mutually interact in a 1:1 ratio in vivo. J. Biol. Chem. 276:29111-29115. [DOI] [PubMed] [Google Scholar]
- 28.Miron, M., J. Verdu, P. E. Lachance, M. J. Birnbaum, P. F. Lasko, and N. Sonenberg. 2001. The translational inhibitor 4E-BP is an effector of PI(3)K/Akt signalling and cell growth in Drosophila. Nat. Cell Biol. 3:596-601. [DOI] [PubMed] [Google Scholar]
- 29.Morino, S., H. Imataka, Y. V. Svitkin, T. V. Pestova, and N. Sonenberg. 2000. Eukaryotic translation initiation factor 4E (eIF4E) binding site and the middle one-third of eIF4GI constitute the core domain for cap-dependent translation, and the C-terminal one-third functions as a modulatory region. Mol. Cell. Biol. 20:468-477. [DOI] [PMC free article] [PubMed] [Google Scholar]
- 30.Myszka, D. G., X. He, M. Dembo, T. A. Morton, and B. Goldstein. 1998. Extending the range of rate constants available from BIACORE: interpreting mass transport-influenced binding data. Biophys. J. 75:583-594. [DOI] [PMC free article] [PubMed] [Google Scholar]
- 31.Myszka, D. G., T. A. Morton, M. L. Doyle, and I. M. Chaiken. 1997. Kinetic analysis of a protein antigen-antibody interaction limited by mass transport on an optical biosensor. Biophys. Chem. 64:127-137. [DOI] [PubMed] [Google Scholar]
- 32.Nietfeld, W., H. Mentzel, and T. Pieler. 1990. The Xenopus laevis poly(A) binding protein is composed of multiple functionally independent RNA binding domains. EMBO J. 9:3699-3705. [DOI] [PMC free article] [PubMed] [Google Scholar]
- 33.O'Shannessy, D. J., and D. J. Winzor. 1996. Interpretation of deviations from pseudo-first-order kinetic behavior in the characterization of ligand binding by biosensor technology. Anal. Biochem. 236:275-283. [DOI] [PubMed] [Google Scholar]
- 34.Rich, R. L., and D. G. Myszka. 2000. Advances in surface plasmon resonance biosensor analysis. Curr. Opin. Biotechnol. 11:54-61. [DOI] [PubMed] [Google Scholar]
- 35.Sachs, A. 2000. Physical and functional interactions between the mRNA cap structure and the poly(A) tail, p. 447-466. In N. Sonenberg, J. W. B. Hershey, and M. B. Mathews (ed.), Translational control of gene expression. Cold Spring Harbor Laboratory Press, Cold Spring Harbor, N.Y.
- 36.Sachs, A. B., R. W. Davis, and R. D. Kornberg. 1987. A single domain of yeast poly(A)-binding protein is necessary and sufficient for RNA binding and cell viability. Mol. Cell. Biol. 7:3268-3276. [DOI] [PMC free article] [PubMed] [Google Scholar]
- 37.Sachs, A. B., P. Sarnow, and M. W. Hentze. 1997. Starting at the beginning, middle, and end: translation initiation in eukaryotes. Cell 89:831-838. [DOI] [PubMed] [Google Scholar]
- 38.Searfoss, A., T. E. Dever, and R. Wickner. 2001. Linking the 3′ poly(A) tail to the subunit joining step of translation initiation: relations of Pab1p, eukaryotic translation initiation factor 5B (Fun12p), and Ski2p-Slh1p. Mol. Cell. Biol. 21:4900-4908. [DOI] [PMC free article] [PubMed] [Google Scholar]
- 39.Tarun, S. Z. J., and A. B. Sachs. 1996. Association of the yeast poly(A) tail binding protein with translation initiation factor eIF-4G. EMBO J. 15:7168-7177. [PMC free article] [PubMed] [Google Scholar]
- 40.Tarun, S. Z. J., and A. B. Sachs. 1995. A common function for mRNA 5′ and 3′ ends in translation initiation in yeast. Genes Dev. 9:2997-3007. [DOI] [PubMed] [Google Scholar]
- 41.Wells, S. E., P. E. Hillner, R. D. Vale, and A. B. Sachs. 1998. Circularization of mRNA by eukaryotic translation initiation factors. Mol. Cell 2:135-140. [DOI] [PubMed] [Google Scholar]


