Abstract
Microsomal and mitochondrial isoforms of glycerol-3-phosphate acyltransferase (GPAT; E.C. 2.3.1.15) catalyze the committed step in glycerolipid synthesis. The mitochondrial isoform, mtGPAT, was believed to control the positioning of saturated fatty acids at the sn-1 position of phospholipids, and nutritional, hormonal, and overexpression studies suggested that mtGPAT activity is important for the synthesis of triacylglycerol. To determine whether these purported functions were true, we constructed mice deficient in mtGPAT. mtGPAT−/− mice weighed less than controls and had reduced gonadal fat pad weights and lower hepatic triacylglycerol content, plasma triacylglycerol, and very low density lipoprotein triacylglycerol secretion. As predicted, in mtGPAT−/− liver, the palmitate content was lower in triacylglycerol, phosphatidylcholine, and phosphatidylethanolamine. Positional analysis revealed that mtGPAT−/− liver phosphatidylethanolamine and phosphatidylcholine had about 21% less palmitate in the sn-1 position and 36 and 40%, respectively, more arachidonate in the sn-2 position. These data confirm the important role of mtGPAT in the synthesis of triacylglycerol, in the fatty acid content of triacylglycerol and cholesterol esters, and in the positioning of specific fatty acids, particularly palmitate and arachidonate, in phospholipids. The increase in arachidonate may be functionally significant in terms of eicosanoid production.
The regulation of triacylglycerol and phospholipid synthesis plays a critical role in disorders such as obesity, diabetes, and atherosclerosis. Triacylglycerol is the major storage form of energy in animals, as well as being a major component of secreted products such as very low density lipoprotein (VLDL) chylomicra and milk. Phospholipids, the primary lipid components of cellular membranes, are essential for the synthesis and secretion of bile and lipoproteins, as well as providing a reservoir of signaling molecules like lysophosphatidic acid (LPA), phosphatidic acid (PA), diacylglycerol, and the arachidonate- and eicosapentanoate-derived eicosanoids.
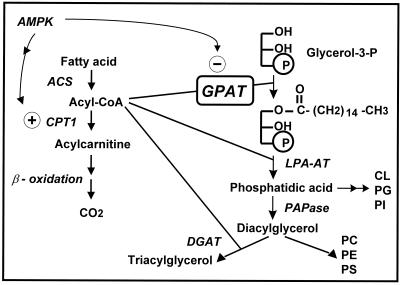
The synthesis of triacylglycerol and the glycerophospholipids begins with the acylation of glycerol-3-phosphate by glycerol-3-phosphate acyltransferase (GPAT) to form LPA (Fig. 1). Mammalian tissues contain two GPAT isoforms that are encoded by independent genes (7). One isoform is located in the outer mitochondrial membrane (mtGPAT), and the other is present in the endoplasmic reticulum (microsomal GPAT) (2). Although microsomal GPAT has not been purified or cloned, its enzymatic activity can be distinguished because, unlike mtGPAT, it is inhibited by sulfhydryl reagents (2). In most tissues, the mitochondrial isoform comprises 10% of the total GPAT activity, but in liver, mtGPAT contributes 30 to 50% of the total activity (7).
FIG. 1.
Pathways of glycerolipid synthesis and acylcarnitine formation. Abbreviations: ACS, acyl-CoA synthetase; AMPK, AMP-activated kinase; DGAT, diacylglycerol acyltransferase; LPA-AT, lysophosphatidic acid acyltransferase; PAPase, PA phosphatase. AMPK phosphorylates and inactivates acetyl-CoA carboxylase, thereby decreasing the production of malonyl-CoA and relieving its inhibition of CPT-1. AMPK simultaneously phosphorylates and inactivates mtGPAT.
The independent roles of the two GPAT isoforms have been the subject of debate. Because the terminal enzymes of triacylglycerol, phosphatidylcholine (PC), and phosphatidylethanolamine (PE) biosynthesis reside only in the endoplasmic reticulum (16), synthesis of these glycerolipids would require transfer of the LPA product formed by mtGPAT (or the phosphatidic acid formed by the mitochondrial LPA acyltransferase) to the endoplasmic reticulum. The role of mtGPAT might be limited, therefore, to the synthesis of mitochondrion-specific phospholipids like cardiolipin (2). Successful cloning of mouse and rat mtGPAT (3, 42), however, has shown that mtGPAT mRNA expression is regulated nutritionally and hormonally in a manner consistent with a critical role in the synthesis of triacylglycerol, postnatally when pups change from a high-glucose diet in utero to a high-fat milk diet in differentiating 3T3-L1 adipocytes, 6 h after insulin is given to streptozotocin-diabetic mice, and when food-restricted mice are refed a high-carbohydrate, fat-free diet (7, 10). The role of mtGPAT in up-regulating triacylglycerol synthesis is further supported by work done in our laboratory showing that 3.8-fold overexpression of mtGPAT activity in CHO cells results in a 2.7-fold increase in triacylglycerol mass and that adding tracer amounts of [14C]oleate to transfected CHO or HEK293 cells results in 3.4- to 9.7-fold greater incorporation into triacylglycerol at 24 h than in control cells (17).
In addition to up-regulating triacylglycerol synthesis via an increase in its specific activity, mtGPAT may also direct the flux of fatty acids toward glycerolipid synthesis and away from β-oxidation. Because both mtGPAT and carnitine palmitoyltransferase 1 (CPT-1) are located on the outer mitochondrial membrane, they can compete for acyl coenzymes A (acyl-CoAs). In fact, CPT-1 and mtGPAT appear to be reciprocally regulated by AMP-activated kinase, a sensor of cellular energy stores (Fig. 1) (20). Direct incubation of purified mitochondrial fractions with recombinant AMPKα-1 and -2 inhibits GPAT activity (32). Because AMPK inhibits mtGPAT and blocks the synthesis of malonyl-CoA, a potent inhibitor of CPT-1, fatty acid oxidation would be expected to increase (20). This prediction was validated when isolated rat hepatocytes were incubated with an AMP analog that activated AMPK and caused 50 and 38% decreases in incorporation of [14C]oleate and [3H]glycerol, respectively, into triacylglycerol (32). Similarly, incubation of isolated oxidative soleus muscle with the AMP analog decreased the incorporation of [14C]oleate into triacylglycerol 37% and increased the production of [14C]CO2 48% (32). Thus, when cellular energy stores are low, AMPK reciprocally regulates the outer membrane proteins CPT-1 and mtGPAT, thereby decreasing triacylglycerol synthesis and up-regulating β-oxidation. Combined, these data further strengthen the proposed functional role of mtGPAT in controlling the rate of triacylglycerol synthesis.
Microsomal GPAT esterifies both saturated and unsaturated fatty acyl-CoAs equally well, but mtGPAT has a marked preference for palmitoyl-CoA (16:0) (2). In the liver, kidneys, and heart, mtGPAT activity is 3- to 10-fold higher with 16:0-CoA than with 18:1-CoA and other long-chain fatty acyl-CoAs (4, 14, 28, 29). The activity of mouse recombinant mtGPAT expressed in Sf9 insect cells is 5.5-fold higher with 16:0-CoA than with 18:1-, 18:2n6-, or 18:3n3-CoA, and no activity is observed with 20:4n6-CoA (43). The relative preference for palmitate versus oleate can be altered by reconstituting partially purified mtGPAT with different phospholipids (19). Because most naturally occurring glycerolipids contain primarily saturated fatty acids at the sn-1 position and unsaturated fatty acids at the sn-2 position (30), it has been hypothesized that mtGPAT establishes this initial asymmetric distribution of fatty acid. Subsequently, both positions may be remodeled by phospholipases and lysophospholipid acyltransferases (23, 34). The resulting asymmetric distribution of fatty acids is believed to be important in maintaining the functional and structural role of phospholipids in biological membranes, as well as determining the amount of arachidonate available at the sn-2 position for release by phospholipase A2 (PLA2) for eicosanoid synthesis (11, 35-37).
Thus, indirect data suggest that mtGPAT regulates the rate of incorporation of fatty acid into triacylglycerol and ensures the correct positional distribution of saturated and unsaturated fatty acids in phospholipids. To determine whether either or both of these hypotheses are valid, we constructed a mouse that lacks mtGPAT.
MATERIALS AND METHODS
Targeting construct.
A lambda phage library containing 129/SvEv mouse genomic DNA was screened by using two fragments from rat mtGPAT cDNA as probes. Probe A is a 0.8-kb fragment (bp 785 to 1582; ATG = 1) that contains active-site homology regions II (bp 814 to 834), III (bp 934 to 969), and IV (bp 1039 to1062) (25). Probe B is a 0.6-kb fragment (bp 1583 to 2194) that contains the 3′ end of the gene (3). Two phage clones were characterized by restriction mapping and sequencing. A partial map of the gene structure was made in relation to the published cDNA sequence (GenBank accession no. M77003). A targeting vector was designed to delete 0.5 kb of the mtGPAT gene that codes for 62 amino acid residues including homology regions II and III (Fig. 2). A 1.3-kb HindIII fragment was used as the 5′ arm of homology, and a 4.5-kb SmaI/EcoRV fragment was used as the 3′ arm of homology. These two fragments flank the neomycin resistance gene, pMC1neo (27). The targeting plasmid was linearized and electroporated into 129SvEv-derived embryonic stem cells (TC-1; a gift from Phil Leder, Harvard University, Boston, Mass.); G418/ganciclovir-resistant colonies were expanded, and homologous recombinants were screened by PCR analysis, followed by confirmation with Southern blot analysis. Primers used for the PCR screening were 5′-TAGGACAGCTGACAGCAGACT-3′, corresponding to a genomic sequence upstream of the HindIII site, and 5′-TTATGGCGCGCCATCGATCT-3′, corresponding to the neo insert.
FIG. 2.
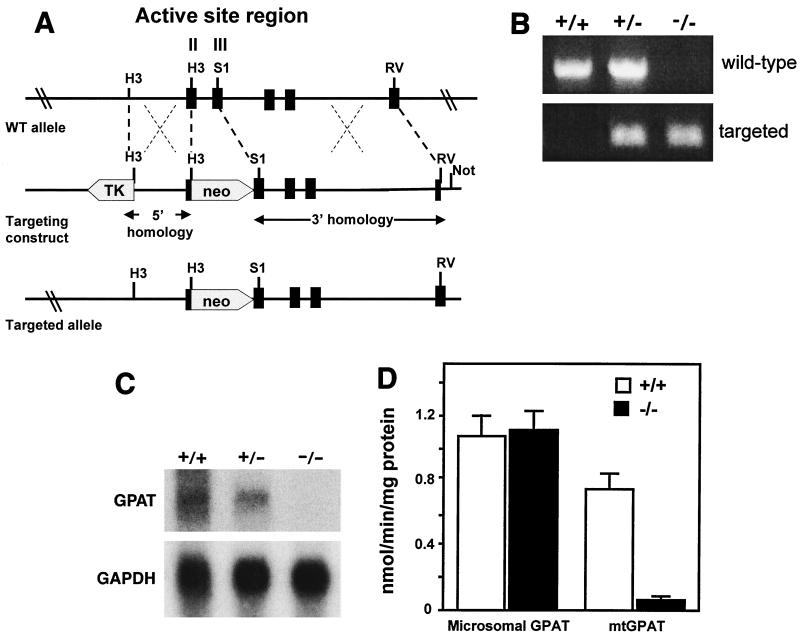
Generation of mice deficient in mtGPAT. (A) Targeting strategy. Homologous recombination of the targeting construct with the wild-type (WT) mtGPAT allele results in the replacement of 0.5 kb of the mtGPAT genomic sequence with neo (wide arrow) and deletes mtGPAT homology blocks II and III. (B) PCR amplification. The +/+ lane shows a 700-bp band corresponding to the amplified wild-type fragment. The targeted allele is identified by a 400-bp fragment that contains the neo sequence. (C) Northern blot analysis of mtGPAT expression in liver tissue probed with mtGPAT cDNA probe A. The results (not shown) obtained with cDNA probe B were identical. The blot was reprobed with a glyceraldehyde-3-phosphate dehydrogenase (GAPDH) fragment as a control for equivalent sample loading. (D) Microsomal GPAT and mtGPAT specific activities. Liver total membrane fractions (n = 3 for each genotype) were assayed for GPAT activity in the presence and absence of 2 mM N-ethylmaleimide as described in Materials and Methods.
Generation of mtGPAT-deficient mice.
The animal protocols used were approved by the University of North Carolina at Chapel Hill Institutional Animal Care and Use Committee. mtGPAT-deficient mice were generated by standard gene-targeting methods (21). Male chimeras were generated and mated with C57BL/B6J females. F2 mice were genotyped by PCR with primers A (5′-GGCAATAACTCCGTCTCCTT-3′, corresponding to a genomic sequence upstream of the HindIII site), B (5′-GAAGATCTCCAGGAACTGCT-3′, corresponding to the genomic sequence in the 3′-flanking sequence), and C (5′-TTATGGCGCGCCATCGATCT-3′, corresponding to neo) in a 40-cycle reaction (93°C for 30s, 57°C for 30s, and 65°C for 2 min). Primers A and B amplify a 700-bp fragment of the wild-type allele. Primers A and C amplify a 400-bp fragment of the targeted allele.
Mice were housed in a pathogen-free barrier facility on a 12-h-12-h light-dark cycle and had free access to water and Prolab RMH 3000 no. SP76 chow (26.0% of calories from protein, 14.0% of calories from fat, and 60% of calories from carbohydrate). The fatty acid composition of the chow lipid was analyzed by gas chromatography (GC) (n = 3) and found to be 17.8% 16:0, 6.7% 18:0, 26.1% 18:1n9, 35.0% 18:2n6, 3.4% 18:3n3, 0.05% 20:3n6, 0.15% 20:4n6, 1.2% 20:5n3, and 0.85% 22:6n3. Two-month-old F2 mice on a 50% C57BL/6J and 50% 129SvEv genetic background were used in all of the experiments described here, except in those for body weight and fat pad weight, which included mice up to 10 and 12 months old, respectively.
Isolation and analysis of RNA.
Total RNA was isolated from livers by using TRIzol (Invitrogen). Total RNA (20 μg) was denatured in formamide, run on a 1.1% agarose gel containing 3% formaldehyde, and transferred to a nylon membrane. Probes A and B for mtGPAT and a probe for glyceraldehyde-3-phosphate dehydrogenase were labeled with [32P]CTP by random priming (Roche). The signal was quantified by a Molecular Dynamics Storm 840 and ImageQuant software.
Subcellular fractionation and GPAT enzyme assays.
Livers from 2-month-old mice were homogenized with 10 up-and-down strokes in a Teflon-glass homogenizer in 10 mM Tris (pH 7.4)-250 mM sucrose-1 mM dithiothreitol-1 mM EDTA. The total membrane fraction was isolated by centrifugation at 100,000 × g for 1 h. Protein concentration was determined by the bicinchoninic acid method (Pierce) with bovine serum albumin as the standard. GPAT activity was assayed for 10 min at 25°C with 800 μM [H3]glycerol-3-phosphate and 100 μM palmitoyl-CoA in the presence or absence of 2 mM N-ethylmaleimide, which inhibits only the microsomal isoform (6). All assays measured initial rates. [3H]glycerol-3-phosphate was synthesized enzymatically (5).
Blood chemistries and lipids.
Mice were fasted for 4 h, anesthetized with Avertin, and bled retroorbitally. Plasma triglycerides (GPO-Trinder; Sigma), total cholesterol (Cholesterol CII; Wako), free fatty acids (NEFA; Wako), and glucose (Glucose Trinder; Sigma) were determined by enzymatic colorimetric methods. Insulin was determined by radioimmunoassay (Linco). High-density lipoprotein (HDL) cholesterol was measured as described by Warnick et al. (41). Pooled plasma samples (total, 100 μl) were fractionated by fast protein liquid chromatography with a Superose 6 HR10/30 column (Pharmacia Biotech Inc.) To determine VLDL secretion rates, 2-month-old F2 female mice (mtGPAT+/+, n = 5; mtGPAT−/−, n = 4) were fasted for 4 h and then given 10% fructose to drink (26). Plasma was collected for triglyceride measurements at time zero and at 20, 40, 60, 80, 120, and 180 min after injection of 20 mg of Triton WR-1339 (Tyloxapol; Sigma) in a volume of 200 μl. At the final time point, mice were euthanized and livers were collected and weighed. The rate of VLDL secretion was expressed as the concentration of triglyceride (milligrams per deciliter) per gram of liver per hour.
Tissue lipids.
Total lipid extract (12) from 100 mg of liver was fractionated into neutral lipid, free fatty acid, and phospholipid with aminopropyl BondElute columns (18). Neutral lipid was then separated into triacylglycerol, cholesterol, and cholesterol ester fractions with BondElute columns. Lipids were saponified in 3.3% ethanolic KOH at 70°C for 30 min. Neutral lipids and phospholipid were methylated with 14% boron trifluoride-methanol (31) and analyzed by GC with a Perkin-Elmer AutoSystem GC apparatus equipped with a flame ionization detector and helium as the carrier gas. The data were analyzed on a Perkin-Elmer Turbochrom Chromatography Workstation with diheptadecanoyl-l-lecithin as the internal standard. Fatty acid peaks were identified by comparing fatty acid retention times with those of authentic standards (Nu-Chek Prep) (13). Phospholipid fatty acid composition was determined after separating the phospholipid classes by thin-layer chromatography (CHCl3-methanol-28% ammonium hydroxide, 65:35:5, vol/vol) (39) and solid-phase extraction on BondElute columns (18). PE and PC were digested with cobra (Naja naja) PLA2 (8). The released fatty acids from the sn-2 and sn-1 positions were methylated (31) and analyzed by GC as described above (13). Triacylglycerol fractions were resuspended in isopropanol and analyzed colorimetrically as described above. Phospholipid content was measured colorimetrically (1). For cholesterol and cholesterol ester measurements, lipids were extracted from 100 mg of liver tissue (12). Sterols and sterol esters subjected to alkaline hydrolysis were separated from other lipids by reverse-phase high-performance liquid chromatography with a C18 column and eluted isocratically with acetonitrile-isopropanol (97.5:2.5, vol/vol). The absorbance of the eluate was monitored at 210 nm. The mass of free cholesterol was quantified by comparing areas under the cholesterol peaks to areas generated by known quantities of cholesterol. For most lipids, only detailed analyses of female mice were done because the results of initial phospholipid fatty acid composition analysis of males were similar.
Statistics.
Plasma and weight data were analyzed by two-way analysis of variance with sex and genotype as the variables with JMP software, version 5 (SAS Institute Inc.). Fatty acid data were analyzed by Student's t test. Data are shown as means ± the standard errors.
RESULTS
Generation of mtGPAT-deficient mice.
Alignment of amino acid sequences from bacterial and mammalian mtGPAT and LPA acyltransferases revealed four regions of conserved sequence that have been designated homology regions I to IV (25). Kinetic studies with site-directed mutagenesis and chemical modification of highly conserved amino acids within this region demonstrated that amino acids within regions I to IV comprise the active site of the protein and are required for binding of the glycerol-3-phosphate substrate and for enzyme catalysis (9, 15, 25). mtGPAT-deficient mice were generated by replacing a 0.5-kb sequence containing homology regions II and III with neo (Fig. 2A and B). mtGPAT-deficient mice were viable and fertile. They appeared healthy and had normal litter sizes, with equal numbers of male and female pups. mtGPAT mRNA expression was undetectable (Fig. 2C). The specific activity of mtGPAT in the total liver membrane fractions from control mtGPAT+/+ and deficient mtGPAT−/− mice were 0.74 ± 0.06 and 0.06 ± 0.01 nmol/min/mg of protein, respectively, demonstrating successful elimination of mtGPAT activity (Fig. 2D). Residual activity may be due to incomplete N-ethylmaleimide inactivation of microsomal GPAT (33), which is also present in these membrane fractions. Microsomal GPAT activity was similar in mtGPAT+/+ and mtGPAT−/− mice, showing that the microsomal isoform was not upregulated to compensate for the lack of mtGPAT.
mtGPAT-deficient mice have reduced liver triacylglycerol content and plasma lipids.
When mtGPAT is overexpressed in CHO cells, triacylglycerol mass increases 2.7-fold and the incorporation of [14C]oleate into triacylglycerol is threefold higher than in cells that do not overexpress mtGPAT (17). Because these data indicated that mtGPAT regulates the synthesis of triacylglycerol and because mtGPAT specific activity is high in the liver, we hypothesized that mtGPAT−/− mice would have reduced hepatic and plasma triacylglycerol contents. Hepatic triacylglycerol content in female mtGPAT−/− mice was 37% lower than that in mtGPAT+/+ controls (Table 1). This reduction in hepatic triacylglycerol content is consistent with mtGPAT comprising approximately 30 to 50% of the total GPAT activity in the liver and with microsomal GPAT contributing to triacylglycerol synthesis. Hepatic cholesterol and phospholipid contents did not differ between the genotypes.
TABLE 1.
Liver measurements in 2-month-old female mtGPAT+/+ and mtGPAT−/− micea
| Genotype | Mean concn (mg/g of liver) ± SE
|
|||
|---|---|---|---|---|
| Free cholesterol | Cholesterol ester | Triacylglycerol | Phospholipid | |
| mtGPAT+/+ | 2.3 ± 0.11 | 0.48 ± 0.22 | 9.12 ± 0.64 | 17.8 ± 0.97 |
| mtGPAT−/− | 2.3 ± 0.11 | 0.42 ± 0.27 | 5.79 ± 0.55b | 18.0 ± 0.61 |
Six samples were analyzed for each measurement.
P < 0.05.
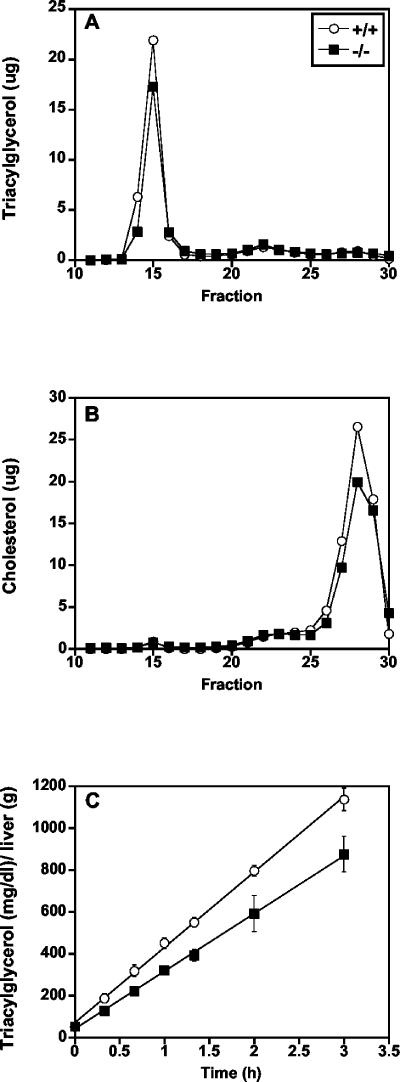
Plasma HDL and free fatty acid content did not differ between the genotypes, but total plasma cholesterol was significantly lower in mtGPAT−/− mice than in mtGPAT+/+ controls (Table 2). Female mtGPAT−/− mice had 15% lower triacylglycerol than did controls. Fast protein liquid chromatography analysis confirmed reduced VLDL triacylglycerol and showed reduced HDL cholesterol (Fig. 3A and B). These decreases in VLDL triacylglycerol may be related to the decrease in hepatic triacylglycerol synthesis. To determine whether the lower plasma triacylglycerol resulted from a decrease in VLDL secretion, the rate of VLDL accumulation was examined after blocking of lipoprotein lipase activity with Triton WR1339 (Fig. 3C). During the 3-h period examined, the secretion rate was 30% lower in mtGPAT−/− mice than in the mtGPAT+/+ controls.
TABLE 2.
Plasma measurements in 2-month-old mtGPAT+/+ and mtGPAT−/− micea
| Sex and genotype or parameter | Total cholesterol (mg/dl) | HDL cholesterol (mg/dl) | Free fatty acids (mM) | Triacylglycerol (mg/dl) | Glucose (mg/dl) | Insulin (ng/ml) | Wt (g) |
|---|---|---|---|---|---|---|---|
| Female | |||||||
| mtGPAT+/+ | 68.6 ± 2.5 (33) | 65.2 ± 4.2 (14) | 0.72 ± 0.08 (13) | 33.2 ± 1.8 (33) | 181.8 ± 6.7 (33) | 0.70 ± 0.07 (4) | 19.2 ± 0.3 (56) |
| mtGPAT−/− | 61.2 ± 3.2 (29) | 54.8 ± 4.5 (12) | 0.74 ± 0.08 (12) | 28.1 ± 1.9b (29) | 171.9 ± 9.5 (29) | 0.44 ± 0.09 (5) | 18.7 ± 0.3 (46) |
| Male | |||||||
| mtGPAT+/+ | 80.0 ± 3.6 (25) | 74.3 ± 4.5 (12) | 0.57 ± 0.06 (12) | 32.9 ± 1.6 (25) | 190.7 ± 6.6 (25) | 0.86 ± 0.1 (6) | 25.8 ± 0.5 (40) |
| mtGPAT−/− | 72.9 ± 4.0 (25) | 69.1 ± 4.6 (16) | 0.67 ± 0.07 (16) | 31.9 ± 2.3 (25) | 193.0 ± 5.2 (25) | 0.66 ± 0.16 (6) | 25.4 ± 0.6 (23) |
| P value | |||||||
| Genotype | <0.05 | NSc | NS | NS | NS | NS | <0.05 |
| Sex | <0.001 | <0.05 | NS | NS | <0.05 | NS | <0.001 |
Numbers of samples analyzed for each measurement are in parentheses. Values are presented as means ± standard errors.
P < 0.05 for female mtGPAT+/+ mice versus female mtGPAT−/− mice.
NS, no statistically significant difference.
FIG. 3.
mtGPAT-deficient mice have lower plasma lipid levels and decreased VLDL secretion. Pooled plasma (100 μl) from 2-month-old female mice was fractionated in two groups (n = 6 and 4) by gel filtration chromatography on a Superose 6B column, and 0.5-ml fractions were collected. Triacylglycerol (A) and total cholesterol (B) are reported as the average of the two groups in micrograms per fraction. (C) VLDL secretion rates. After a 4-h fast, 2-month-old female mice (mtGPAT+/+, n = 5; mtGPAT−/−, n = 4) were injected with Tyloxapol as described in Materials and Methods and plasma was collected at the times shown. Rates of VLDL secretion were calculated as the concentration of triglyceride (milligrams per deciliter) per unit of liver weight (grams) per hour.
mtGPAT-deficient mice have reduced body weight.
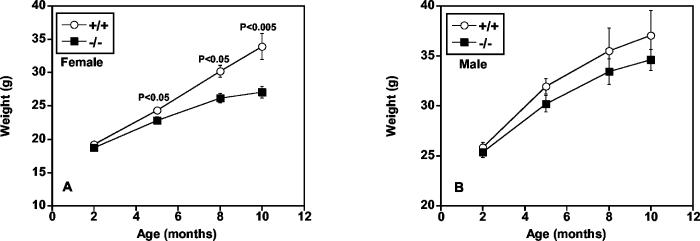
Because mtGPAT specific activity is high in adipose tissue (24), we predicted that the mtGPAT−/− mice would have less fat and weigh less than the controls. mtGPAT−/− female mice weighed 6% less than mtGPAT+/+ controls at 5 months and 20% less at 10 months (Fig. 4A). Weights of males did not differ significantly by genotype (Fig. 4B); however, pooled weight data showed a significant effect of genotype, with mtGPAT−/− mice weighing less than mtGPAT+/+ controls (Table 2). To determine whether the difference in weight was due to differences in adipose tissue mass, we isolated gonadal, inguinal, and retroperitoneal fat pads. Genotype had a significant effect on gonadal fat mass and on total fat per unit of body weight (Table 3). Because obesity is associated with the development of insulin resistance, we wondered whether the reduced adipose mass translated into a protective phenotype. Although there was no effect of genotype on glucose, a trend toward reduced insulin levels was observed in the mtGPAT−/− mice (Table 2).
FIG. 4.
mtGPAT−/− mice gain less weight. Body weights of mice fed a diet containing 14% kcal from fat. (A) Females at 2 months (n = 46 to 56), 5 months (n = 18 to 35), 8 months (n = 6 to 11), and 10 months (n = 6 to 10) of age. (B) Males at 2 months (n = 23 to 40), 5 months (n = 15 to 25), 8 months (n = 8 to 12), and 10 months (n = 8 to 9) of age.
TABLE 3.
Fat pad weightsa
| Sex and genotype or parameter | No. of mice tested | Fat pad wt (g)
|
Total fat wt (g) | Total fat as % of body wt | ||
|---|---|---|---|---|---|---|
| Gonadal | Inguinal | Retroperitoneal | ||||
| Female | ||||||
| mtGPAT+/+ | 5 | 1.15 ± 0.08 | 0.31 ± 0.07 | 0.15 ± 0.02 | 1.61 ± 0.13 | 5.50 ± 0.22 |
| mtGPAT−/− | 10 | 0.77 ± 0.10b | 0.26 ± 0.02 | 0.12 ± 0.01 | 1.14 ± 0.13b | 4.30 ± 0.46 |
| Male | ||||||
| mtGPAT+/+ | 8 | 1.41 ± 0.31 | 0.67 ± 0.16 | 0.35 ± 0.09 | 2.43 ± 0.55 | 5.70 ± 1.02 |
| mtGPAT−/− | 8 | 0.88 ± 0.20 | 0.40 ± 0.10 | 0.21 ± 0.04 | 1.50 ± 0.33 | 3.80 ± 0.62 |
| P value | ||||||
| Genotype | <0.05 | NS | NS | NS | <0.05 | |
| Sex | NSc | <0.05 | <0.05 | NS | NS | |
Fat pads from 12-month-old mtGPAT+/+ and mtGPAT−/− mice were removed and weighed. The values shown are means ± standard errors.
P < 0.05 for female mtGPAT+/+ versus female mtGPAT−/− mice.
NS, no statistically significant difference.
Liver triacylglycerol fatty acid composition is altered.
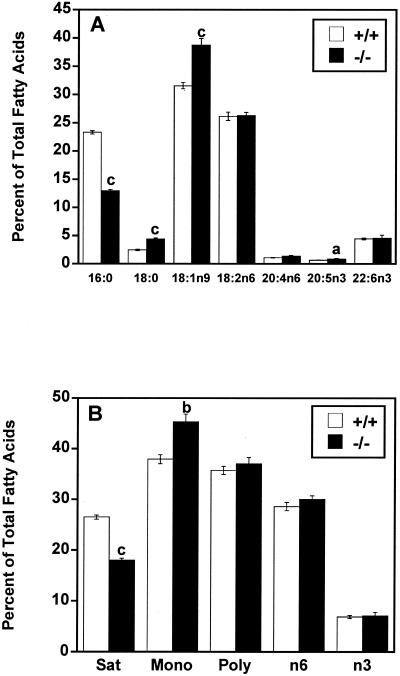
Consistent with the preference of mtGPAT for palmitoyl-CoA, liver triacylglycerol in female mtGPAT−/− mice contained 44% less 16:0 than did that in controls and there were compensatory increases of 78% in 18:0, 23% in 18:1n9, and 38% in 20:5n3 compared to the levels in controls (Fig. 5A). Differences in other major fatty acid species were not significant. Overall, triacylglycerol saturated fatty acid content was 32% lower and monounsaturated fatty acid content was 20% higher in female mtGPAT−/− mice (Fig. 5B).
FIG. 5.
mtGPAT−/− mice have altered liver triacylglycerol fatty acid composition. After methyl esterification, liver triacylglycerol fatty acids from mtGPAT+/+ and mtGPAT−/− mice (n = 6 per genotype) were quantified by GC. Only the major fatty acids are presented. (A) Selected fatty acid species. (B) Fatty acid classes (Sat, saturated; Mono, monounsaturated; Poly, polyunsaturated). a, P < 0.05; b, P < 0.005; c, P < 0.001.
Liver phospholipid fatty acid composition is altered.
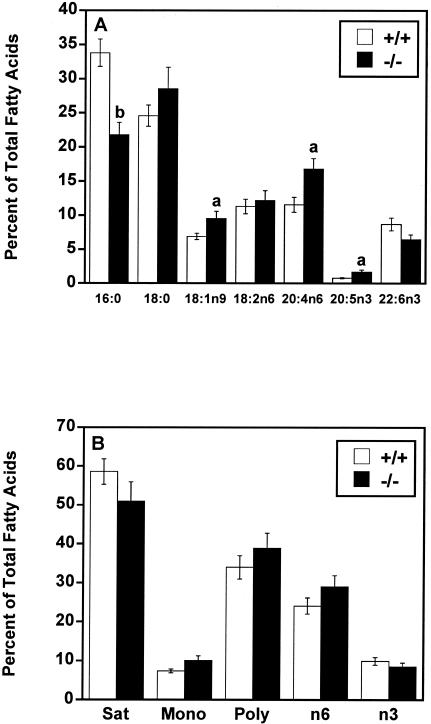
Similar to triacylglycerol, liver phospholipid in female mtGPAT−/− mice contained 35% less 16:0 than did that in controls (Fig. 6A). Compared to the levels in controls, oleic acid increased 38%, 24:4n6 increased 45%, and 20:5n3 increased 112% in mtGPAT−/− mouse liver phospholipid. Differences in other major fatty acid species were not significant. The total saturated, monounsaturated, and polyunsaturated fatty acid contents did not differ between the genotypes (Fig. 6B). Similar changes were observed in total liver phospholipid composition in male mtGPAT−/− mice, which had 28% less 16:0, 27% more 18:1n9, 15% more 18:2n6, 33% more 20:4n6, and 33% less 22:6n3. No significant differences were observed in other major fatty acids.
FIG. 6.
mtGPAT−/− mice have altered liver total phospholipid fatty acid composition. After methyl esterification, liver phospholipid fatty acids from mtGPAT+/+ and mtGPAT−/− mice (n = 6 per genotype) were quantified by GC. Only the major fatty acids are shown. (A) Selected fatty acid species. (B) Fatty acid classes (Sat, saturated; Mono, monounsaturated; Poly, polyunsaturated). a, P < 0.05; b, P < 0.005.
Liver PE fatty acid composition is altered.
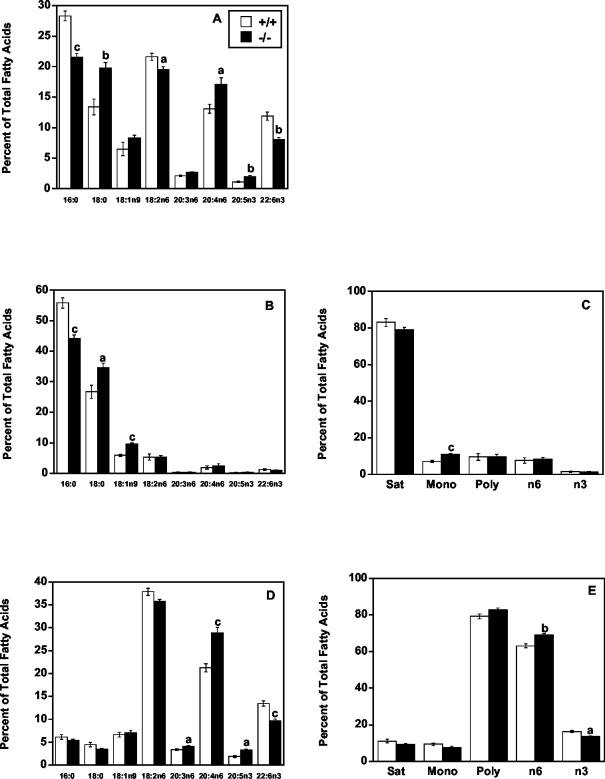
To determine the changes that occurred in the quantitatively most prominent phospholipids, PC and PE, these species were separated and their fatty acids were examined in female mice. Liver PE from mtGPAT−/− mice contained 24% less 16:0 and 47% more 18:0 than did that from mtGPAT+/+ controls (Fig. 7A). PE also contained 10% less 18:2n6 and 32% less 22:6n3 than did that of controls. Compared to those of controls, the levels of 20:4n6 and 18:0 were 31 and 47% higher, respectively. Differences in other major fatty acid species were not significant.
FIG. 7.
mtGPAT−/− mice have altered liver PE fatty acid composition. PE from mtGPAT+/+ and mtGPAT−/− mice (n = 6 per genotype) was separated from other liver phospholipids by solid-phase column chromatography. After methyl esterification, total PE fatty acids were quantified by GC. A portion of the PE fraction was digested with PLA2 and then subjected to acid hydrolysis. (A) Total fatty acids. (B) sn-1 fatty acids. (C) sn-1 fatty acid classes (Sat, saturated; Mono, monounsaturated; Poly, polyunsaturated). (D) sn-2 fatty acids. (E) sn-2 fatty acid classes. Only the major fatty acids are presented. a, P < 0.05; b, P < 0.005; c, P < 0.001.
Because mtGPAT prefers to esterify 16:0, we hypothesized that phospholipid from mtGPAT−/− mice would have less 16:0 in the sn-1 position. As predicted, PE from mtGPAT−/− mice contained 21% less 16:0 in the sn-1 position than did that from controls (Fig. 7B). This decrease was compensated for by 30% more 18:0 and 64% more 18:1n9 at the sn-1 position compared to the levels in controls. Differences in other major fatty acid species at the sn-1 position were not significant. PE in mtGPAT−/− mice contained 55% more monounsaturated fatty acid in the sn-1 position than did that in wild-type controls (Fig. 7C).
In mtGPAT−/− mice, the sn-2 position of PE contained 36% more 20:4n6 than that in mtGPAT+/+ controls, as well as 22% more 20:3n6 and 75% more 20:5n3 (Fig. 7D). The only other major change was a 28% decrease in 22:6n3. The differences in other major fatty acid species were not significant. PE from the mtGPAT−/− mice contained 10% more n6 and 16% less n3 total fatty acid (Fig. 7E).
Liver PC fatty acid composition is altered.
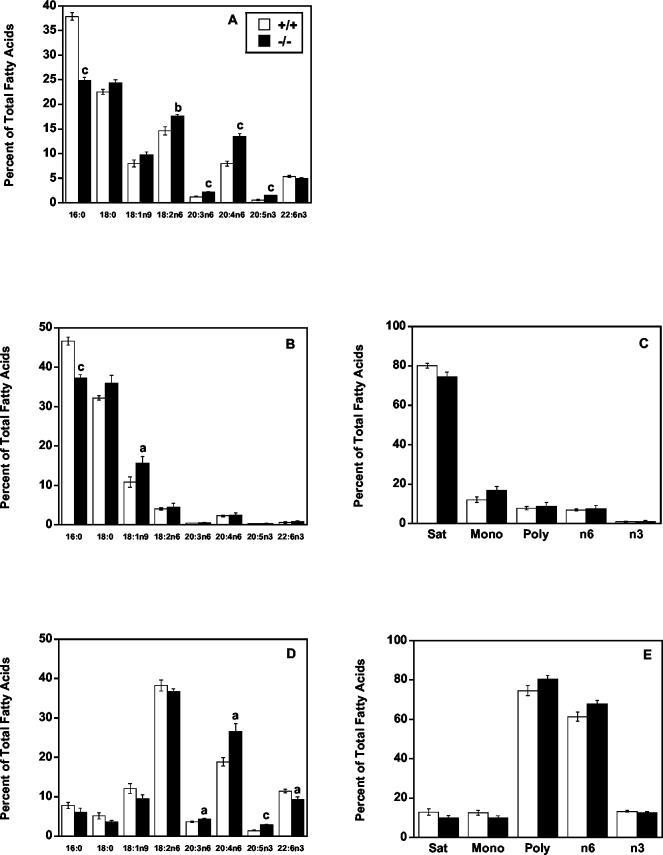
mtGPAT−/− mice had alterations in liver PC fatty acid content similar to those measured in PE. mtGPAT−/− liver PC contained 34% less 16:0 than did that of controls (Fig. 8A) and 20% more 18:2n6, 71% more 20:3n6, 69% more 20:4n6, and 153% more 20:5n3 than that of controls. Differences in other major fatty acid species were not significant. Unlike PE, the stearate content in PC did not change.
FIG. 8.
mtGPAT−/− mice have altered liver PC fatty acid composition. PC from mtGPAT+/+ and mtGPAT−/− mice (n = 6 per genotype) was separated from other liver phospholipids by solid-phase column chromatography. After methyl esterification, total PC fatty acids were quantified by GC. A portion of the PC fraction was digested with PLA2 and then subjected to acid hydrolysis. The hydrolyzed fractions were methyl esterified and quantified by GC. (A) Total fatty acids. (B) sn-1 fatty acids. (C) sn-1 fatty acid classes (Sat, saturated; Mono, monounsaturated; Poly, polyunsaturated). (D) sn-2 fatty acids. (E) sn-2 fatty acid classes. Only the major fatty acids are presented. a, P < 0.05; b, P < 0.005; c, P < 0.001.
Similar to the changes observed in PE, the sn-1 position of PC in mtGPAT−/− mice contained 20% less 16:0 and 44% more 18:0 than did that of mtGPAT+/+ controls (Fig. 8B). Stearate and other major fatty acid species did not differ between genotypes. The sn-2 position of PC in mtGPAT−/− mice contained 40% more 20:4n6 and 18% less 22:6n3 than did that of controls (Fig. 8D). Differences in other major fatty acid species were not significant, but the PC sn-2 position also contained 20% more 20:3n6 and 103% more 20:5n3 than did that of mtGPAT+/+ controls. There were no significant differences in total saturated, monounsaturated, and polyunsaturated fatty acids at either the sn-1 or the sn-2 position (Fig. 8C and E).
Cholesterol esters and fatty acids.
The fatty acid composition of cholesterol esters and free fatty acids also varied between the genotypes. Analysis of liver cholesterol esters revealed a 17% increase in 18:0 and a 16% decrease in 18:2n6 in mtGPAT−/− mice compared to the levels in controls. Liver nonesterified fatty acids showed a 22% decrease in 16:0 and a 46% increase in 20:4n6 in mtGPAT−/− mice compared to the levels in controls (data not shown).
DISCUSSION
We hypothesized that in mtGPAT−/− mice, liver triacylglycerol content would be reduced because mtGPAT comprises almost 50% of the total GPAT activity in the liver. Lack of GPAT activity would prevent the directing of fatty acyl-CoAs toward triacylglycerol synthesis and eliminate competition with CPT-1 for acyl-CoAs. In addition, polyunsaturated fatty acids like arachidonate are ligands for PPARα and might up-regulate fatty acid β-oxidation and result in decreased fatty acid availability for triacylglycerol synthesis. Less liver triacylglycerol synthesis might decrease VLDL biogenesis and secretion. As predicted, hepatic triacylglycerol content was reduced 37% in the liver and 15% in the plasma, with a decrease in VLDL triacylglycerol and a 30% reduction in the VLDL secretion rate.
Although mtGPAT comprises only 10% of the total GPAT activity in adipose tissue, its specific activity is similar to that of GPAT in the liver (24); thus, we thought it likely that mtGPAT−/− mice would have reduced adipose tissue mass and weigh less. If mtGPAT competes with CPT-1 in adipocytes for the pool of acyl-CoAs available at the outer mitochondrial membrane, the diminished weight gain and decreased fat pad weight in mtGPAT−/− mice may also be due to increased β-oxidation. In the absence of mtGPAT, acyl-CoAs might be channeled preferentially into β-oxidation and away from glycerolipid synthesis. Pooled sex data showed a significant effect of genotype on body weight and fat mass. The reduced weight and fat phenotype in mtGPAT−/− mice corresponded to lower insulin levels, suggesting increased insulin sensitivity.
The fatty acid composition of phospholipids is tightly regulated and believed to stabilize membrane fluidity and affect membrane permeability and endocytosis, as well as the functions of intrinsic membrane proteins, including receptors and transporters (11, 36, 37). In addition, phospholipids serve as a reservoir of lipid signals like LPA, PA, diacylglycerol, and arachidonate. Most naturally occurring phospholipids and triacylglycerol have an asymmetric distribution of fatty acids, with saturated fatty acids predominating at the sn-1 position and unsaturated fatty acids predominating at the sn-2 position (40). In addition to a putative role in triacylglycerol synthesis, the preference of mtGPAT for 16:0-CoA over other long-chain acyl-CoAs suggests that the mitochondrial isoform helps define the positional specificity of saturated fatty acids in phospholipids (29).
The preferred substrate for mtGPAT is 16:0-CoA, which it esterifies to the sn-1 position of glycerol-3-phosphate at rates reported to be 3- to 10-fold higher than those observed with other long-chain fatty acyl-CoAs, such as 18:0-CoA, 18:1-CoA, 18:2n6-CoA, and 18:3n3-CoA (4, 19, 28, 43). We hypothesized that mtGPAT−/− mice would have decreased 16:0 in triacylglycerol and at the sn-1 position of phospholipids and that this decrease would be compensated for by an increase in other saturated fatty acids. As predicted, mtGPAT−/− mice had a reduced 16:0 content in liver triacylglycerol and phospholipid. Palmitate was about 20% lower at the sn-1 position of both PE and PC (Fig. 7 and 8), and this decrease at the sn-1 position was compensated for by increases in 18:1 in PC and both 18:0 and 18:1 in PE.
Surprisingly, although mtGPAT specifically acylates the sn-1 position, the fatty acid composition at the sn-2 position was also altered. The dramatic changes in the fatty acid composition of PC and PE strongly suggest that the loss of esterification specificity for 16:0 at the sn-1 position affects the esterification of 20:4n6 at the sn-2 position. Because 20:4n6 is esterified at the sn-2 position primarily during remodeling by lysophospholipid acyltransferases, it is likely that these acyltransferases are specific for certain lysophospholipids and that the available phospholipid or lysophospholipid species affect the deacylation and reacylation reactions that remodel phospholipids. The pairing of 18:0 with 20:4n6 is common in phospholipids (23), and it seems likely that in mtGPAT−/− mice, sn-1-18:0-PC or -PE is specifically selected for acylation with 20:4n6-CoA (34). In the sn-2 position, increases in n6 fatty acids occurred in preference to increases in n3 fatty acids. These findings are the opposite of those obtained with cultured chick hepatocytes (38). In the hepatocytes, mtGPAT declined over an 8-day period in culture, concomitant with a 17% decrease in palmitate and a 69% decrease in arachidonate in PC. Similar changes were observed in PE fatty acids after 4 days in culture. Because the production rate of eicosanoids depends on PLA2 activity (35), if the abundance of 20:4n6 increases relative to that of other fatty acids at the sn-2 position, PLA2-mediated hydrolysis should release more 20:4n6 and elicit a corresponding increase in eicosanoid production.
In summary, absence of mtGPAT results in decreased fat pad mass, lower body weight, lower liver and plasma triacylglycerol, and a lower rate of VLDL secretion. In view of the marked regulation of mtGPAT by nutritional factors (7, 10), mtGPAT−/− mice are likely to be resistant to diet-induced obesity and the resulting impairment in insulin sensitivity. mtGPAT appears to initiate the positional distribution of fatty acids in phospholipids, not merely in terms of saturated versus unsaturated fatty acids in the sn-1 and sn-2 positions but, importantly, in the predominance, specifically, of arachidonate in the sn-2 position. It has been observed in numerous studies examining the consequence of replacing dietary n6 fatty acids with n3 fatty acids that when changes occur in the relative amount of n6 eicosanoids produced, platelet aggregation and other responses are altered (22). Thus, the relative increase in 20:4n6 in the phospholipids of mtGPAT−/− mice may be functionally significant.
Acknowledgments
This work was supported by NIH grants DK56598 (R.A.C.), HL42630 (N.M.), GM20920 (L.E.H.), and DK56350 (UNC Clinical Nutrition Research Unit).
We thank Annette Sutton for help with tissue culture, Michael K. Altenburg and Sudi I. Malloy for helpful discussions, Randy J. Thresher for help with the library screening, and Tal M. Lewin, Douglas P. Lee, and Cynthia G. Van Horn for thoughtful comments on the manuscript.
REFERENCES
- 1.Bartlett, G. R. 1959. Phosphorus assay in column chromatography. J. Biol. Chem. 234:466-468. [PubMed] [Google Scholar]
- 2.Bell, R. M., and R. A. Coleman. 1980. Enzymes of glycerolipid synthesis in eukaryotes. Annu. Rev. Biochem. 49:459-487. [DOI] [PubMed] [Google Scholar]
- 3.Bhat, B. G., P. Wang, J.-H. Kim, T. M. Black, T. M. Lewin, T. F. Fiedorek, and R. A. Coleman. 1999. Rat hepatic sn-glycerol-3-phosphate acyltransferase: molecular cloning and characterization of the cDNA and expressed protein. Biochim. Biophys. Acta 1439:415-423. [DOI] [PubMed] [Google Scholar]
- 4.Bremer, J., K. S. Bjerve, B. Borrebaek, and R. Christiansen. 1976. The glycerolphosphate acyltransferases and their function in the metabolism of fatty acids. Mol. Cell. Biochem. 12:113-125. [DOI] [PubMed] [Google Scholar]
- 5.Chang, Y.-Y., and E. P. Kennedy. 1967. Biosynthesis of phosphatidyl glycerophosphate in Escherichia coli. J. Lipid Res. 8:447-455. [PubMed] [Google Scholar]
- 6.Coleman, R. A., and E. B. Haynes. 1983. Selective changes in microsomal enzymes of triacylglycerol and phosphatidylcholine synthesis in fetal and postnatal rat liver: induction of microsomal sn-glycerol 3-P and dihydroxyacetone-P acyltransferase activities. J. Biol. Chem. 258:450-465. [PubMed] [Google Scholar]
- 7.Coleman, R. A., T. M. Lewin, and D. M. Muoio. 2000. Physiological and nutritional regulation of enzymes of triacylglycerol synthesis. Annu. Rev. Nutr. 20:77-103. [DOI] [PubMed] [Google Scholar]
- 8.Dennis, E. A. 1973. Kinetic dependence of phospholipase A2 activity on the detergent Triton X-100. J. Lipid Res. 14:152-159. [PubMed] [Google Scholar]
- 9.Dircks, L. K., J. Ke, and H. S. Sul. 1999. A conserved seven amino acid stretch important for murine mitochondrial glycerol-3-phosphate acyltransferase activity: significance of arginine 318 in catalysis. J. Biol. Chem. 274:34728-34734. [DOI] [PubMed] [Google Scholar]
- 10.Dircks, L. K., and H. S. Sul. 1997. Mammalian mitochondrial glycerol-3-phosphate acyltransferase. Biochim. Biophys. Acta 1348:17-26. [DOI] [PubMed] [Google Scholar]
- 11.Dowhan, W. 1997. Molecular basis for membrane phospholipid diversity: why are there so many lipids? Annu. Rev. Biochem. 66:199-232. [DOI] [PubMed] [Google Scholar]
- 12.Folch, J., M. Lees, and G. H. S. Stanley. 1957. A simple method for the isolation and purification of total lipids from animal tissues. J. Biol. Chem. 226:497-509. [PubMed] [Google Scholar]
- 13.Godley, P. A., P. Gallagher, B. T. Williams, A. Domnas, and J. L. Mohler. 1993. Adipose tissue fatty acid composition and risk of prostate cancer. Cancer Epidemiol. Biomark. Prev. 2:178. [Google Scholar]
- 14.Haldar, D., W.-W. Tso, and M. E. Pullman. 1979. The acylation of sn-glycerol 3-phosphate in mammalian organs and Ehrlich ascites tumor cells. J. Biol. Chem. 254:4502-4509. [PubMed] [Google Scholar]
- 15.Heath, R. J., and C. O. Rock. 1998. A conserved histidine is essential for glycerolipid acyltransferase catalysis. J. Bacteriol. 180:1425-1430. [DOI] [PMC free article] [PubMed] [Google Scholar]
- 16.Hjelmstad, R. H., and R. M. Bell. 1991. Molecular insights into enzymes of membrane bilayer assembly. Biochemistry 30:1731-1739. [DOI] [PubMed] [Google Scholar]
- 17.Igal, R. A., S. Wang, M. Gonzalez-Baró, and R. A. Coleman. 2001. Mitochondrial glycerol phosphate acyltransferase directs cellular triacylglycerol synthesis. J. Biol. Chem. 276:42205-42212. [DOI] [PubMed] [Google Scholar]
- 18.Kaluzny, M. A., L. A. Duncan, M. V. Merritt, and D. E. Epps. 1985. Rapid separation of lipid classes in high yield and purity using bonded phase columns. J. Lipid Res. 26:135-140. [PubMed] [Google Scholar]
- 19.Kelker, H. C., and M. E. Pullman. 1979. Phospholipid requirement of acyl coenzyme A: sn-glycerol-3-phosphate acyltransferase from rat liver mitochondria. J. Biol. Chem. 254:5364-5371. [PubMed] [Google Scholar]
- 20.Kemp, B. E., K. I. Mitchelhill, D. Stapleton, B. J. Michell, Z.-P. Chen, and L. A. Witters. 1999. Dealing with energy demand: the AMP-activated protein kinase. Trends Biochem. Sci. 24:22-25. [DOI] [PubMed] [Google Scholar]
- 21.Koller, B. H., L. J. Hagemann, T. Doetschman, J. R. Hagaman, S. Huang, P. J. Williams, N. L. First, N. Maeda, and O. Smithies. 1989. Germ-line transmission of a planned alteration made in a hypoxanthine phosphoribosyltransferase gene by homologous recombination in embryonic stem cells. Proc. Natl. Acad. Sci. USA 86:8927-8931. [DOI] [PMC free article] [PubMed] [Google Scholar]
- 22.Kristensen, S. D., E. B. Schmidt, and J. Dyerberg. 1989. Dietary supplementation with n-3 polyunsaturated fatty acids and human platelet function: a review with particular emphasis on implications for cardiovascular disease. J. Int. Med. 225(Suppl.):141-150. [DOI] [PubMed] [Google Scholar]
- 23.Lands, W. E. M., and C. G. Crawford. 1976. Enzymes of membrane phospholipid metabolism in animals, p. 3-85. In A. Mantonosi (ed.), Enzymes of biological membranes, vol. 2. Plenum, New York, N.Y.
- 24.Lewin, T. M., D. A. Granger, J.-H. Kim, and R. A. Coleman. 2001. Regulation of mitochondrial sn-glycerol-3-phophate acyltransferase activity: response to feeding status is unique in various rat tissues and is discordant with protein expression. Arch. Biochem. Biophys. 396:119-127. [DOI] [PubMed] [Google Scholar]
- 25.Lewin, T. M., P. Wang, and R. A. Coleman. 1999. Analysis of amino acid motifs diagnostic for the sn-glycerol-3-phosphate acyltransferase reaction. Biochemistry 38:5764-5771. [DOI] [PubMed] [Google Scholar]
- 26.Li, X., F. Catalina, S. M. Grundy, and S. Patel. 1996. Method to measure apolipoprotein B-48 and B-100 secretion rates in an individual mouse: evidence for a very rapid turnover of VLDL and preferential removal of B-48- relative to B-100-containing lipoproteins. J. Lipid Res. 37:210-220. [PubMed] [Google Scholar]
- 27.Mansour, S. L., K. R. Thomas, and M. R. Capecchi. 1988. Disruption of the proto-oncogene int-2 in mouse embryo-derived stem cells: a general strategy for targeting mutations to non-selectable genes. Nature 336:348-352. [DOI] [PubMed] [Google Scholar]
- 28.Monroy, G., H. C. Kelker, and M. E. Pullman. 1973. Partial purification and properties of an acyl coenzyme A:sn-glycerol 3-phosphate acyltransferase from rat liver mitochondria. J. Biol. Chem. 248:2845-2852. [PubMed] [Google Scholar]
- 29.Monroy, G., F. H. Rola, and M. E. Pullman. 1972. A substrate- and position-specific acylation of sn-glycerol 3-phosphate by rat liver mitochondria. J. Biol. Chem. 247:6884-6894. [PubMed] [Google Scholar]
- 30.Montfoort, A., L. M. van Golde, and L. L. van Deenen. 1971. Molecular species of lecithins from various animal tissues. Biochim. Biophys. Acta 231:335-342. [DOI] [PubMed] [Google Scholar]
- 31.Morrison, W., and L. Smith. 1964. Preparation of fatty acid methyl esters and dimethylacetals from lipids with boron fluoride-methanol. J. Lipid Res. 5:600-608. [PubMed] [Google Scholar]
- 32.Muoio, D. M., K. Seefield, L. Witters, and R. A. Coleman. 1999. AMP-activated kinase (AMPK) reciprocally regulates triacylglycerol synthesis and fatty acid oxidation in liver and muscle: evidence that sn-glycerol-3-phosphate acyltransferase is novel target. Biochem. J. 338:783-791. [PMC free article] [PubMed] [Google Scholar]
- 33.Schlossman, D. M., and R. M. Bell. 1976. Triacylglycerol synthesis in isolated fat cells: evidence that the sn-glycerol 3-phosphate and dihydroxyacetone phosphate acyltransferase activities are dual catalytic functions of a single microsomal enzyme. J. Biol. Chem. 251:5738-5744. [PubMed] [Google Scholar]
- 34.Schmid, P. C., E. Deli, and H. H. Schmid. 1995. Generation and remodeling of phospholipid molecular species in rat hepatocytes. Arch. Biochem. Biophys. 319:168-176. [DOI] [PubMed] [Google Scholar]
- 35.Smith, W. L., and R. Langenbach. 2001. Why there are two cyclooxygenase isozymes. J. Clin. Investig. 107:1491-1495. [DOI] [PMC free article] [PubMed] [Google Scholar]
- 36.Spector, A. A., and M. A. Yorek. 1985. Membrane lipid composition and cellular function. J. Lipid Res. 26:1015-1035. [PubMed] [Google Scholar]
- 37.Sprong, H., P. van der Sluijs, and G. van Meer. 2001. How proteins move lipids and lipids move proteins. Nat. Rev. Mol. Cell. Biol. 2:504-513. [DOI] [PubMed] [Google Scholar]
- 38.Stern, W., and M. E. Pullman. 1978. Acyl-CoA: sn-glycerol-3-phosphate acyltransferase and the positional distribution of fatty acids in phospholipids of cultured cells. J. Biol. Chem. 253:8047-8055. [PubMed] [Google Scholar]
- 39.Suzuki, E., A. Sano, T. Kuriki, and T. Miki. 1997. Improved separation and determination of phospholipids in animal tissues employing solid phase extraction. Biol. Pharm. Bull. 20:299-303. [DOI] [PubMed] [Google Scholar]
- 40.van Deenen, L. L. M. 1965. Phospholipids and biomembranes, p. 1-115. In R. T. Holman (ed.), Progress in the chemistry of fats and other lipids, vol. VIII, part 1. Pergamon Press, New York, N.Y.
- 41.Warnick, G. R., J. Benerson, and J. J. Albers. 1982. Dextran sulfate Mg2+ precipitation procedure for quantification of high-density-lipoprotein cholesterol. Clin. Chem. 28:1379-1388. [PubMed] [Google Scholar]
- 42.Yet, S.-F., S. Lee, Y. T. Hahm, and H. S. Sul. 1993. Expression and identification of p90 as the murine mitochondrial glycerol-3-phosphate acyltransferase. Biochemistry 32:9486-9491. [DOI] [PubMed] [Google Scholar]
- 43.Yet, S.-F., Y. K. Moon, and H. S. Sul. 1995. Purification and reconstitution of murine mitochondrial glycerol-3-phosphate acyltransferase. Functional expression in baculovirus-infected insect cells. Biochemistry 34:7303-7310. [DOI] [PubMed] [Google Scholar]


