Abstract
Cis-acting elements in post-transcriptional regulation of gene expression are often correlated with distinct local RNA secondary structure. These structures are expected to be significantly more ordered than those anticipated at random because of evolutionary constraints and intrinsic structural properties. In this study, we introduce a computing method to calculate two quantitative measures, NRd and Stscr, for estimating the uniqueness of an RNA secondary structure. NRd is a normalized score based on evaluating how different a natural RNA structure is from those predicted for its randomly shuffled variants. The lower the score NRd the more well ordered is the natural RNA structure. The statistical significance of NRd compared with that computed from structural comparisons among large numbers of randomly permuted sequences is represented by a standardized score, Stscr. We tested the method on the trans-activation response element and Rev response element of HIV-1 mRNA, internal ribosome entry sequence of hepatitis C virus, Tetrahymena thermophila rRNA intron, 100 tRNAs and 14 RNase P RNAs. Our data indicate that functional RNA structures have high Stscr, while other structures have low Stscr. We conclude that RNA functional molecules and/or cis-acting elements with structure dependent functions possess well ordered conformations and they are uniquely folded as measured by this technique.
INTRODUCTION
Numerous experimental results have shown that RNA molecules perform a wide range of functions in biological systems. The known biological functions of RNAs continue to grow and its important role in the regulation control of gene expression is evident in many different biological fields (1,2). Though single-stranded regions exist in most RNAs, distinct well ordered structure in local segments of single-stranded RNA sequences often correlates with functions such as control of replication, transcription, mRNA processing, translation and metabolism (1–4) making it desirable to understand the conformation of associated local RNA structures.
Some combinations of base pairings in stem–loops and some distinct loop sequences are more abundant in functional structural RNAs (FSRs) (5–8). Therefore, the prediction of distinct folding patterns in RNA sequences is an important goal of genomic sequence analysis. It has been suggested that the FSRs possess well ordered conformations that are both thermodynamically stable and uniquely folded (9,10). This is because the functional elements must be optimized both in the conformational properties and sequence patterns where the interactions between RNA and RNA, as well as RNA and protein, play a crucial role in their functions (11). In the study of energy landscapes of RNA folding, we have demonstrated that the FSR elements are often thermodynamically more stable than anticipated in their corresponding random structures (12,13). This implies that evolution has constrained the structural properties of FSR elements to be thermodynamically stable. However, no available methods have been developed for estimating the structural uniqueness of the well ordered RNA structures based on the structural comparison in detail.
There are a few RNA motifs whose three-dimensional structures are known. It is also true that even random RNA sequences can be folded so that their complementary sequences form double helical stems. Functional RNA molecules found in modern organisms are evolutionary products (11). Evolution would increase the thermodynamic stability of the folded structure and reduce the possibility of alternative folding forms. Although we do not fully understand how to measure the structural uniqueness of distinct RNA structures accurately, it is reasonable to suppose FSRs have evolved morphologies or distinct conformations that are not expected to be found by chance. We expect that the more different a natural evolved RNA structure is from a large number of random and unevolved structures, the more unique is the natural RNA structure.
In this study we present a novel method to determine the uniqueness of well ordered RNA secondary structures. We test 100 tRNA molecules, 14 ribonuclease P (RNase P) RNA molecules, Tetrahymena thermophila rRNA intron, internal ribosome entry sequence (IRES) of hepatitis C virus, trans-activation response (TAR) element and Rev response element (RRE) of HIV-1. We find that most RNA structures derived by phylogenetic methods and some structures from minimal energy dynamic programming algorithm have well ordered conformations.
MATERIALS AND METHODS
Quantitative measures for the uniqueness of RNA structures
It has been suggested that RNA folding is hierarchical and sequential (14). The primary sequence of a natural RNA determines its secondary structure and the secondary structure determines its tertiary structure. Since RNA secondary structure is supposed to change slightly by the additional tertiary interactions (14), it is a crucial step to characterize the RNA secondary structure for our understanding of the uniqueness of the RNA three-dimensional structure. In this study we focus our attention on the uniqueness of secondary structures folded by RNA molecules.
To define the uniqueness of RNA secondary structures quantitatively we hypothesize that the well ordered conformation of functional RNA molecules is expected to be rare in the conformation space formed from a population of random sequences with the same base compositions and same length as the sequence of natural RNAs. For a given natural RNA sequence, we generate 300 randomly shuffled sequences. In the random shuffling, nucleotides at all sites of the natural sequence are sequentially swapped with a randomly chosen site elsewhere in the sequence (15). If the secondary structure of the natural RNA was established experimentally or by phylogenetic comparisons, the established structure is used. Otherwise, the lowest free energy structure predicted by Zuker’s mfold with Turner energy rules (16,17) is used. The secondary structures of the random sequences (termed random structures) are also assumed to be folded with the lowest free energy computed by mfold. In consideration of the fact that the predicted optimized structure by mfold does not include any tertiary interactions, the tertiary interactions conserved in the inferred structure by phylogenetic comparisons are not taken into account in the structure comparison.
In order to facilitate the structural comparison, we define a maximal matching score (MMS) to represent the maximal structural similarity between two RNA structures. The MMS is computed by the program rna_match (see below). Therefore we have 300 MMS observations computed between the structure of the natural RNA and the 300 random structures. The sample mean of the 300 MMS observations is termed as NR. A quantitative measure of the uniqueness of RNA secondary structures is then defined as the average NR per nucleotide, which is a normalized score and denoted by NRd. It represents the density of MMS between the structure of a natural RNA and a large number of the random structures. NRd is taken as a measure of the uniqueness of the structural morphology folded by an RNA molecule. The lower the NRd, the more unique is the well ordered structure of an RNA molecule.
What is the average of MMS values between any two random structures? Is the score NRd (or NR) computed from a natural RNA molecule statistically significant? To address these questions, we perform a statistical test for a set of randomly shuffled sequences by the same procedure as we used in the computation of NR. We generally collect a set of 25 random sequences that are also generated by random permutations as mentioned above. For each of the 25 random sequences we compute the MMS repeatedly by comparing the folded structure with the each of the 300 random structures as used previously. As a result, we have 25 × 300 observations of MMS for these random structures. The sample mean and sample standard deviation of the 7500 random versus random MMS observations are termed as RR and std, respectively. Consequently, we can define Stscr as a significance score of the uniqueness of RNA secondary structures. The Stscr is defined as
Stscr = (RR – NR)/std.
The greater Stscr, the statistically more significant is the well ordered structure of the natural RNA. If score Stscr is treated as a normal variable with zero mean and unit standard deviation, the significance level achieved can be determined by the normal distribution. Thus, the probability of observing a departure from the mean of >1.96 standard deviations (Stscr ≥ 1.96) is 0.05.
Computing similarity between two RNA structures
In our approach (18,19) of RNA molecule comparison, we define three edit operations, substitute, delete and insert. For a given RNA molecule, each operation can be applied to either a base pair or an unpaired base. When applied to unpaired bases, these operations are exactly the same as in sequence matching. To substitute paired bases is to replace one base pair with another. This means that at the sequence level, two bases are changed at the same time. To delete a base pair is to delete the two bases of the base pair. At the sequence level, this means to delete two bases at the same time. To insert a base pair is to insert a new base pair. At the sequence level, this means to insert two bases at the same time. Note that there is no substitute operation that can change a base pair to an unpaired base or vice versa.
We assume that there is a score function associated with the operations. The score function for base pairs is defined on Σ × Σ ∪ {λ}, and the score function for unpaired bases is defined on Σ ∪ {λ} (20). With these definitions, we can consider how to translate one RNA into another using the optimal number of weighted operations. With appropriate score functions, this can give us either a similarity or a distance measure between two RNA structures. We take into account both the sequence and the structural information of RNA molecules. Our measure treats a base pair as a unit and does not allow it to match to two unpaired bases. This is closer to the spirit of the comparative analysis method currently used in the analysis of RNA secondary structures. When one base of a base pair changes, we usually find that its complementary base also changes so as to conserve that base pair in RNA structures.
The algorithm (18–20) of structure comparison (rna_match) is briefly described here. For any RNA R, we use r[i] to represent the ith base in R and we use R[i···j] to represent the substructure formed by bases from r[i] to r[j]. Let R1[1···m] and R2[1···n] be the two given RNA structures. We use M(i1, i2; j1, j2) to represent MMS between R[i1···i2] and R2[j1···j2]. Suppose that we want to compute the MMS between R1[1···i] and R2[1···j]. If both r1[i] and r2[j] are unpaired bases, then it is clear that
Where del(r1[i]), ins(r2[j]) and sub(r1[i], r2[j]) are cost scores associated with the operations of deletion, insertion and substitution, respectively.
If i′ < i and (r1[i′], r1[i]) is a base pair and j′ < j and (r2[j′], r2[j]) is a base pair, then we can show the following if in M(1, i – 1; 1, j) r1[i′] is deleted and in M(1, i; 1, j – 1) r2[j′] is inserted.
M(1, i; 1, j) =
The above are the two main cases and the other cases can be handled similarly. Because of the second formula, we know that in order to compute MMS between R1 and R2, M(1, m; 1, n), we need to have MMS between some substructures, namely M(i′ + 1, i – 1; j′ + 1, j – 1) where (r1[i′], r1[i]) and (r2[j′], r2[j]) are both base pairs, available. This suggests a bottom-up dynamic programming algorithm to find MMS between R1 and R2. We consider the smaller substructures first and eventually consider the whole structures R1 and R2. The worst case time complexity of the algorithm is O(m × n × stem(R1) × stem(R2)), where stem(R1) and stem(R2) are the number of stems in R1 and R2, respectively. In practice the time complexity is roughly O(m × n × log(m) × log(n)). The space complexity of the algorithm is O(m × n).
RESULTS
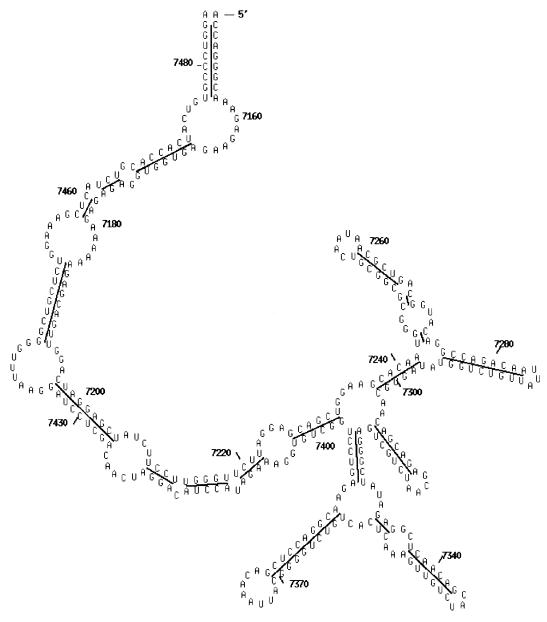
In our computational experiments, we tested the sequences of 100 tRNAs that had been used by Eddy and Durbin (21). The secondary structures of cloverleaf models of the 100 tRNAs were extracted from the tRNA database (22). The common secondary structure models derived by phylogenetically comparative analysis are all well established for RNase P RNAs (23) and group I introns (24). The conserved secondary structures of TAR (25) of HIV-1 and IRES of HCV (26) are from previous publications. The phylogenetically conserved secondary structure of RRE of HIV-1 (isolate U455) is derived from 151 HIV-1 sequences (Fig. 1).
Figure 1.
Conserved secondary structure of RRE sequence of HIV-1. The RRE sequence is located at the region of 7149–7485 of the mRNA of HIV-1 (isolate U455).
tRNA molecules possess well ordered conformations
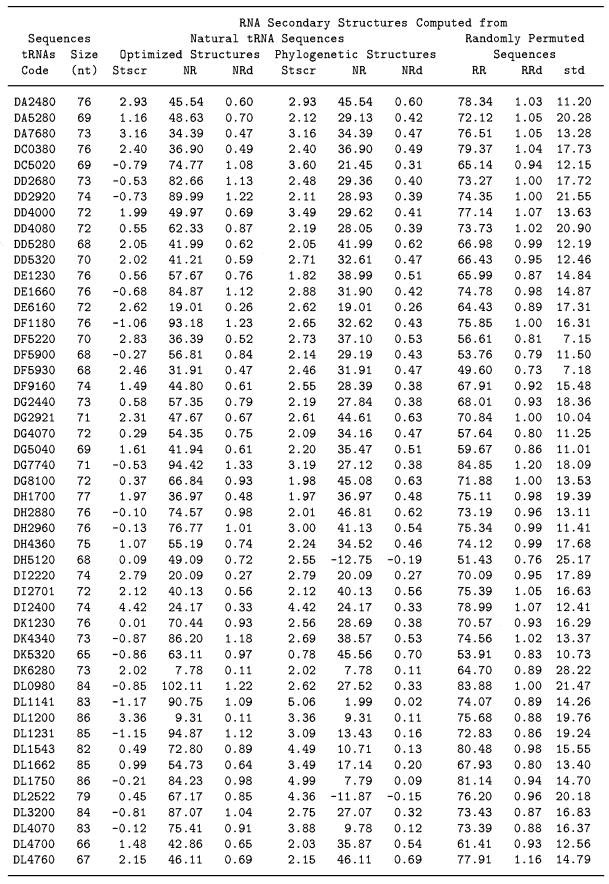
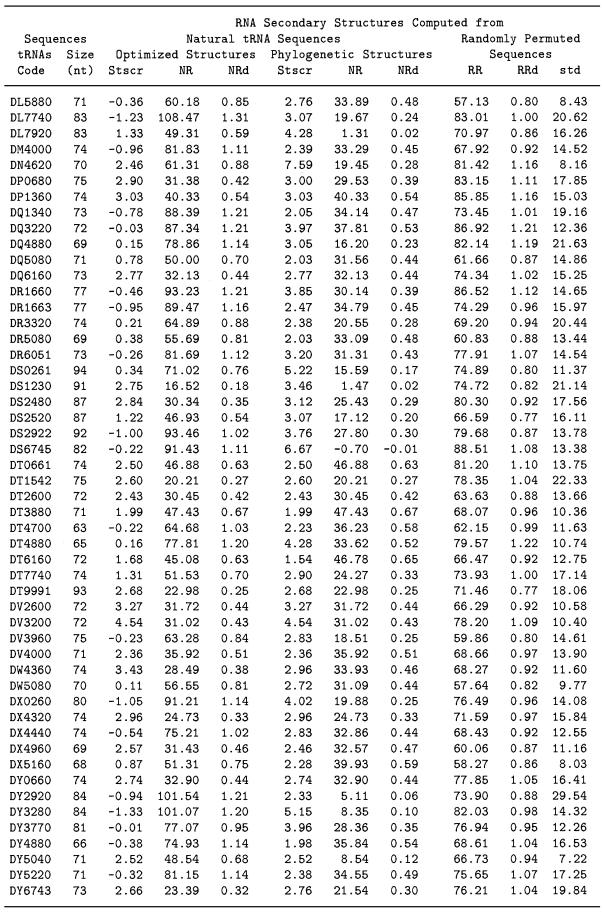
The results detailed in Table 1 (columns 6–8) demonstrate that the MMS between the classical cloverleaf structure of natural tRNA derived from phylogenetic and experimental means and corresponding random structures is significantly less than MMS for random versus random sequences in general. Only 10 out of 100 tRNAs have the density of MMS, NRd ≥ 0.60. The calculated NRd ranges from –0.19 to 0.70 in the 100 tested tRNA molecules with an average of 0.38 ± 0.18. The calculated RRd among permuted random sequences of the tRNAs are ranged from 0.73 to 1.22 and averaged to 0.96 ± 0.11. The average RRd from random sequences is ∼5.3 standard deviations higher than the average NRd indicating that the structural conformations of the natural tRNAs are significantly different from those of corresponding random structures. The significance scores of the uniqueness of the common tRNA secondary structure computed from 100 wild-type tRNAs are high and the Stscr values average to 2.94 ± 1.02. Only 3 out of 100 wild-type tRNAs have Stscr values <1.96. It indicates that the uniqueness of the common tRNA secondary structure of cloverleaf representations is statistically significant.
Table 1. Significance scores (Stscr) of the uniqueness of RNA secondary structures from 100 tRNA molecules.
Table 1 (columns 3–5) also shows the results of repeating the procedure described above using the optimized structures, rather than the common cloverleaf structures. Our data show that 26 tRNA sequences are correctly predicted to be the classical cloverleaf structure by mfold with the Turner energy rules (16,17) and that they all have high Stscr values. However, the significance scores Stscr of the optimized structures computed from most of the other 74 wild-type tRNAs are much lower and their average value is 0.36 ± 1.22. The average value of Stscr of the corresponding 74 cloverleaf structures is 3.02 ± 1.12. It is evident that for tRNAs the structural morphologies of phylogenetically inferred structures are more ordered than those observed in the predicted minimal free energy structures.
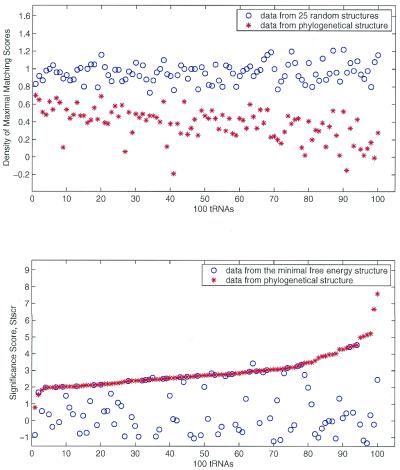
Among the 74 tRNAs, three predicted optimized structures have Stscr a little higher than that computed by the common cloverleaf structures. The three tRNAs are coded by DW4360, DF5220 and DX4960. The optimized structures of these three tRNAs are very close to the corresponding cloverleaf structures. Four out of the 74 lowest free energy structures have Stscr scores >1.96 in which the optimized structures are quite different from the functional cloverleaf structures. They are tRNAs DS1230, DY6743, DN4620 and DG2921. The Stscr values computed by the optimized structure are 2.75, 2.66, 2.46 and 2.31, respectively. But the corresponding scores of Stscr computed by the common functional structures are 3.46, 2.76, 7.59 and 2.61, which are greater than those computed from the optimized structures. The structural difference between the well ordered conformation of the phylogenetic cloverleaf structures and the predicted minimal energy structures is statistically significant. The bulk distribution of NRd of natural tRNA structures is different from the random structures as shown in Figure 2. Also the Stscr distribution computed from the classical cloverleaf structures is different and separate from that of the corresponding lowest free energy structures.
Figure 2.
Density values (top) of maximal matching scores, NRd and RRd, as well as significance scores, Stscr (bottom) of the uniqueness of phylogenetically conserved secondary structures and the lowest free energy structures computed from 100 tRNAs. The score NRd was computed from structure comparisons between the conserved tRNA secondary structure and 300 random structures that were computed from 300 randomly shuffled sequences of the natural tRNA by mfold and Turner energy rules. The score RRd was computed from structure comparisons among 25 random structures and the 300 random structures mentioned above. The 25 random structures were computed from the other 25 randomly shuffled sequences of the natural tRNA by mfold and Turner energy rules. The phylogenetically conserved tRNA secondary structures have small NRd and large Stscr values.
RNase P RNAs are also uniquely folded
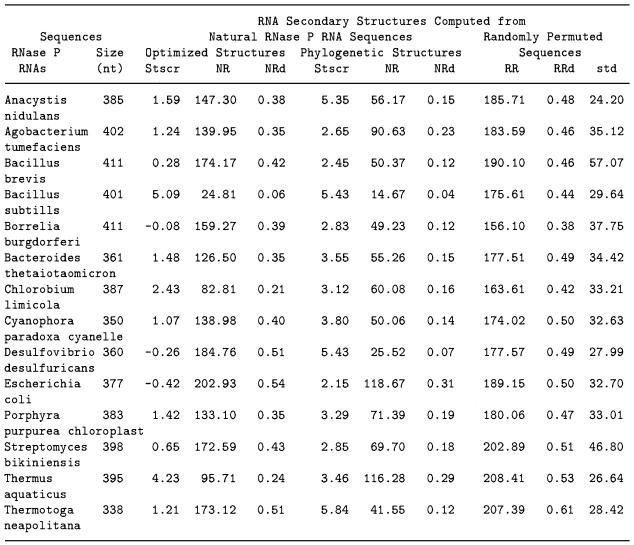
NRd and Stscr of secondary structures of 14 RNase P RNAs are listed in Table 2. NRd values from the phylogenetically inferred secondary structures range from 0.04 to 0.31 and average to 0.16 ± 0.08. The NRd from the optimized structures predicted by mfold ranges from 0.06 to 0.54 and average to 0.37 ± 0.13. RRd calculated from permuted random sequences ranged from 0.38 to 0.61 and averaged to 0.48 ± 0.05. Well ordered conformations in the phylogenetically conserved structures of RNase P RNAs are easily distinguished from those of permuted random sequences by the NRd and RRd. Stscr of 14 phylogenetically inferred structures range from 2.15 to 5.84 and average to 3.73 ± 1.25. All 14 Stscr values are >2.10. Clearly the phylogenetically inferred structure of RNase P RNAs are distinct from random.
Table 2. Significance scores (Stscr) of the uniqueness of RNA secondary structures from 14 RNase P RNA molecules.
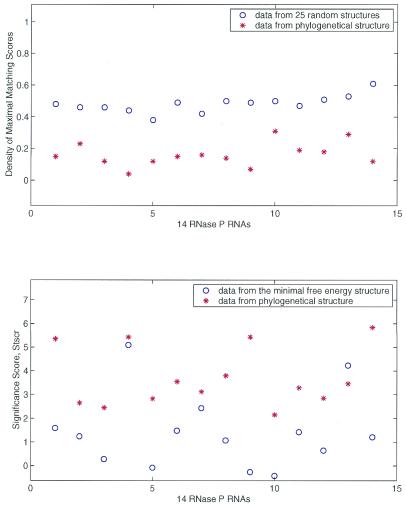
In contrast only three optimized structures computed by mfold have high Stscr values >2.10. Only for Thermus aquaticus RNase P RNA Stscr computed from the predicted optimized structure is greater than that from the phylogenetically inferred structure. The Stscr scores of the 14 optimized structures average to 1.42 ± 1.59. The sample mean of 14 observations of Stscr is far less than the average Stscr (Stscr = 3.73) computed from the well-established structures. Our data clearly indicate that the phylogenetically conserved structures of RNase P RNAs have more ordered conformations than those in the optimized structures. The difference of structural morphology observed between the phylogenetically inferred and optimized structures is statistically significant. Figure 3 shows that NRd and RRd cluster completes separately for phylogenetic structures and that Stscr cluster differently but not completely separate between phylogenetic and lowest free energy structures.
Figure 3.
Density values (top) of maximal matching scores, NRd and RRd, as well as scores Stscr (bottom) of the uniqueness of phylogenetically conserved secondary structures and the lowest free energy structures computed from the 14 RNase P RNAs. The phylogenetically conserved secondary structures of RNase P RNAs have small NRd and large Stscr values. For further details see the legend to Figure 2.
Some other known RNA elements have well ordered conformations
The results detailed in Table 3 show that FSR elements of Tetrahymena rRNA intron, HCV IRES, TAR and RRE of HIV-1 have high values of Stscr for the phylogenetically inferred structures. However, the significance score, Stscr computed from the optimized, lowest free energy structure is less than that computed from the phylogenetically inferred structures. For example, the significance scores Stscr computed from the inferred common structure and the optimized structure by mfold are 4.75 and 0.45, respectively, for the RNA sequence of Tetrahymena intron. Similar to tRNAs and RNase P RNAs, the phylogenetic structure of Tetrahymena intron has a more ordered conformation than the optimized structure. The computationally optimized structure of TAR functional element predicted by mfold is identical to the phylogenetically inferred structure and the optimized RRE structure is close to the common structure inferred by phylogenetic comparisons. Thus, both the inferred conserved structures and the optimized structures of functional TAR and RRE molecules have high Stscr values.
Table 3. Significance scores (Stscr) of the uniqueness of RNA secondary structures from the functional RNA elements of T.thermophilia rRNA intron (T. ther), IRES of HCV, TAR and RRE of HIV-1.
DISCUSSION
The results presented in this paper indicate that FSRs have small NRd and large Stscr. The distinct structural conformations found in the functional RNA sequences are unlikely to occur by chance. Our data strongly support the hypothesis that RNA molecules, such as tRNAs and RNase P mRNAs, possess well ordered conformations that play a crucial role in their biological functions.
The sequences of FSRs are evolutionary products that have survived because they execute the biological function quite efficiently. It is reasonable to hypothesize that the thermodynamic stability contributed by base pair stacking constrains the extent of possible ordered conformations in RNA evolution. It has been suggested that the evolved conformations of functional RNAs are significantly more ordered than conformations of randomly shuffled sequences (10). Our computational experiment suggests that the sequences of tRNAs, RNase P mRNAs, Tetrahymena group I intron and the cis-acting elements TAR, RRE and IRES of HCV are optimized with respect to their conformational properties. The sequences of these FSRs have specific structural morphologies to adapt to their particular functions. Multistem junctions are a common morphology in the functional structures of tRNAs, RNase P RNAs, group I intron, IRES of HCV and RRE of HIV, and are also abundant in ribosomal RNAs and small ribonucleoprotein RNAs.
Complete understanding of the role of structured RNAs requires knowledge at the three-dimensional, atomic level. However, we know little about the atomic-level details except what is available for a few tRNAs, the structure core of Tetrahymena group I intron and a few RNA fragments. Tinoco and Bustamante (14) proposed that RNA folding is hierarchical and sequential and RNA secondary structure often determines tertiary structure. This implies that correct prediction of RNA secondary structure is a key step for predicting RNA structure from sequence. RNA secondary structures are currently predicted by phylogenetic comparisons and free energy minimization. In calculation of NRd and Stscr of the test RNAs we use the RNA structures inferred by both methods. Our results show that almost all RNA structures inferred by phylogenetic comparisons tested in this study possess well ordered conformations that are statistically significant. Their distinct conformations are rare features that are not anticipated in randomly permuted sequences. The predicted minimum free energy structures, however, are typically only moderately well ordered. In some cases of extensively studied structures such as HIV TAR and RRE the optimized structures are statistically well ordered.
The two quantitative scores of NRd and Stscr are dependent on score functions associated with the three operations in RNA structure comparison. Two matrices of score functions associated with operations on unpaired bases and paired bases were used in this study. They were derived empirically and arbitrarily. More reasonable score functions need to be developed in future. However, we expect that the significance score Stscr of RNA secondary structures may not be sensitive to the score functions used for structure comparison. A test for 34 tRNAs indicates that the difference between Stscr scores computed using the two different sets of score functions is not significant.
In the calculation of the measure RR, we collect a set of 25 random sequences arbitrarily and compare their folded structures with other 300 random structures. It is also worth choosing those random sequences whose folded energy is less than or close to the lowest free energy computed from the natural sequence in the structure comparison between random versus random sequences. The preliminary results for four tRNAs show that the sample standard deviation computed from random versus random MMS is decreased by the approach. It seems that the approach will slightly improve our method; however, further detailed investigation is needed.
Schultes et al. (10) recently proposed three measures to define the stability and uniqueness of RNA secondary structures based on the mean length of stems and total number of base pairs in the computed structure from RNAfold (27) and/or VIENNA (28). The difference between two structure morphologies was not considered throughly in their method. Various similarity measures between two RNA secondary structures have also been discussed by three classes of secondary structure metrics (29). The method used here is related to the ‘tree’ metrics mentioned in their paper, but does the comparison at a more detailed level. It should be noted that in the work described here only the optimized stable one is selected to represent the random structure and any RNA molecules whose secondary structure was not well established. As a result, conformations used in the structure comparison between natural and randomly shuffled sequences are limited. We know that alternative computed structures with higher free energies can also be computed from the program mfold (16). It is also likely that these alternative structures may be as good as the optimized structure because of uncertainty in the energy parameters and the assumptions used in the mfold algorithm. Nevertheless, our method is the first computational method to examine the detailed difference of structure morphologies throughout between natural RNA molecules and the corresponding randomly shuffled sequences. The results presented in this paper demonstrate that we need a quantitative measure to estimate the uniqueness of the folded RNA structures. The quantitative measure of free energies of RNA folding alone is not enough for us to make a good judgment of a functional RNA structure based on the current energy rules (16).
We previously proposed a computational method using the programs SIGSTB and SEGFOLD (13) to search for unusual folding regions that are thermodynamically more stable than the average of other local segments in the sequence, and more stable than random. The method described here adds the criteria of uniqueness of folding morphologies. We anticipate that the combined approach will enhance the ability for data mining of functional RNA elements in mRNAs. However, even with enhanced statistical significance we still need additional biological information to evaluate if a local RNA segment with a well ordered conformation is a functional element. Nevertheless, past experience shows that the approach of computational discovery of structural features is very helpful in the determination of local RNA elements with structure dependent functions in mRNAs. This is especially applicable to knowledge discovery in the post-genomic age.
Acknowledgments
ACKNOWLEDGEMENTS
We thank Dr Bruce Shapiro for his insightful suggestions and comments. The content of this publication does not necessarily reflect the views or policies of the Department of Health and Human Services, nor does mention of trade names, commercial products, or organizations imply endorsement by the U.S. Government. The program rna_match for structural comparisons can be accessed through the Internet at http://www.csd.uwo.ca/faculty/kzhang/rna/rna_match.html.
REFERENCES
- 1.Simons R.W. and Grunberg-Manago,M. (eds) (1998) RNA Structure and Function. Cold Spring Harbor Laboratory Press, Cold Spring Harbor, NY.
- 2.Bashirullah A., Cooperstock,R.L. and Lipshitz,H.D. (1998) RNA localization in development. Annu. Rev. Biochem., 67, 335–394. [DOI] [PubMed] [Google Scholar]
- 3.Gray N.K. and Wickens,M. (1998) Control of translation initiation in animals. Annu. Rev. Cell. Dev. Biol., 14, 399–458. [DOI] [PubMed] [Google Scholar]
- 4.Rajagopalan L.E. and Malter,J.S. (1997) Regulation of eukaryotic messenger RNA turnover. Prog. Nucleic Acid Res. Mol. Biol., 56, 257–286. [DOI] [PubMed] [Google Scholar]
- 5.Woese C.R., Winker,S. and Gutell,R.R. (1990) Architecture of ribosomal RNA: constraints on the sequence of “tetra-loops”. Proc. Natl Acad. Sci. USA, 87, 8467–8471. [DOI] [PMC free article] [PubMed] [Google Scholar]
- 6.Gautheret D., Konings,D. and Gutell,R.R. (1995) G:U base pairing motifs in ribosomal RNA. RNA, 1, 807–814. [PMC free article] [PubMed] [Google Scholar]
- 7.Elgavish T., Cannone,J.J., Lee,J.C., Harvey,S.C. and Gutell,R.R. (2001) A:A and A:G base-pairs at the ends of 16 S and 23 S rRNA helices. J. Mol. Biol., 310, 735–753. [DOI] [PubMed] [Google Scholar]
- 8.Williams D.J. and Hall,K.B. (2000) Experimental and computational studies of the G(UUCG)C RNA tetra-loop. J. Mol. Biol., 297, 1045–1061. [DOI] [PubMed] [Google Scholar]
- 9.Draper D.E. (1996) Strategies for RNA folding. Trends Biochem. Sci., 21, 145–149. [PubMed] [Google Scholar]
- 10.Schultes E.A., Hraber,P.T. and LaBean,T.H. (1999) Estimating the contributions of selection and self-organization in RNA secondary structure. J. Mol. Evol., 49, 76–83. [DOI] [PubMed] [Google Scholar]
- 11.Moore P.B. (1999) Structural motifs in RNA. Annu. Rev. Biochem., 68, 287–300. [DOI] [PubMed] [Google Scholar]
- 12.Le S.-Y., Malim,M.H., Cullen,B.R. and Maizel,J.V.,Jr (1990) A highly conserved RNA folding region coincident with the Rev response element of primate immunodeficiency viruses. Nucleic Acids Res., 18, 1613–1623. [DOI] [PMC free article] [PubMed] [Google Scholar]
- 13.Le S.-Y., Chen,J.-H. and Maizel,J.V.,Jr (1990) Efficient searches for unusual folding regions in RNA sequences. In Sarma,R.H. and Sarma,M.H. (eds), Structure & Methods: Human Genome Initiative and DNA Recombination. Adenine Press, Schenectady, NY, Vol. I, pp. 127–136.
- 14.Tinoco I. Jr and Bustamante,C. (1999) How RNA folds. J. Mol. Biol., 293, 271–281. [DOI] [PubMed] [Google Scholar]
- 15.Knuth D. (1973) The Art of Computer Programming. Addison-Wesley, Reading, MA, Vol. 3, p. 237.
- 16.Mathews D.H., Sabina,J., Zuker,M. and Turner,D.H. (1999) Expanded sequence dependence of thermodynamic parameters provides improved prediction of RNA secondary structure. J. Mol. Biol., 288, 911–940. [DOI] [PubMed] [Google Scholar]
- 17.Zuker M. (1989) On finding all suboptimal foldings of an RNA molecule. Science, 244, 48–52. [DOI] [PubMed] [Google Scholar]
- 18.Zhang K. (1998). Computing similarity between RNA secondary structures. Proceedings of IEEE International Joint Symposia on Intelligence and Systems. IEEE Press, USA, pp. 126–132.
- 19.Zhang K., Wang,L. and Ma,B. (1999) Computing similarity between RNA structures. Proceedings of the Tenth Symposium on Combinatorial Pattern Matching. Springer-Verlag’s Lecture Notes in Computer Science 1645. Springer-Verlag, Heidelberg, Germany, pp. 281–293.
- 20.Collins G., Le,S.-Y. and Zhang,K. (2001) A new algorithm for computing similarity between RNA structures. Information Sciences, 139, 59–77. [Google Scholar]
- 21.Eddy S.R. and Durbin,R. (1994) RNA sequence analysis using covariance models. Nucleic Acids Res., 22, 2079–2088. [DOI] [PMC free article] [PubMed] [Google Scholar]
- 22.Sprinzl M., Brown,H.M., Ioudovitch,A. and Steinberg,S. (1998) Compilation of tRNA sequences and sequences of tRNA genes. Nucleic Acids Res., 26, 148–153. [DOI] [PMC free article] [PubMed] [Google Scholar]
- 23.Brown J.W. (1999) The ribonuclease P database. Nucleic Acids Res., 27, 314. [DOI] [PMC free article] [PubMed] [Google Scholar]
- 24.Michel F. and Westhof,E. (1990) Modelling of the three-dimensional architecture of group I catalytic introns based on comparative sequence analysis. J. Mol. Biol., 216, 585–610. [DOI] [PubMed] [Google Scholar]
- 25.Muesing M.A., Smith,D.H. and Capon,D.J. (1987) Regulation of mRNA accumulation by a human immunodeficiency virus trans-activator protein. Cell, 48, 691–701. [DOI] [PubMed] [Google Scholar]
- 26.Honda M., Beard,M.R., Ping,L.H. and Lemon,S.M. (1999) A phylogenetically conserved stem–loop structure at the 5′ border of the internal ribosome entry site of hepatitis C virus is required for cap-independent viral translation. J. Virol., 73, 1165–1174. [DOI] [PMC free article] [PubMed] [Google Scholar]
- 27.Zuker M. and Steigler,P. (1981) Optimal computer folding of large RNA sequences using thermodynamics and auxiliary information. Nucleic Acids Res., 9, 133–149. [DOI] [PMC free article] [PubMed] [Google Scholar]
- 28.Hofacker I.L., Fontana,W., Stadler,P.F., Bonhoeffer,L., Tacker,M. and Schuster,P. (1994) Fast folding and comparison of RNA secondary structures. Monatshefte Chem., 125, 167–188. [Google Scholar]
- 29.Moulton V., Zuker,M., Steel,M., Pointon,R. and Penny,D. (2000) Metrics on RNA secondary structures. J. Comput. Biol., 7, 277–292. [DOI] [PubMed] [Google Scholar]


