Abstract
Scanning force spectroscopy was used to measure the mechanical properties of double stranded RNA molecules in comparison with DNA. We find that, similar to the B–S transition in DNA, RNA molecules are stretched from the assumed A′ conformation to a stretched conformation by applying a defined force (plateau force). The force depends on the G + C content of the RNA and is distinct from that required for the B–S transition of a homologous DNA molecule. After the conformational change, DNA can be further extended by a factor of 0.7 ± 0.2 (S-factor) before melting occurs and the binding of the molecule to the cantilever is finally disrupted. For RNA, the S-factor was higher (1.0 ± 0.2) and more variable. Experiments to measure secondary structures in single stranded RNA yielded a large number of different force-distance curves, suggesting disruption and stretching of various secondary structures. Oriented attachment of the molecules to the substrate, a defined pick-up point and an increased resolution of the instrument could provide the means to analyse RNA secondary structures by scanning force spectroscopy.
INTRODUCTION
For the measurement of interaction forces in biological molecules, scanning force spectroscopy (SFS) has become increasingly important. Biochemical methods allow for the determination of association and dissociation constants but binding forces cannot be investigated. Alternative methods are the use of optical tweezers (1,2) and magnetic micro particles (3–5).
Recent experiments have determined binding forces for biotin–avidin interaction (6), forces within secondary structures of titin (7) and hybridization forces in small RNA molecules (2). Even forces generated by cell adhesion molecules on a living cell have been measured (8).
The physical properties of DNA have been extensively examined but only in 1996, when Cluzel et al. (9) and Smith et al. (10) independently discovered the S-form of DNA: applying a force of ∼65 pN, B-form DNA is cooperatively stretched and can then be further elongated by a factor of ∼1.7 almost without applying any further forces. Rief et al. (11) confirmed this by SFS and detected a further cooperative transition at 200 and 300 pN which was interpreted as melting of the DNA and separation of the strands.
RNA molecules usually exist as ‘single strands’ in living cells but intramolecular interactions result in three-dimensional secondary structures that are important for their biological function. Completely or partially double stranded (ds)RNAs are found in vivo in RNA viruses, in viroids and more recently also in siRNAs, the effectors of RNAi (12). Although RNA secondary structures can be calculated (13,14), the predictions are always highly speculative, alternative folding may occur with minor changes in temperature or salt concentrations, or molecules may be trapped in an irreversible structure during transcription. SFS could provide a tool to investigate secondary structures in RNA molecules when sufficient resolution in stretching and melting of small duplex regions can be achieved. A necessary basis for such investigations is to establish the general physical parameters of dsRNA. Here we have determined the forces required for the A′–S transition and the S-factor for dsRNA in comparison to dsDNA. We find that both classes of molecules can be readily distinguished by SFS. As for DNA, the A′–S transition force (plateau force) depends on the G + C content and is higher by ∼20% for RNA molecules. The S-factor is higher by ∼30% and more variable than that of DNA molecules. Application of the data for secondary structure investigations will be discussed.
MATERIALS AND METHODS
Force spectroscopy
Force-displacement measurements were performed with a commercial AFM (Nanoscope III, Digital Instruments, Santa Barbara, CA) and an additional second piezo with a z-range of 1.5 µm mounted on the commercial scanner. The data acquisition of the cantilever deflection data and the control of the z-piezo displacement of the second piezo was improved by using a 16-Bit AD/DA card in combination with an additional personal computer, a custom-built high voltage amplifier and custom-designed software. The retract velocity was 600 nm/s and each force curve consisted of 1000 steps. All experiments were conducted in 10 mM HEPES-buffer, pH 7 with 5 mM NiCl2 at 25°C, unless otherwise specified.
The spring constants of all cantilevers (Si3N4 AFM tips, Microlevers, Park Scientific Instruments, Sunnyvale, CA) were calibrated by the thermal fluctuation method (15) with absolute uncertainly of 20%. The sensitivity of the optical lever detection was then measured by indenting a hard surface with the AFM tip (i.e. by choosing an area on the substrate where no nucleic acid had been deposited. The measurements presented here were performed with 10 different cantilevers with spring constants ranging from 8 to 12 pN/nm.
Preparation of nucleic acids
dsRNA and single stranded (ss)RNA was prepared as described previously (16) by in vitro transcription of linearized plasmids pGEM-EB4-1 and pGEM7z-Gal using T7 RNA polymerase and SP6-polymerase. DNA was prepared by restriction digestion of plasmids pGEM-EB4-1 and pGEM7z-Gal with Acc65I and BamHI. Fragments of 724 and 826 bp, respectively, were separated by agarose gel electrophoresis and eluted from the gel using Nucleotrap (Macherey and Nagel, Düren, Germany).
The respective dsRNA and dsDNA molecules were identical in sequence except for minor differences at the ends.
Preparation of samples for spectroscopy
Mica was freshly cleaved and activated for 1 min in air plasma at 0.2 mbar, 600 V, 20 kHz (17). Then, 10 µl of the nucleic acid samples (0.1 µg/µl) in 10 mM HEPES, pH 7, 5 mM NiCl2 were loaded onto the mica surface and dried at 50–70°C. The sample was then washed with buffer and mounted in a volume of 60–100 µl in the fluid cell of the nanoscope.
Data acquisition
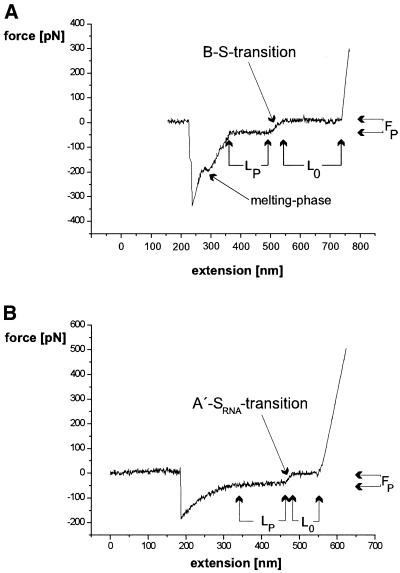
S-values were calculated from individual force-distance measurements by dividing the plateau length (LP) by the length of the zero line (L0). Plateau forces (FP) were determined by measuring the vertical distance between the zero line and the plateau line (see Fig. 1 for details).
Figure 1.
Representative force-distance curves for (A) a dsDNA molecule and (B) a dsRNA molecule. The different phases and the data values used for the evaluation of curves are indicated in the diagram.
RESULTS AND DISCUSSION
We first examined force spectrograms of dsRNA in comparison with dsDNA of identical sequence. As shown in Figure 1A, dsDNA measurement resulted in the expected force-distance curve: in this specific case, a DNA molecule bound to the tip was extended for ∼200 nm (L0), at the B–S transition a force (FP) of ∼65 pN was measured, the molecule was further extended for ∼125 nm (LP), an additional ∼150 pN had to be applied before melting occurred (indicated by a small plateau) and the molecule was finally detached at a force of ∼350 pN.
For dsRNA, the spectrogram looked similar in the first part (Fig. 1B): the specific example displayed a L0 of ∼70 nm, a FP of ∼60 pN and a LP of 120 nm. A melting plateau was not observed and detachment occurred at a total of ∼200 pN.
The disruption of contact between surface, nucleic acid and cantilever tip can occur by different means: if the same strand of a duplex is bound to both the cantilever and the surface, the non-specific binding on either end has to be disrupted. If one strand is bound to the surface and the other one to the tip, strand separation of the duplex could cause the loss of contact. Also, the simultaneous attachment of both strands on either or both sides cannot be excluded. As the nature of the non-specific binding is not known and various disruption forces were measured for the same species of molecules, we only examined further the values for FP, L0 and LP. In this first example it was already obvious that the LP value for RNA was much larger in comparison with the L0 value than for DNA.
As the non-specific attachment points of the molecules to the surface and to the cantilever cannot be predicted, the L0 was variable. In dsDNA and dsRNA, it ranged from 50 to 215 nm for the EB4-1 fragment and from 50 to 245 nm for the Gal fragment. As expected, the maximal length corresponded well to the calculated length of the molecules.
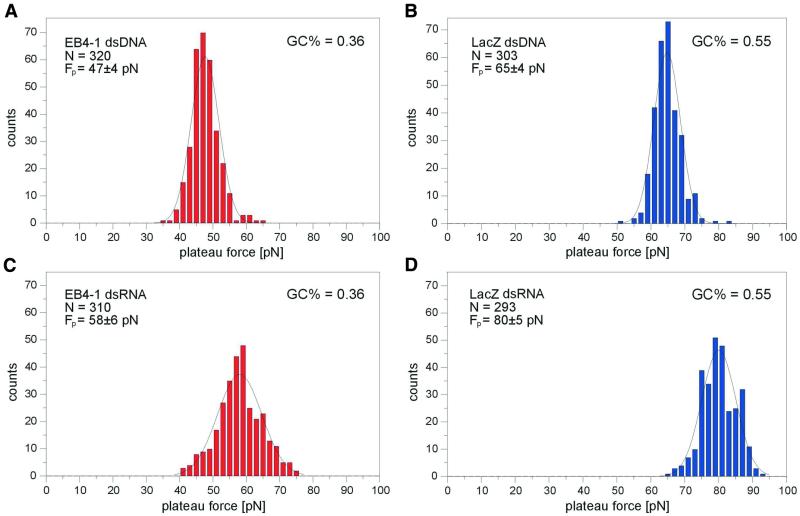
The FP was measured for the EB4-1 DNA fragment (724 bp, 36% G + C content) and the Gal DNA fragment (826 bp, 55% G + C). Figure 2A and B shows that with more than 300 measurements in both cases, a narrow distribution of ∼47 and 65 pN, respectively, was found. Especially the latter value was in good agreement with the force of 65 pN found for λDNA [52% G + C (11)]. A decrease in the FP with increasing A + T content was expected as previous experiments (18) had shown an FP of only 35 pN for a poly(dA)–poly(dT) duplex. The FP of 47 pN for a DNA with a 36% G + C content fits very well in the intermediary range of plateau forces.
Figure 2.
Forces required for the B–S transition and the A′–S transition respectively in DNA and RNA molecules of different G + C content (FP = plateau force). The diagrams show the number of measurements generating a specific force. (A) dsDNA with a G + C content of 36%; (B) dsDNA with a G + C content of 55%; (C) dsRNA with a G + C content of 36%; (D) dsRNA with a G + C content of 55%.
The corresponding dsRNA molecules also showed a clear transition from the assumed A′ form (16) to an S-like conformation (A′–S transition). However, the plateau forces were significantly augmented and displayed values of 58 pN for 36% G + C content and 80 pN for 55% G + C (Fig. 2C and D). In both cases a 20% higher force was found in comparison with the DNA molecule of similar length and base composition. The difference between the two classes of nucleic acids thus appeared to be independent of the G + C content. It was notable that the distribution of plateau forces was much broader for RNA than it was for DNA. As all measurements were done under the same conditions, this cannot be explained by different error margins but indicates that the transition force for RNA is not only larger but also truly more variable. The increased transition force may, among other factors, be due to higher stacking forces in RNA molecules. Similarly, RNA–RNA hybrids also display higher melting temperatures compared with the corresponding DNA–DNA duplices.
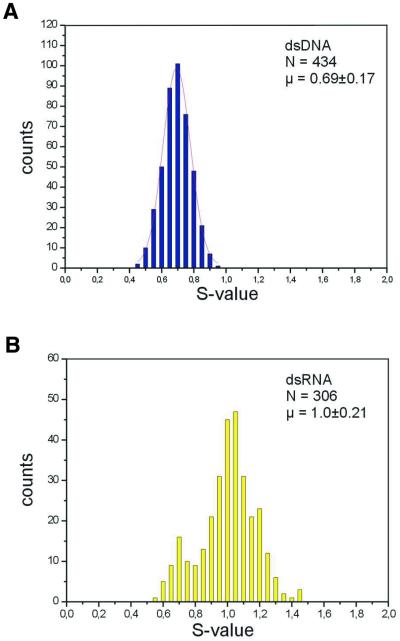
After the B–S transition, the LP in DNA was rather constant in respect to L0, i.e. the initial length of the molecule stretched between cantilever and substrate, with an S-value of 0.7. As depicted in Figure 3A, this factor varied in a sample of 434 measurements maximally between 0.45 and 0.95. For dsRNA (Fig. 3B) the S-value of 1.0 was not only higher by a factor of 1.45 but its distribution was also broader in absolute terms and ranged from 0.7 to 1.45. In both cases, however, S-values varied ∼2-fold (2.1 for DNA, 2.07 for RNA). As a result of the C3′-endo conformation of the ribose, the A′ form of RNA is more tightly packed than the B form of DNA. Calculating a height of 0.34 nm/bp in B-DNA and of 0.30 nm/bp in A′-RNA this could account for a 1.13-fold difference in the S-values of the two classes of molecules. Calculating the distance of the phosphates in the C2′-endo and C3′-endo conformation (0.7 and 0.59 nm, respectively) results in a difference of 1.18. Both could not fully account for the measured difference in S-values of 1.45. The small peak in the dsRNA diagram at 0.7 corresponds exactly to the S-factor of dsDNA and is most likely due to a <10% DNA contamination in the preparation. The results are summarized in Table 1.
Figure 3.
S-factors for (A) dsDNA and (B) dsRNA. The diagrams show the number of measurements generating specific S-factors. The small peak in the dsRNA diagram at 0.7 corresponds exactly to the S-factor of dsDNA and is most likely due to a DNA contamination in the preparation. S-factors were calculated as described in the Materials and Methods.
Table 1. Comparison of plateau forces and S-factors in different dsDNA and dsRNA molecules.
| Molecule | G + C content (%) | Length (bp) | FP | S-factor |
|---|---|---|---|---|
| dsDNA, EB4-1 | 36 | 724 | 47 ± 4 pN | 0.7 ± 0.2 |
| dsDNA, β-galactosidase gene | 55 | 826 | 65 ± 4 pN | 0.7 ± 0.2 |
| dsDNA, phage λa | 52 | Various | 65 pN | n.d. |
| dsDNA, poly(dA–dT)a | 0 | Various | 35 pN | n.d. |
| dsRNA, EB4-1 | 36 | 707 | 58 ± 6 pN | 1 ± 0.2 |
| dsRNA, β-galactosidase gene | 55 | 808 | 80 ± 6 pN | 1 ± 0.2 |
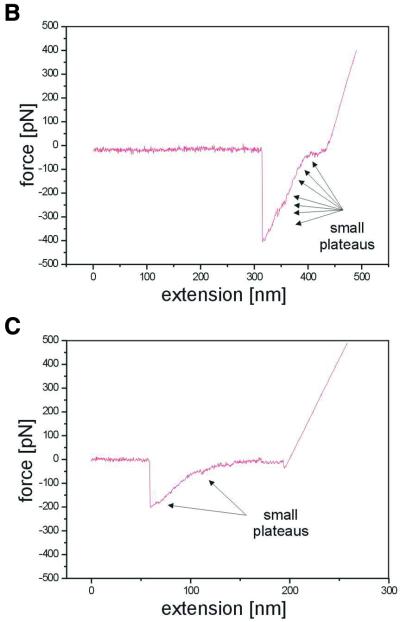
A ssRNA in vitro transcript corresponding to the mRNA sense transcript of EB4-1 was then used for force measurements. As ssRNA forms extensive secondary structures, these molecules are not a valid control to investigate stretching of a single strand in comparison to a double strand. As shown in the calculated structure in Figure 4A, the molecule can form a complex arrangement with several extended duplex regions (ΔG of –633.3 kJ). As minor changes in the free energy can dramatically change the predicted structure, this was only one of several possible conformations. In contrast to the monotonous double strands, different pick-up points, i.e. the position in the molecule where the non-specific interaction with the cantilever takes place, will result in different force-distance curves. Force measurements were done as for the double stranded nucleic acids. Two examples are shown in Figure 4B and C and are discussed in more detail. Both cases display zero lines of ∼50 nm and then an extension of the molecule by ∼90 nm. In the upper panel, 400 pN are required to disrupt contact while in the lower panel only 200 pN had to be applied. Furthermore, the transition from the zero line to the loss of contact was very different in both cases: in the upper panel, a steep increase in force interrupted by small plateaus was required to achieve the same extension as in the lower panel, where a small force of ∼60–70 pN was sufficient for almost one-third of the extension, the subsequent increase in force was interrupted by two small plateaus. More than 200 molecules were measured and yielded different curves, which could not be assigned to a common pattern. However, all were different from the measurements with double stranded molecules and displayed irregular extension of the molecules with diverse force input. This would be in agreement with various secondary structures of the RNA and various attachment sites on the surface and the cantilever. In addition, one cannot exclude that more than a single molecule was picked up. SFS thus produces highly variable force-distance curves from ssRNA in contrast to uniform curves from dsRNA. This would be consistent with a multitude of possible secondary structures. The method used here does not, however, allow for statistical evaluation and correlation of the diagrams with predicted structures. More uniform curves which can be interpreted in terms of secondary structure and structural dynamics could be obtained when molecules are attached to the surface and the cantilever at distinct, modified nucleotides. Experiments along these lines have recently been presented by Lipardt et al. (2) using optical tweezers and RNA molecules attached to polystyrene beads.
Figure 4.
(A) Calculated secondary structure of EB-4-1 ssRNA (707 nt). The bar represents 6 nm. (B and C) Two examples of force-distance measurements on ssRNA (EB4-1). Small plateaus may correspond to A′–S transitions of individual double stranded regions (secondary structures).
Acknowledgments
ACKNOWLEDGEMENTS
We thank R. Kassing for helpful discussions and for use of equipment. This work was supported in part by the Zentrale Forschungsförderung of Kassel University. M.B. was a recipient of a grant from the Otto-Braun-Fonds. R.Z. was in part supported by a grant from the Deutsche Forschungsgemeinschaft to W.N. (Ne285/4) and by a grant from the DFG Graduiertenkolleg GRK 248 to R. Kassing.
REFERENCES
- 1.Sheetz M.P. (1998) Laser tweezers in cell biology. Introduction. Methods Cell Biol., 55, xi–xii. [PubMed] [Google Scholar]
- 2.Liphardt J., Onoa,B., Smith,S.B., Tinoco,J.R. and Bustamante,C. (2001) Reversible unfolding of single RNA molecules by mechanical force. Science, 292, 733–737. [DOI] [PubMed] [Google Scholar]
- 3.Smith S.B., Finzi,L. and Bustamante,C. (1992) Direct mechanical measurements of the elasticity of single DNA molecules by using magnetic beads. Science, 258, 1122–1126. [DOI] [PubMed] [Google Scholar]
- 4.Ziemann F., Radler,J. and Sackmann,E. (1994) Local measurements of viscoelastic moduli of entangled actin using an oscillating magnetic bead micro-rheometer. Biophys. J., 66, 2210–2216. [DOI] [PMC free article] [PubMed] [Google Scholar]
- 5.Strick T.R., Allemand,J.F., Bensimon,D. and Croquette,V. (1998) Behavior of supercoiled DNA. Biophys. J., 74, 2016–2028. [DOI] [PMC free article] [PubMed] [Google Scholar]
- 6.Moy V.T., Florin,E.L. and Gaub,H.E. (1994) Intermolecular forces and energies between ligands and receptors. Science, 266, 257–259. [DOI] [PubMed] [Google Scholar]
- 7.Rief M., Gautel,M., Oesterhelt,F., Fernandez,J.M. and Gaub,H.E. (1997) Reversible unfolding if individual titin Ig-domains by AFM. Science, 276, 1109–1112. [DOI] [PubMed] [Google Scholar]
- 8.Benoit M., Gabriel,D., Gerisch,G. and Gaub,H.E. (2000) Discrete interactions in cell adhesion measured by single-molecule force spectroscopy. Nature Cell Biol., 6, 313–317. [DOI] [PubMed] [Google Scholar]
- 9.Cluzel P., Lebrun,A., Heller,C., Lavery,R., Viovy,J.-L., Chatenay,D. and Caron,F. (1996) DNA: an extensible molecule. Science, 271, 792–794. [DOI] [PubMed] [Google Scholar]
- 10.Smith S.B., Cui,Y. and Bustamante,C. (1996) Overstretching B-DNA: the elastic response of individual double-stranded and single-stranded DNA molecules. Science, 271, 795–799. [DOI] [PubMed] [Google Scholar]
- 11.Rief M., Clausen-Schaumann,H. and Gaub,H.E. (1999) Sequence dependent mechanics of single DNA-molecules. Nature Struct. Biol., 6, 346–349. [DOI] [PubMed] [Google Scholar]
- 12.Hamilton A.J. and Baulcombe,D.C. (1999) A species of small antisense RNA in posttranscriptional gene silencing in plants. Science, 286, 950–952. [DOI] [PubMed] [Google Scholar]
- 13.Zuker M., Mathews,D.C. and Turner,D.H. (1999) Algorithms and thermodynamics for RNA secondary structure prediction: a practical guide. In Barciszewski,J. and Clark,B.F.C. (eds), RNA Biochemistry and Biotechnology. NATO ASI Series, Kluwer Academic Publishers, Dordrecht, The Netherlands, pp. 11–43.
- 14.Mathews D.H., Sabina,J., Zuker,M. and Tuner,D.H. (1999) Expanded sequence dependence of thermodynamics parameters improves prediction of RNA secondary structure. J. Mol. Biol., 288, 911–940. [DOI] [PubMed] [Google Scholar]
- 15.Butt H.J. and Jascke,M. (1995) Calculation of thermal noise in atomic force microscopy. Nanotechnology, 6, 1–7. [Google Scholar]
- 16.Bonin M., Oberstrass,J., Lukacs,N., Ewert,K., Oesterschulze,E., Kassing,R. and Nellen,W. (2000) Determination of preferential binding sites for anti-dsRNA antibodies on double-stranded RNA by scanning force microscopy. RNA, 6, 563–570. [DOI] [PMC free article] [PubMed] [Google Scholar]
- 17.Aebi U. and Pollard,T.D. (1987) A glow discharge unit to render electron microscope grids and other surfaces hydrophilic. J. Electron Microsc. Tech., 7, 29–33. [DOI] [PubMed] [Google Scholar]
- 18.Clausen-Schaumann H., Rief,M., Tolksdorf,C. and Gaub,H.E. (2000) Mechanical stability of single DNA molecules. Biophys. J., 78, 1997–2007. [DOI] [PMC free article] [PubMed] [Google Scholar]


