Abstract
Electrospray mass spectrometry was evaluated regarding the reliability of the determination of the stoichiometries and equilibrium association constants from single spectra. Complexes between minor groove binders (Hoechst 33258, Hoechst 33342, DAPI, netropsin and berenil) and 12mer oligonucleotide duplexes with a central sequence (A/T)4 flanked by G/C base pairs were chosen as model systems. To validate the electrospray ionization mass spectrometry (ESI-MS) method, comparisons were made with circular dichroism and fluorescence spectroscopy measurements. ESI-MS allowed the detection of minor (2 drug + DNA) species for Hoechst 33258, Hoechst 33342, DAPI and berenil with duplex d(GGGG(A/T)4GGGG)· d(CCCC(A/T)4CCCC), which were undetectable with the other techniques. Assuming that the duplexes and the complexes have the same electrospray response factors, the equilbrium association constants of the 1:1 and 2:1 complexes were determined by ESI-MS, and the values show a good quantitative agreement with fluorescence determined constants for Hoechst 33258 and Hoechst 33342. It is also shown that ESI-MS can quickly give reliable information on the A/T sequence selectivity of a drug: the signal of a complex is directly related to the affinity of the drug for that particular duplex. The potential of ESI-MS as a qualitative and quantitative affinity screening method is emphasized.
INTRODUCTION
The coupling of electrospray ionization (ESI) to mass analyzers (1,2) has led to an important development in applications of mass spectrometry in the field of biomolecule analysis. In 1991 the capability of ESI mass spectrometry (ESI-MS) for detecting a non-covalent complex was first demonstrated (3). Since then, the literature concerning supramolecular complex analysis by ESI-MS has grown continuously. Several review articles describe the use of ESI- MS for studying complexes of biochemical interest (4–9), particularly nucleic acid complexes (10,11).
Observations of interactions between small drug molecules and DNA single strands (12,13), DNA duplexes (14–22) and different RNA targets (23–26) have been reported. The critical point is to assess whether or not the observed complexes do indeed reflect (qualitatively and quantitatively) the specific interactions that are present in solution (27). From the experimental point of view, detecting nucleic acid complexes in a manner that strictly reflects the solution phase composition by ESI-MS is not a trivial issue. Moreover, the replacement of physiological buffers by ammonium acetate electrolyte could be the origin of discrepancies between ESI-MS and traditional solution phase methods. In addition to these experimental factors, the process of ion emission from the charged droplets can cause intrinsic discrimination between the ions (different response factors), and these mechanisms are still only partially understood (28–32). If the ratio of the intensities truly reflects the ratio of the concentrations in solution, ESI-MS could become a powerful alternative method for determining binding constants in solution.
For nucleic acid complexes, it has already been suggested that ESI-MS spectra could reflect the species present in the solution (stoichiometries and relative abundances of the complexes) (17–19,26), but, to our knowledge, to date no validation by comparison with other techniques in ammonium acetate has been made. For this purpose, we have chosen to investigate complexes between well-studied minor groove binders (Hoechst 33258, Hoechst 33342, DAPI, netropsin and berenil) and 12mer oligonucleotide duplexes with a central sequence (A/T)4 flanked by G/C base pairs. In the present article, the mass spectrometric results are compared with circular dichroism and fluorescence spectroscopic data. The versatility and reliability of mass spectrometry to quickly determine the stoichiometry, relative stabilities and absolute equilibrium association constants of the complexes are discussed in the light of these comparisons.
MATERIALS AND METHODS
Materials
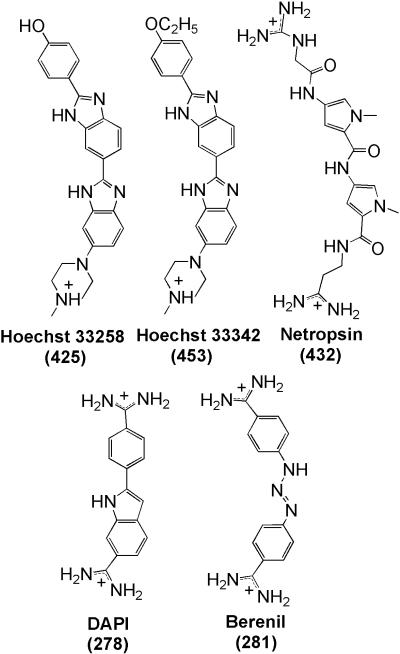
Single-stranded oligodeoxynucleotide dodecamers were purchased from Eurogentec (Seraing, Belgium). Four different duplexes were studied: three were formed by the non-self-complementary oligonucleotides d[GGGG(A/T)4GGGG] and d[CCCC(A/T)4CCCC], with the central sequence of the G-rich strand being ATAT, AATT or AAAA (these four letter codes are used in the text to designate the corresponding double-stranded 12mers). The self-complementary Dickerson dodecamer duplex d(CGCGAATTCGCG)2 (DK) was also studied. The duplexes were formed by heating the single strands up to 90°C and overnight cooling in 0.1 M ammonium acetate (pH 6.8 ± 0.2). The concentrations were determined by absorbance measurements (Beer’s law). The extinction coefficients of the duplexes were derived from a thermal denaturation curve, the ε260 values for the single strands being given by the supplier. The minor groove binders Hoechst 33258 (ε338 = 42 000) and Hoechst 33342 (ε348 = 42 000) (Acros, Geel, Belgium), DAPI (ε342 = 27 000) (Fluka, Bornem, Belgium), netropsin (ε296 = 21 500) (Serva, Heidelberg, Germany) and berenil (ε370 = 34 400) (kindly provided by C. Bailly, INSERM, Lille, France) were dissolved in 0.1 M NH4OAc. Ammonium acetate was chosen as the electrolyte for its compatibility with electrospray mass spectrometry (see below). Figure 1 shows the structures and masses of the drugs.
Figure 1.
Structure of the minor groove binders used in this study. Masses are noted in parentheses.
Mass spectrometry
Mass spectrometric measurements were carried out in a Finnigan LCQ ion trap instrument (ThermoFinnigan, San Jose, CA) equipped with its standard heated capillary electrospray source. As DNA is a negatively charged polyelectrolyte at neutral pH, the electrospray source was operated in the negative ion mode, with a needle voltage of –3.9 kV. Sodium ions must be avoided in ESI-MS due to the formation of multiple adducts on biopolymers and the resulting loss of sensitivity and resolution. Ammonium cations are used because NH3 is readily lost during or just after the last desolvation steps. In practice, one or two weak sodium adducts are still present in our spectra. To obtain a stable electrospray signal, it was necessary to add 20% methanol to the injected solution. Methanol was added just before injection, after the complexation equilibrium in NH4OAc was established. Spectra of equimolar mixtures of all possible duplex + drug combinations were recorded at three different concentrations C0 = 2, 4 and 10 µmol/l. The heated capillary temperature of the electrospray source was set at 190°C. Note that the ions remain in the heated capillary of the source for only ∼10–3 s and that the electrospray needle is not heated. We therefore assume that the measured equilibrium constants correspond to those at room temperature (20°C). A good compromise between sufficient focusing and minimal collisional activation of the ions in the 1 torr region of the source was achieved with a tube lens offset of 35 V and a voltage on the heated capillary of –10 V (the skimmer is at ground) (21). Collisional activation was also minimized in the octopoles. Full scan MS spectra were recorded in the mass range 1000–2000. For the determination of the equilibrium association constants, the relative intensities were measured from a sum of 50 spectra. Each spectrum consists of three microscans.
Circular dichroism
CD spectra were obtained at 20°C with a Jobin Yvon CD6 (Lonjumeau, France) circular dichrograph. A quartz cell (Hellma Inc.) of 10 mm path length was used to obtain spectra at 0.5 nm intervals from 220 to 450 nm. Spectra result from the averaging of four scans, followed by subtraction of the baseline using a solution of 0.1 M aqueous NH4OAc. Duplex concentration was 2 µM and the drug was added up to a molar ratio r = [drug]/[duplex] = 2.2.
Fluorescence spectroscopy
The Job method of continuous variation (33) was used to determine the stoichiometries of the complexes with Hoechst 33258. The fluorescence signal was measured on a LS-50 fluorescence spectrofluorometer with an excitation wavelength of 354 nm and emission light was collected at 480 nm, after mixing for 4 min. The fraction of drug (Xdrug) was varied, keeping constant the total concentration [drug] + [duplex] = 0.9 µM.
Fluorescence titrations of oligonucleotide duplexes with the drugs were performed in a SLM-AMINCO 8100 spectrofluorometer (Spectronic Unicam, Cambridge, UK). The concentration of duplex oligonucleotide was always 8.1 × 10⁻⁹ M. Since melting temperature measurements in 100 mM NH4OAc extrapolated to a concentration of 8.1 nM gave a melting temperature of 35°C, the duplex can reasonably be assumed to be quantitatively formed at room temperature in the solution used for fluorescence titration experiments. The ligand concentration was varied from 0 to 1.1 × 10⁻⁶ M for all drugs. To conform with mass spectrometric conditions, we first tried to perform the titrations in 20% methanol, but this resulted in a very unstable fluorescence signal due to quenching effects. All titrations were therefore carried out at 20°C in an aqueous solution of 100 mM NH4OAc (pH 6.8). The solution was excited at 354 nm and the fluorescence emission was measured at 480 nm for Hoechst 33258, 485 nm for Hoechst 33342 and 450 nm for DAPI (only these three drugs are significantly fluorescent), after mixing for 4 min. Each point is the mean value of four data collections. Background fluorescence intensity from the oligonucleotide solution before the addition of drug was subtracted from each point to provide the corrected fluorescence intensity.
RESULTS
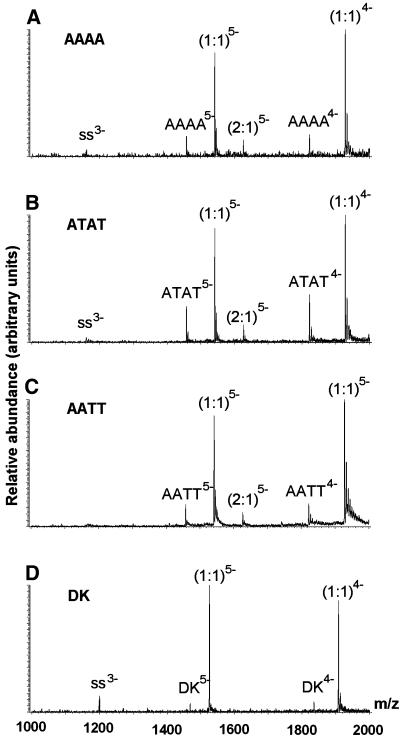
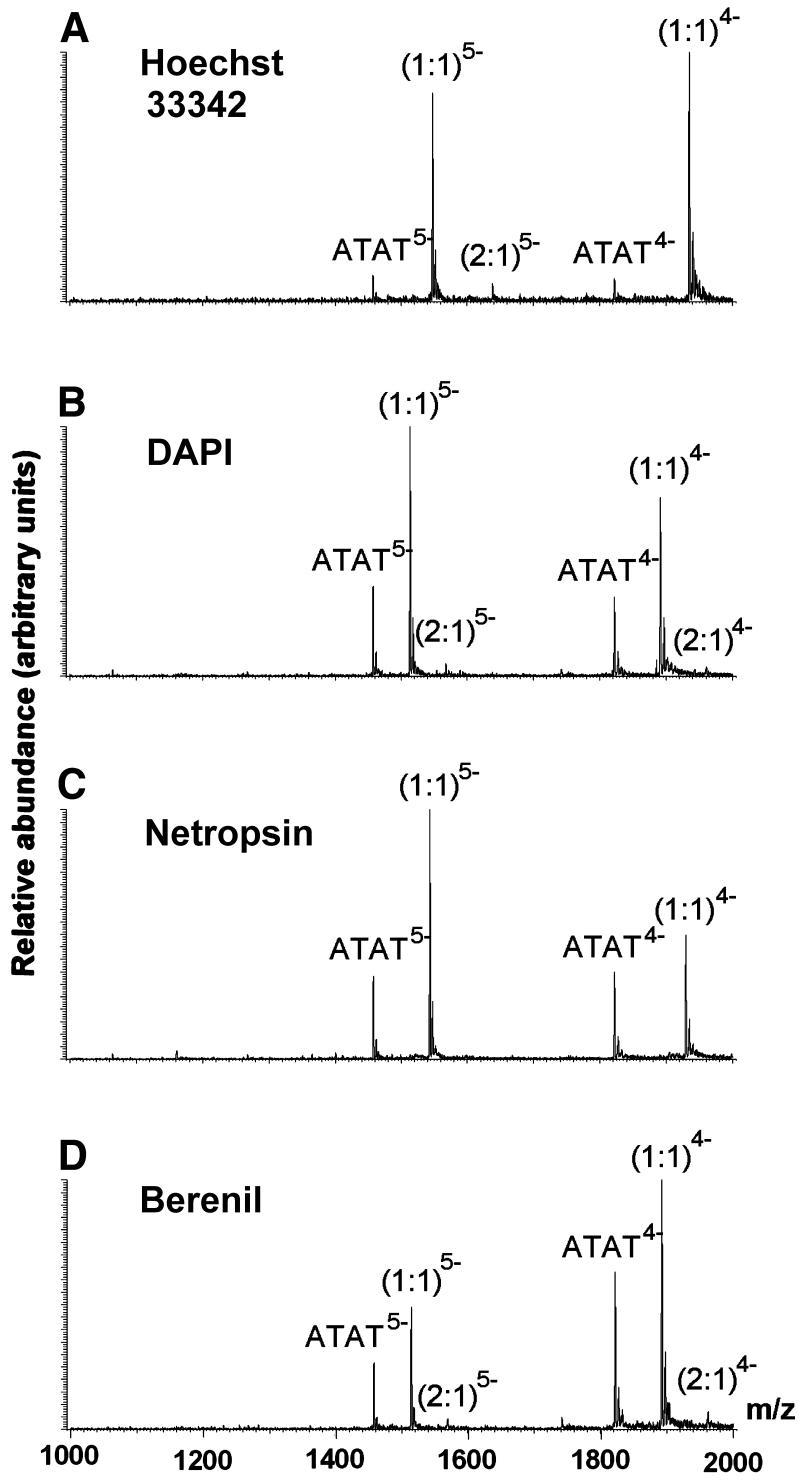
Figure 2 shows the ESI-MS spectra of Hoechst 33258 with the four different duplexes at 10 µM concentration each. There are only some trace amounts of single strands left in the spectra. The ions corresponding to the duplexes and the complexes appear in the spectra with a number of charges, z = 5 and z = 4. For the charge state z = 5, there is a signal corresponding to the free duplex, the 1:1 complex and a small peak corresponding to two drug molecules bound to the duplex (except for duplex DK). For the charge state z = 4, the mass to charge ratio of the 2:1 complex falls beyond the mass range of the instrument (maximum 2000 m/z). The duplex for which the (2:1)5– complex peak is most abundant compared with (1:1)5– is that with the central sequence ATAT. Figure 3 shows the ESI-MS spectra of the equimolar mixtures of ATAT with each of the other four drugs at C0 = 10 µM. Again, the 2:1 complex at the charge state z = 4 can only be seen for DAPI and berenil, as the mass range is limited to m/z = 2000. Regarding stoichiometries, one can immediately see that Hoechst 33342, DAPI and berenil also form 2:1 complexes and that netropsin does not.
Figure 2.
ESI-MS full scan spectra of equimolar mixtures (C0 = 10 µM) of Hoechst 33258 with the four duplexes studied: (A) AAAA, (B) ATAT, (C) AATT and (D) the Dickerson dodecamer (DK). ss, single strands remaining; the complexes are noted with the same conventions as in the text.
Figure 3.
ESI-MS full scan spectra of equimolar mixtures (C0 = 10 µM) of the duplex d(GGGGATATGGGG)·d(CCCCATATCCCC) with four drugs: (A) Hoechst 33342, (B) DAPI, (C) netropsin and (D) berenil.
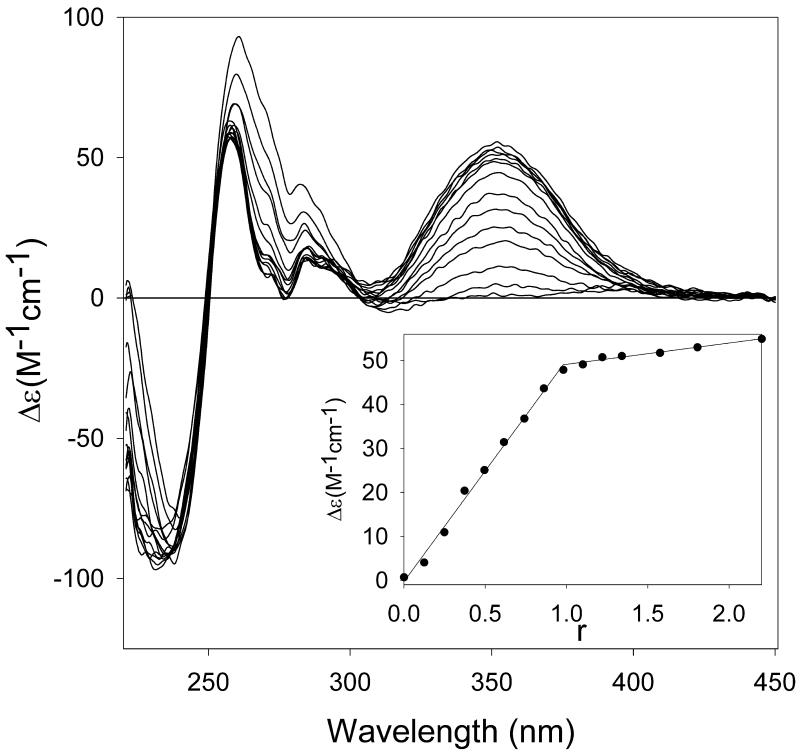
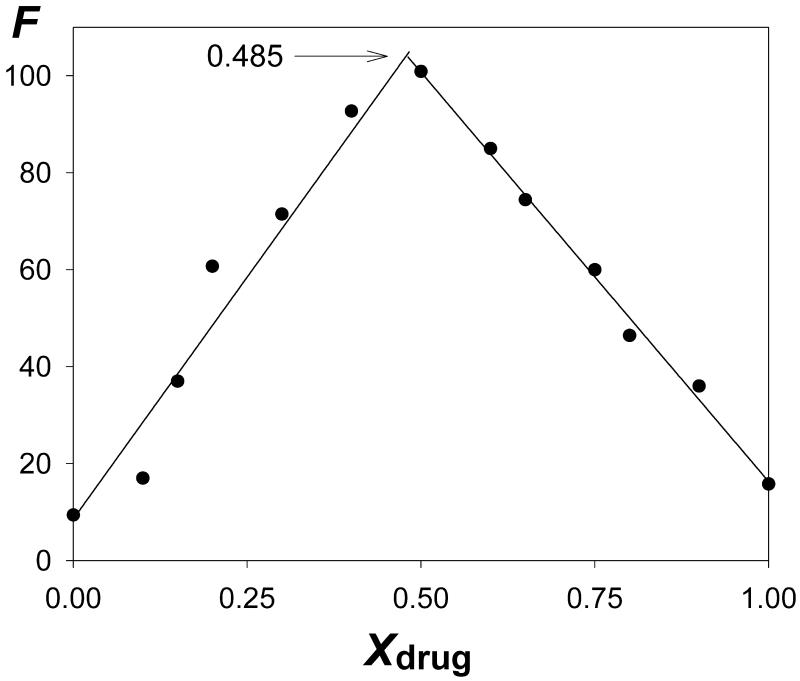
In the particular case of the ATAT + Hoechst 33258 system, which presents the highest proportion of 2:1 complex, we tried to detect by traditional methods the contribution of that species revealed by the mass spectrum. Both the CD titration data (Fig. 4) and the Job continuous variation method with fluorescence data (Fig. 5) indicate only a contribution of the major species in solution (1:1 complex) and a contribution of the 2:1 complex could not be detected.
Figure 4.
Titration of the ATAT duplex with Hoechst 33258 monitored by circular dichroism. The band centered at 355 nm is attributed to the complex with the drug and the change in ellipticity at this wavelength as a function of the drug/duplex fraction r is plotted in the inset. An inflexion point is observed for r = 1 (1:1 complex).
Figure 5.
Job plot for Hoechst 33258 binding to the ATAT duplex. The fluorescence F is measured as a function of the molar fraction of drug (Xdrug). The two straight lines intersect at Xdrug = 0.485, which indicates the presence of a 1:1 complex.
For all the drug + duplex combinations, the equilibrium association constants K1 and K2 (defined as in equations 1 and 2, respectively) are calculated directly from the relative intensities in the mass spectra, as described below.
K1 = [1:1]/([DNA][drug])1
K2 = [2:1]/([1:1][drug])2
where [DNA], [drug], [1:1] and [2:1] are the concentrations of the duplex, the drug, the (DNA + 1 drug) complex and the (DNA + 2 drug) complex at equilibrium, respectively.
It is assumed that the response factors of the duplex and of the complexes are the same. This means that the relative intensities in a spectrum are supposed to be proportional to the relative concentrations in the injected solution (equation 3).
I(DNA)/[DNA] = I(1:1)/[1:1] = I(2:1)/[2:1]3
As the duplex and drug initial concentrations are known ([DNA]0 = [drug]0 = C0), the concentration of all the species at equilibrium can be calculated by equations 4 and 5 (where [j] stands for [DNA], [1:1] or [2:1]),
[j] = C0·I(j)/(I(DNA) + I(1:1) + I(2:1))4
[drug] = C0 – [1:1] – 2[2:1]5
and the resulting values are replaced in equations 1 and 2 to calculate the equilibrium association constants K1 and K2. The constants were determined at three different concentrations, C0 = 2, 4 and 10 µM, and the mean values were calculated. The results are summarized in Table 1. The error resulting from the averaging over 50 spectra is ∼2% and the error resulting from replicate measurements at a given concentration is maximally 10%.
Table 1. Results of the MS determined equilibrium association constants at three different concentrations for all combinations of the five drugs and the four duplexes studied.
| Duplex |
C0 (µM) |
Hoechst 33258 |
Hoechst 33342 |
DAPI |
Netropsin |
Berenil |
|||||
|---|---|---|---|---|---|---|---|---|---|---|---|
| K1 (M–1) | K2 (M–1) | K1 (M–1) | K2 (M–1) | K1 (M–1) | K2 (M–1) | K1 (M–1) | K2 (M–1) | K1 (M–1) | K2 (M–1) | ||
| AAAA | 2 | 1.1 × 10⁷ | 3.6 × 10⁵ | 2.2 × 10⁶ | NDa | 3.4 × 10⁶ | 1.3 × 10⁵ | 4.8 × 10⁶ | NDa | 2.7 × 10⁵ | NQb |
| 4 | 2.1 × 10⁷ | 8.8 × 10⁵ | 1.1 × 10⁷ | NQb | 2.7 × 10⁶ | 8.6 × 10⁴ | 2.5 × 10⁶ | NDa | 1.7 × 10⁵ | 3.6 × 10⁴ | |
| 10 | 5.2 × 10⁶ | 9.0 × 10⁴ | 6.5 × 10⁶ | 7.6 × 10⁴ | 1.8 × 10⁶ | 5.8 × 10⁴ | 1.8 × 10⁶ | NDa | 1.8 × 10⁵ | 1.8 × 10⁴ | |
| 1.2 × 10⁷ | 4.4 × 10⁵ | 6.6 × 10⁶ | 2.6 × 10⁶ | 4.1 × 10⁴ | 3.0 × 10⁶ | 2.1 × 10⁵ | 2.7 × 10⁴ | ||||
| ATAT | 2 | 2.5 × 10⁷ | 7.4 × 10⁵ | 1.8 × 10⁷ | NDa | 3.3 × 10⁶ | 8.7 × 10⁴ | 2.4 × 10⁶ | NDa | 7.6 × 10⁵ | 7.2 × 10⁴ |
| 4 | 4.2 × 10⁷ | 8.9 × 10⁵ | 1.4 × 10⁷ | 2.4 × 10⁵ | 2.4 × 10⁶ | 7.5 × 10⁴ | 1.2 × 10⁶ | NDa | 6.8 × 10⁵ | 4.3 × 10⁴ | |
| 10 | 2.0 × 10⁷ | 7.1 × 10⁵ | 2.1 × 10⁷ | 5.3 × 10⁵ | 2.0 × 10⁶ | 2.6 × 10⁴ | 7.0 × 10⁵ | NDa | 5.3 × 10⁵ | 2.9 × 10⁴ | |
| 2.9 × 10⁷ | 7.8 × 10⁵ | 1.8 × 10⁷ | 3.8 × 10⁵ | 2.6 × 10⁶ | 6.3 × 10⁴ | 1.4 × 10⁶ | 6.6 × 10⁵ | 4.8 × 10⁴ | |||
| AATT | 2 | 8.7 × 10⁷ | 4.6 × 10⁴ | 7.0 × 10⁷ | NDa | 5.4 × 10⁶ | NDa | 4.4 × 10⁶ | NDa | 3.7 × 10⁵ | NDa |
| 4 | 9.7 × 10⁷ | 2.6 × 10⁵ | 6.1 × 10⁷ | NDa | 2.6 × 10⁶ | NDa | 2.2 × 10⁶ | NDa | 2.5 × 10⁵ | NDa | |
| 10 | 8.0 × 10⁷ | 2.0 × 10⁵ | 4.8 × 10⁷ | NDa | 1.4 × 10⁶ | NDa | 1.3 × 10⁶ | NDa | 2.6 × 10⁵ | 3.1 × 10⁴ | |
| 8.8 × 10⁷ | 1.7 × 10⁵ | 6.0 × 10⁷ | 3.0 × 10⁶ | 2.6 × 10⁶ | 2.9 × 10⁵ | ||||||
| DK | 2 | 3.7 × 10⁷ | NDa | 9.7 × 10⁷ | NDa | 4.8 × 10⁶ | NDa | 4.8 × 10⁶ | NDa | 3.4 × 10⁵ | NDa |
| 4 | 2.8 × 10⁷ | NDa | 5.2 × 10⁷ | NDa | 2.7 × 10⁶ | NDa | 2.7 × 10⁶ | NDa | 3.1 × 10⁵ | NDa | |
| 10 | 3.7 × 10⁷ | NDa | 6.9 × 10⁷ | NDa | 1.3 × 10⁶ | NDa | 1.0 × 10⁶ | NDa | 2.6 × 10⁵ | NDa | |
| 3.4 × 10⁷ | 7.3 × 10⁷ | 2.9 × 10⁶ | 2.8 × 10⁶ | 3.0 × 10⁵ | |||||||
The mean values of the measurements at three concentrations are indicated in bold.
aND, not detected (signal-to-noise ratio < 3).
bNQ, not quantified (3 < signal-to-noise ratio < 10).
Netropsin forms no 2:1 complex even at high concentration. No 2:1 complexes are formed by the DK dodecamer duplex with any of the drugs. The values of the constants agree within experimental error for Hoechst 33258 and Hoechst 33342 in the investigated concentration range. For DAPI, netropsin and, to a lesser extent, berenil there is a systematic trend of the MS determined constant to decrease with increasing concentration C0.
To determine the equilibrium association constants in solution by an independent method for comparison with MS determined constants, fluorescence titration experiments were performed for the complexes between Hoechst 33258, Hoechst 33342 and DAPI (the three fluorescent drugs) and the four duplexes. Fluorescence titration data were first fitted by a single site model (equation 6), and the fitting was satisfactory for all complexes.
F = F∞·K1·[drug]·(1/(1 + K1·[drug]))6
Nevertheless, as the presence of 2:1 complex was evidenced by the ESI-MS data, a two-site model of non-identical, non-interacting sites with an equilibrium association constant for the first site K1 much greater than K2 (equation 7) (34) was also tested.
F = F∞·K1·[drug]·(1 + a·K2·[drug])/(1 + K1·[drug] + K1·K2·[drug]2)7
The parameter a represents the relative contribution of the 2:1 and the 1:1 complexes to the total fluorescence of the solution. These approximate equations (the free ligand concentration is assumed to be equal to the total concentration of added ligand) were used to estimate the equilibrium association constants and to make comparisons between drugs and sequences, rather than to determine accurate absolute values. Equation 7 is also the simplest way to obtain relative values for the constant K2 by fluorescence.
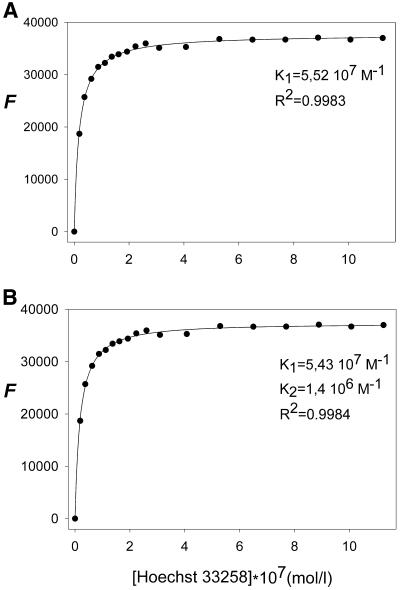
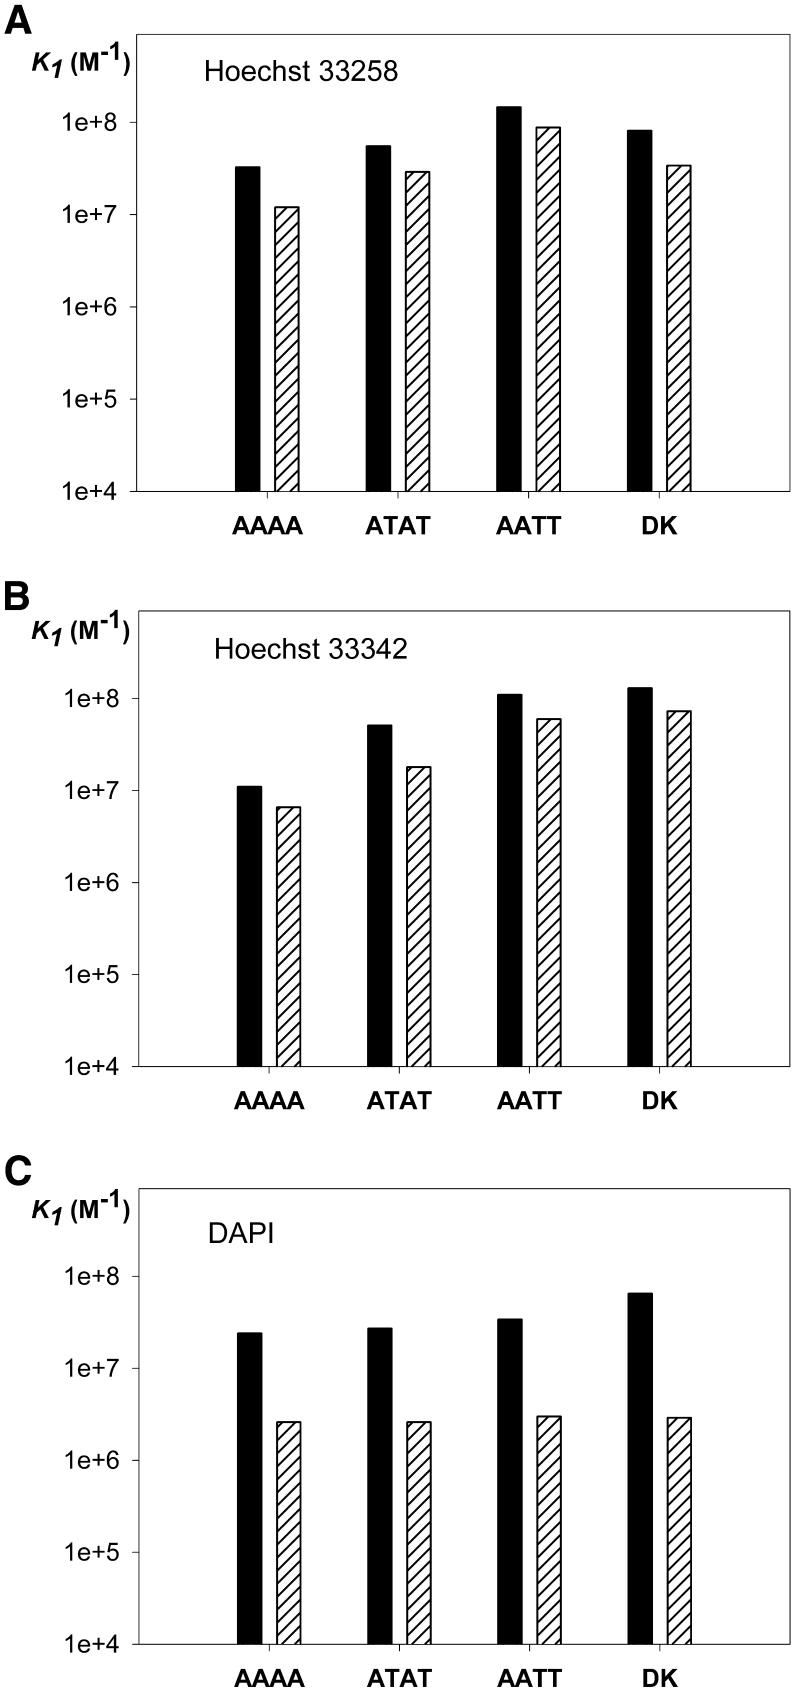
The results obtained for ATAT + Hoechst 33258 are displayed in Figure 6. For all systems studied, the fitting of the curves is equally good with equations 6 and 7. So, from the titration data alone, it is impossible to sort out the contribution of the 2:1 complex. Figure 7 shows a comparison between the constants K1 determined by fluorescence with equation 6 (black bars) and the constants K1 determined by ESI-MS (hatched bars). There is a very nice qualitative agreement between the two methods for the determination of the sequence selectivity, but we also see a systematic deviation to lower values for the constants determined by mass spectrometry.
Figure 6.
Fluorescence titration of the duplex ATAT with Hoechst 33258 (excitation wavelength = 354 nm, fluorescence emission collected at 480 nm). (A) Results of the fitting with equation 6 and (B) results of the fitting with equation 7 (a = 1).
Figure 7.
Comparison between the constants K1 determined by fluorescence titration and fitting of the data with equation 6 (black bars) and the equilibrium association constants K1 determined by electrospray mass spectrometry (hatched bars). Data are shown for each of the fluorescent drugs (A) Hoechst 33258, (B) Hoechst 33342 and (C) DAPI complexed with each of the duplexes.
DISCUSSION
Control of the ESI-MS experimental conditions
Numerous experimental precautions have to be taken to ensure that the species observed in the mass spectra are those and only those present in the injected solution. (i) The low concentrations used (10–5 M or less) prevent the risk of non-specific aggregation during solvent evaporation of the charged droplets (27). Non-specific aggregation would lead to an overestimation of the constants, as the concentration in the evaporating droplets is higher than the concentration in the injected solution. (ii) In the ESI experimental conditions used here, the threshold for observing fragmentation of the duplex and the complexes with five negative charges is not reached (21). It has been shown previously (21) that complexes with minor groove binders can survive harsher conditions than duplexes. This means that too hard conditions would lead to an overestimation of the binding constant (the signal of the complex would be depleted less than the signal of the duplex). It is thought that the small peaks corresponding to (single strands)3– that are sometimes detected arise from the fragmentation of more highly charged species.
A disadvantage of the ESI source of the LCQ is that a poor signal-to-noise ratio is obtained when using a 100% aqueous ammonium acetate solution. We checked by circular dichroism (data not shown) that the B-form double helix structure was not perturbed by the addition of 20% methanol. Other studies by fluorescence microscopy (35) have shown that double-stranded DNA keeps its elongated coil conformation up to methanol fractions of 50%.
Observation of 2:1 complexes
The ESI-MS detection of 1:1 and 2:1 complexes between minor groove binders and 12mer oligonucleotides with a central AT block has already been reported previously (15–17), and is examined in more detail here. In the case of the ATAT + Hoechst 33258 system, neither CD (Fig. 4) nor the Job continuous variation method (Fig. 5) nor fitting of the fluorescence titration curves (Fig. 6) allows the detection of a contribution of species other than the 1:1 complex. Other techniques that can also be used for the determination of the stoichiometry of the complexes include X-ray crystallography (36), NMR (37–39) and SPR (40). Note, however, that with all these techniques a given stoichiometry has to be present in large amounts for its contribution to be detected. The great advantage of mass spectrometry is that all species of different masses can be clearly distinguished, while in other traditional spectroscopic methods only the weighted average contribution of all the species present in solution is measured. Mass spectrometry allows the detection of these multiple stoichiometry complexes, even when the K2 values are up to 100 times lower than the K1 values, and can help in choosing a fitting model for spectroscopic titrations (see Fig. 6).
The tendency of the double-stranded oligonucleotides to form 2:1 complexes (quantified by the ratio K2/K1) is in the order ATAT ≈ AAAA > AATT. The DK dodecamer, however, does not have such an aptitude to form 2:1 complexes. The tendency of the drugs to form 2:1 complexes compared with 1:1 complexes is in the order berenil > Hoechst 33258 > DAPI ≈ Hoechst 33342. Netropsin does not form such 2:1 complexes with any of the DNA studied, even though the experimental conditions were the same. A drug like netropsin, which does not show any 2:1 complex, provides an important control for the specificity of the 2:1 complexes observed with other drug/DNA mixtures.
The detected contribution of a 2:1 binding mode could indicate either an intercalation of the drug in the GC-rich region (41,42) or a minor groove binding mode, similar to that described for benzimidazole derivates of furamidine (39,40). Simple stage ESI-MS spectra do not allow differentiation between these two possible binding modes, but it is hoped that tandem mass spectrometry could be helpful to address that issue. The fact that 2:1 complexes are not formed with the DK dodecamer d(CGCGAATTCGCG)2 suggests that the flanking G/C sequences also have an influence on the formation of this second binding mode. A different conformation could be adopted by the duplexes with the contiguous G-tracks, which could be responsible for the possibility of binding a second drug molecule. The present results emphasize the versatility of ESI-MS for the detection of marginal binding modes, which could be further investigated and tuned in a drug design approach.
Determination of the equilibrium association constants K1 and K2
To determine the equilibrium constants by ESI-MS, we assume that the response factors of the complexes and the duplex are the same (equation 3). The factors that influence the electrospray responses of ionic species are their solvation energy, hydrophobicity and surface activity (31,32). Conse quently, ESI-MS is quite restrictive regarding the systems for which the absolute binding constants can be determined by measuring the relative intensities of the complex and the free substrate (43–45). In the present case, the drug is inserted deeply in the minor groove of the DNA and the double helix conformation of the duplex is not perturbed by the minor groove binding mode (36,46,47). Therefore the duplex and the complexes are likely to have a similar response factor. This system is particularly well suited for determining the constants by ESI-MS, and a relatively good agreement with other thermodynamic methods is expected.
Quantitatively, Figure 7 shows that there is a systematic underestimation of the binding constant by mass spectrometry, compared with the fluorescence titration method. First, the fact that we have an underestimation of the equilibrium association constants by ESI-MS indicates that there is neither non-specific aggregation in the evaporating droplets nor extensive collision-induced dissociation in the source of the spectrometer, because both would lead to an overestimation of the constants (see above). It must also be noted that the binding constant was measured by mass spectrometry in a solution containing 20% methanol, while by fluorescence it was measured in an aqueous ammonium acetate solution. Thus, in any case, we could not expect a perfect agreement when comparing the constants obtained by the two methods.
The determination of the equilibrium association constants from single ESI-MS spectra is of course very quick, but some sources of error may remain undetected. This problem is revealed by the measurements in ESI-MS at different concentrations. We can see in Table 1 that for Hoechst 33258 and Hoechst 33342 the K1 and K2 values are in agreement at all three concentrations, but that for DAPI, netropsin and berenil the apparent constants systematically decrease as the concentration increases. This indicates that the drug concentration is overestimated (and the constants are therefore underestimated), which could be due to adsorption of the drug on the polypropylene tubes. This could explain the order of magnitude difference between fluorescence determined and MS determined constants for DAPI (Fig. 7C). For the drugs Hoechst 33258 and Hoechst 33342 the difference between the constants determined by fluorescence and ESI-MS is only a factor of 2, which can be considered an excellent agreement within the approximations used.
Rapid screening of the sequence selectivity by ESI-MS
Another kind of application for which ESI-MS can be used is the determination of relative binding affinities by comparison of the relative intensities of the peak corresponding to the different complexes. It has already been reported that ESI-MS could assess the preference for GC-rich or AT-rich sequences (19,22). Here we show that the technique is also capable of detecting more subtle sequence-dependent affinity, namely the distinction between the sequences AAAA, ATAT and AATT for minor groove binding. The only assumption is that all DNA–drug complexes in a series have the same response, which is a less severe assumption than assuming the same response for free and complexed DNA, as for the determination of the absolute binding constants. Figure 7 shows that the qualitative agreement between the binding affinities determined by fluorescence titration and mass spectrometry is excellent. Hoechst 33258 and Hoechst 33342 display the largest discrimination between the different AT-rich sequences. The affinity increases in the order AAAA < ATAT < AATT. Moreover, Hoechst 33258 shows a different binding affinity for d(GGGGAATTGGGG)·d(CCCCAATTCCCC) than for d(CGCGAATTCGCG)2, suggesting that the GC base pairs adjacent to the AATT sequence also play a role in binding. DAPI, however, shows no significant sequence dependence of the binding affinity for the studied sequences compared with experimental error, both for ESI-MS and fluorescence. This is in qualitative agreement with DNase I footprinting studies on Hoechst 33258 and DAPI (48). Mass spectrometry of the non-fluorescent drugs (see Table 1) indicates that netropsin shows no significant discrimination between the three different A/T blocks, compared with experimental error, and that berenil has a slight preference for ATAT than for the other sequences.
CONCLUSION
The present paper shows that electrospray mass spectrometry is a powerful and reliable method to determine stoichiometries, relative binding affinities and equilibrium association constants of drug–DNA complexes. ESI-MS combines some of the advantages of DNase I footprinting (independent of the spectral characteristics of the drug) and of fluorescence titration (direct access to thermodynamic equilibrium constants). The major difference between ESI-MS and DNase I footprinting is that the former requires short DNA sequences in order to minimize the number of binding sites, as the exact location of the non-covalently bound drug cannot be assessed by full scan MS measurements. An advantage of ESI-MS is that in addition to binding affinity, the method immediately gives the stoichiometries of the drug–DNA complexes formed (even for minor species). Finally, the method is not limited to duplex DNA. We have recently extended the relative binding affinity measurements to other DNA structures like triple helices and G-quadruplexes. These results will be described in forthcoming papers.
Acknowledgments
ACKNOWLEDGEMENT
V.G. is grateful to the Fonds National de la Recherche Scientifique, Belgium, for a research fellowship.
REFERENCES
- 1.Fenn J.B., Mann,M., Meng,C.K., Wong,S.F. and Whitehouse,C.M. (1989) Electrospray ionization for mass spectrometry. Science, 246, 64–71. [DOI] [PubMed] [Google Scholar]
- 2.Fenn J.B., Mann,M., Meng,C.K. and Wong,S.F. (1990) Electrospray ionization-principles and practice. Mass Spectrom. Rev., 9, 37–70. [Google Scholar]
- 3.Ganem B., Li,Y.-T. and Henion,J.D. (1991) Detection of non-covalent receptor-ligand complexes by mass spectrometry. J. Am. Chem. Soc., 113, 6294–6296. [Google Scholar]
- 4.Smith D.L. and Zhang,Z. (1994) Probing non-covalent structural features of proteins by mass spectrometry. Mass Spectrom. Rev., 13, 411–429. [Google Scholar]
- 5.Smith R.D., Bruce,J.E., Wu,Q. and Lei,Q.P. (1997) New mass spectrometric methods for the study of non-covalent associations of biopolymers. Chem. Soc. Rev., 26, 191–202. [Google Scholar]
- 6.Loo J.A. (1997) Studying non-covalent protein complexes by electrospray ionization mass spectrometry. Mass Spectrom. Rev., 16, 1–23. [DOI] [PubMed] [Google Scholar]
- 7.Loo J.A., Dejohn,D.E., Du,P., Stevenson,T.L. and Ogorzalek Loo,R.R. (1999) Application of mass spectrometry for target identification and characterization. Med. Res. Rev., 19, 307–319. [DOI] [PubMed] [Google Scholar]
- 8.Veenstra T.D. (1999) Electrospray ionization mass spectrometry in the study of biomolecular non-covalent interactions. Biophys. Chem., 79, 63–79. [DOI] [PubMed] [Google Scholar]
- 9.Daniel J.M., Friess,S.D., Rajagopalan,S., Wendt,S. and Zenobi,R. (2002) Quantitative determination of noncovalent binding interactions using soft ionization mass spectrometry. Int. J. Mass Spectrom., 216, 1–27. [Google Scholar]
- 10.Hofstadler S.A. and Griffey,R.H. (2001) Analysis of noncovalent complexes of DNA and RNA by mass spectrometry. Chem. Rev., 101, 377–390. [DOI] [PubMed] [Google Scholar]
- 11.Beck J., Colgrave,M.L., Ralph,S.F. and Sheil,M.M. (2001) Electrospray ionization mass spectrometry of oligonucleotide complexes with drugs, metals and proteins. Mass Spectrom. Rev., 20, 61–87. [DOI] [PubMed] [Google Scholar]
- 12.Hsieh Y.L., Li,Y.-T., Henion,J.D. and Ganem,B. (1994) Studies of non-covalent interactions of actinomycin D with single stranded oligodeoxynucleotides by ion spray mass spectrometry and tandem mass spectrometry. Biol. Mass Spectrom., 23, 272–276. [DOI] [PubMed] [Google Scholar]
- 13.Pocsfalvi G., Di Landa,G., Ferranti,P., Ritieni,A., Randazzo,G. and Marorni,A. (1997) Observation of non-covalent interactions between bauvericin and oligonucleotides using electrospray ionization mass spectrometry. Rapid Commun. Mass Spectrom., 11, 265–272. [DOI] [PubMed] [Google Scholar]
- 14.Gale D.C., Goodlett,D.R., Light-Wahl,K.J. and Smith,R.D. (1994) Observation of duplex DNA-drug non-covalent complexes by electrospray ionization mass spectrometry. J. Am. Chem. Soc., 116, 6027–6028. [Google Scholar]
- 15.Gale D.C. and Smith,R.D. (1995) Characterization of non-covalent complexes formed between minor groove binding molecules and duplex DNA by electrospray ionization mass spectrometry. J. Am. Soc. Mass Spectrom., 6, 1154–1164. [DOI] [PubMed] [Google Scholar]
- 16.Triolo A., Arcamone,F.M., Raffaelli,A. and Salvadori,P. (1997) Non-covalent complexes between DNA-binding drugs and double-stranded deoxyoligonucleotides: a study by ionspray mass spectrometry. J. Mass Spectrom., 32, 1186–1194. [DOI] [PubMed] [Google Scholar]
- 17.Gabelica V., De Pauw,E. and Rosu,F. (1999) Interaction between antitumor drugs and double-stranded DNA studied by electrospray ionization mass spectrometry. J. Mass Spectrom., 32, 1328–1337. [DOI] [PubMed] [Google Scholar]
- 18.Kapur A., Beck,J.L. and Sheil,M.M. (1999) Observation of daunomycin and nogalamycin complexes with duplex DNA using electrospray ionization mass spectrometry. Rapid Commun. Mass Spectrom., 13, 2489–2497. [DOI] [PubMed] [Google Scholar]
- 19.Wan K.X., Shibue,T. and Gross,M.L. (2000) Non-covalent complexes between DNA-binding drugs and double-stranded oligodeoxynucleotides: a study by electrospray ionization mass spectrometry. J. Am. Chem. Soc., 122, 300–307. [Google Scholar]
- 20.Wan K.X., Shibue,T. and Gross,M.L. (2000) Gas-phase stability of double-stranded oligodeoxynucleotide and their noncovalent complexes with DNA-binding drugs is revealed by collisional activation in an ion trap. J. Am. Soc. Mass Spectrom., 11, 450–457. [DOI] [PubMed] [Google Scholar]
- 21.Gabelica V., Rosu,F., Houssier,C. and De Pauw,E. (2000) Gas phase thermal denaturation of an oligonucleotide duplex and its complexes with minor groove binders. Rapid Commun. Mass Spectrom., 14, 464–467. [DOI] [PubMed] [Google Scholar]
- 22.Reyzer M., Brodbelt,J.S., Kerwin,S.M. and Kumar,D. (2002) Evaluation of complexation of metal-mediated DNA-binding drugs to oligonucleotides via electrospray ionization mass spectrometry. Nucleic Acids Res., 29, e103. [DOI] [PMC free article] [PubMed] [Google Scholar]
- 23.Hofstadler S.A., Sannes-Lowery,K.A., Crooke,S.T., Ecker,D.J., Sasmor,H., Manalili,S. and Griffey,R.H. (1999) Multiplexed screening of neutral mass-tagged RNA targets against ligand libraries with electrospray ionization FTICR-MS: a paradigm for high-throughput affinity screening. Anal. Chem., 71, 3436–3440. [DOI] [PubMed] [Google Scholar]
- 24.Griffey R.H., Hofstadler,S.A., Sannes-Lowery,K.A., Ecker,D.J. and Crooke,S.T. (1999) Determinants of aminoglycoside-binding specificity for rRNA by using mass spectrometry. Proc. Natl Acad. Sci. USA, 96, 10129–10133. [DOI] [PMC free article] [PubMed] [Google Scholar]
- 25.Griffey R.H., Sannes-Lowery,K.A., Drader,J.J., Mohan,V., Swayze,E.E. and Hofstadler,S.A. (2000) Characterization of low-affinity complexes between RNA and small molecules using electrospray ionization mass spectrometry. J. Am. Chem. Soc., 122, 9933–9938. [Google Scholar]
- 26.Sannes-Lowery K.A., Griffey,R.H. and Hofstadler,S.A. (2000) Measuring dissociation constants of RNA and aminoglycoside antibiotics by electrospray ionization mass spectrometry. Anal. Biochem., 280, 264–271. [DOI] [PubMed] [Google Scholar]
- 27.Smith R.D. and Light-Wahl,K.J. (1993) The observation of non-covalent interactions in solution by electrospray ionization mass spectrometry: promise, pitfalls and prognosis. Biol. Mass Spectrom., 22, 493–501. [Google Scholar]
- 28.Kebarle P. and Peschke,M. (2000) On the mechanisms by which the charged droplets produced by electrospray lead to gas phase ions. Fresenius J. Anal. Chem., 406, 11–35. [Google Scholar]
- 29.Cole R.B. (2000) Some tenets pertaining to electrospray ionization mass spectrometry. J. Mass Spectrom., 35, 763–772. [DOI] [PubMed] [Google Scholar]
- 30.Kebarle P. (2000) A brief overview of the present status of the mechanisms involved in electrospray mass spectrometry. J. Mass Spectrom., 35, 804–817. [DOI] [PubMed] [Google Scholar]
- 31.Constantopoulos T.L., Jackson,G.S. and Enke,C.G. (2000) Challenges in achieving a fundamental model for ESI. Fresenius J. Anal. Chem., 406, 37–52. [Google Scholar]
- 32.Cech N.B. and Enke,C.G. (2001) Practical implications of some recent studies in electrospray ionization fundamentals. Mass Spectrom. Rev., 20, 362–387. [DOI] [PubMed] [Google Scholar]
- 33.Job P. (1928) Formation and stability of inorganic complexes in solution. Ann. Chim., 9, 113–203. [Google Scholar]
- 34.Eftink M.R. (1997) Fluorescence methods for studying equilibrium macromolecule-ligand interactions. Methods Enzymol., 278, 221–257. [DOI] [PubMed] [Google Scholar]
- 35.Mel’nikov S.M., Khan,M.O., Lindman,B. and Jönsson,B. (1999) Phase behavior of single DNA in mixed solvents. J. Am. Chem. Soc., 1130–1136. [Google Scholar]
- 36.Neidle S. (1997) Crystallographic insights into DNA minor groove recognition by drugs. Biopolymers, 44, 105–121. [Google Scholar]
- 37.Pelton J.G. and Wemmer,D.E. (1989) Structural characterization of a 2:1 distamycin A*d(CGCAAATTGGC) complex by two-dimensional NMR. Proc. Natl Acad. Sci. USA, 86, 5723–5727. [DOI] [PMC free article] [PubMed] [Google Scholar]
- 38.Gavathiotis E., Sharman,G.J. and Searle,M.S. (2000) Sequence-dependent variation in DNA minor groove width dictates orientational preference of Hoechst 33258 in A-tract recognition: solution NMR structure of the 2:1 complex with d(CTTTTGCAAAAG)2. Nucleic Acids Res., 28, 728–735. [DOI] [PMC free article] [PubMed] [Google Scholar]
- 39.Wang L., Bailly,C., Kumar,A., Ding,D., Bajic,M., Boykin,D.W. and Wilson,W.D. (2000) Specific molecular recognition of mixed nucleic acid sequences: an aromatic dication that binds in the DNA mminor groove as a dimer. Proc. Natl Acad. Sci. USA, 97, 12–16. [DOI] [PMC free article] [PubMed] [Google Scholar]
- 40.Bailly C., Tardy,C., Wang,L., Armitage,B., Hopkins,K., Kumar,A., Schuster,G.B., Boykin,D.W. and Wilson,W.D. (2001) Recognition of ATGA sequences by the unfused aromatic dication DB293 forming stacked dimers in the DNA minor groove. Biochemistry, 40, 9770–9779. [DOI] [PubMed] [Google Scholar]
- 41.Bailly C., Colson,P., Hénichard,J.-P. and Houssier,C. (1993) The different binding modes of Hoechst 33258 to DNA studied by electric linear dichroism. Nucleic Acids Res., 16, 3705–3709. [DOI] [PMC free article] [PubMed] [Google Scholar]
- 42.Wilson W.D., Tanious,F.A., Barton,H.J., Jones,R.L., Fox,K., Wydra,R.L. and Strekowski,L. (1990) DNA sequence dependent binding modes of 4′,6-diamino-2-phenylindole (DAPI). Biochemistry, 29, 8452–8461. [DOI] [PubMed] [Google Scholar]
- 43.Leize E., Jaffrezic,A. and Van Dorsselaer,A. (1996) Correlation between solvation energies and electrospray mass spectrometric response factors. Study by electrospray mass spectrometry of supramolecular complexes in thermodynamic equilibrium in solution. J. Mass Spectrom., 31, 537–544. [Google Scholar]
- 44.Blair S.M., Kempen,E.C. and Brodbelt,J.S. (1998) Determination of binding selectivities in host-guest complexation by electrospray/quadrupole ion trap mass spectrometry. J. Am. Soc. Mass Spectrom., 9, 1049–1059. [Google Scholar]
- 45.Jorgensen T.J.D., Roepstorff,P. and Heck,A.J.R. (1998) Direct determination of solution binding constants for noncovalent complexes between bacterial cell wall peptide analogues and vancomycin group antibiotics by electrospray ionization mass spectrometry. Anal. Chem., 70, 4427–4432. [Google Scholar]
- 46.Geierstranger B.H. and Wemmer,D.E. (1995) Complexes of the minor groove of DNA. Annu. Rev. Biomol. Struct., 24, 463–493. [DOI] [PubMed] [Google Scholar]
- 47.Pindur J. and Fischer,G. (1996) DNA complexing minor groove-binding ligands: perspective in antitumour and antimicrobial drug design. Curr. Med. Chem., 3, 379–406. [Google Scholar]
- 48.Abu-Daya A., Brown,P.M. and Fox,K.R. (1995) DNA sequence preferences of several AT-selective minor groove binding ligands. Nucleic Acids Res., 23, 3385–3392. [DOI] [PMC free article] [PubMed] [Google Scholar]


