Abstract
Hybridization kinetics were found to be significantly different for specific and non-specific binding of labeled cRNA to surface-bound oligonucleotides on microarrays. We show direct evidence that in a complex sample specific binding takes longer to reach hybridization equilibrium than the non- specific binding. We find that this property can be used to estimate and to correct for the hybridization contributed by non-specific binding. Useful applications are illustrated including the selection of superior oligonucleotides, and the reduction of false positives in exon identification.
INTRODUCTION
DNA microarrays (1–3) have become increasingly popular for biology research and medical applications involving genome and transcriptome analysis, including identification of polymorphisms (4), classification of cancer subtypes (5–7), functional genomics (8) and genome annotation (9).
Microarrays utilize the fundamental property of nucleotide sequences binding (hybridizing) to their complements. One of the most significant problems relating to microarray assays is the control and/or estimation of non-specific binding to the reporter oligonucleotides (oligos). By non-specific binding we imply the lower affinity mismatched duplexes involving sequences other than the intended target; they also often are referred to as cross-hybridizations. A system with severe cross-hybridization will generally have reduced ability to detect low abundance sequence species and to discriminate closely related species. Other gene expression technology platforms (3) spend half of their microarray real estate on mismatch control oligos to address this issue, with only partial mitigation of the problem.
Here we present an empirical method for estimating non-specific hybridization which relies on the kinetics of oligo binding. We also illustrate how the estimate can be used to subtract unwanted contributions due to non-specific hybridization in two practical applications of microarray measurements for gene expression.
Hybridization kinetics and thermodynamics have been studied both theoretically (10,11) and experimentally (12,13) for oligos in solution, for gel-bound oligos (14), and for surface bound oligos (15). These studies indicate general trends of the hybridization process such as the on (binding) and off (dissociation) rate dependence on oligo length, temperature and salt concentration. Other studies (16–18) also show that the dissociation rate for non-specific binding is higher than that of specific binding due to the difference in binding energy that must be overcome. The hybridization rates for surface (membrane) bound cDNA binding to free oligos have been quantified (19). Their results, for a simple pure sample, show primarily a dependence of equilibrium intensity on mismatch. Some evidence that perfect match sequences require less time to reach their intensity plateau than do the mismatches is also presented. The experimental results of our paper, dealing with complex samples, exhibit opposite temporal behavior: surface-bound oligos hybridizing primarily with their perfect complement sequences tend to equilibrate more slowly than do those whose binding is dominated by mismatch duplexes.
The focus of previous research generally has not been on surface bound oligos, and there has not been specific mention of utilizing the characteristics of approach to equilibrium to alleviate unwanted cross-hybridization.
All experiments described in the present study were performed using 60 base oligos on inkjet in situ synthesized oligo arrays (20). This length has been shown to provide a good compromise between sensitivity and specificity (21).
MATERIALS AND METHODS
Dye-labeled synthetic RNA and cRNA were hybridized to the inkjet printed oligo microarrays. Please refer to the experimental protocols by Hughes et al. (21) for microarrays, oligo selections, cell culture, RNA isolation, synthetic RNAs, mRNA reverse transcription and amplification by the in vitro transcription (IVT) protocol, and sample labeling, hybridization, scanning and image analysis.
Random primed IVT
The retinoblastoma (Rb) tiling experiments were performed as follows: 200 ng of poly A+ selected mRNA from the Jurkat cell line (ATCC, Rockville, MD) was amplified by the IVT protocol previously described by Hughes et al. (8,21). In order to achieve random priming of the RT reaction, the oligo dT primer was substituted with T7-dN9 [5′-AAT TAA TAC GAC TCA CTA TAG GGA GAT NNN NNN NNN-3′ (N = A, T, C or G)]. After in vitro transcription, aminoallyl derivatized cRNA was coupled to N-hydroxy succinamide esters of Cy3 or Cy5 dye.
RESULTS
Qualitative model of approach to equilibrium
A simple physics model based on differences in dissociation rates is presented here to motivate the method, and is in qualitative agreement with the observed kinetic characteristics of specific and non-specific binding shown below. Throughout this paper we will refer to the single-stranded DNA sequences (60 bp long) attached to the surface as oligos and free cRNA/DNA molecules in the solution as RNA/DNA samples. We assume the system of oligos and samples obeying:
Here R, L and C are the number of oligos available for hybridization, the (molar) concentration of free RNA samples, and the number of bound complexes, respectively. kf and kr denote the forward (M–1 time–1) and reverse (time–1) rates. The solution to this model under the assumption that initially at t = 0 nothing was bound to the oligos, and in the limiting cases of (i) free RNAs in excess with respect to bound complexes, i.e. L0 >> C / NAvV, where V is volume, NAv is Avogadro’s number, is given by (22):
and (ii) number of oligos in excess with respect to the bound complexes, i.e. RT >> C, by:
Here RT is the total number of oligos, L0 is the total concentration of free RNAs, and KD = kr / kf is an equilibrium dissociation constant that decreases when free RNAs bind to oligos more strongly. Variable τ denotes a characteristic time over which the system reaches equilibrium.
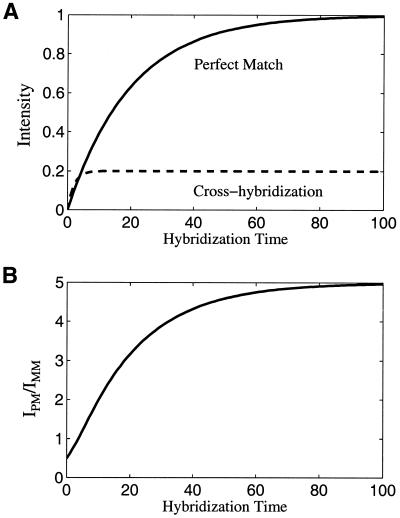
Previous studies show that the forward rate kf is the same for perfect matches and for cross-hybridizations (14,16,17), and the difference is only in the reverse rate kr. We denote the perfect matches by index 1 and mismatches by index 2. In this case, kr1 << kr2, indicating that the perfect matches bind tighter than cross-hybridizations (16,18). One can show that in either of the limiting cases represented by equations 1 and 2 the equilibrium time τ is longer for perfect matches than for mismatches. Take case (ii) as an example: RT and kf are the same for perfect matches and mismatches, KD is proportional to kr which is bigger for mismatches, therefore τ1 is bigger than τ2. For case (i): L0 also contributes to the time scale τ, and in a complex sample, the free RNAs for mismatches are much more abundant than those for perfect matches, which makes τ2 even smaller. The temporal behavior of both perfectly bound oligos and the cross-hybridization is shown diagrammatically in Figure 1A. The ratio of these two curves is plotted in Figure 1B.
Figure 1.
Simple illustrative theoretical model for perfect match hybridization and cross-hybridization kinetics. (A) Intensity of perfect match and cross-hybridization versus hybridization time. (B) The ratio of perfect match intensity to the cross-hybridization intensity as a function of time. These plots are intended for describing the qualitative trend, not for the quantitative predictions.
Figure 1 demonstrates why at longer times of hybridization when the system approaches equilibrium the specificity, i.e. the ratio of the perfect match to the cross-hybridization, increases and finally saturates.
Experimental evidence
A microarray was designed specifically to study the kinetics of perfect match and mismatch duplexes. It consisted of many perfect and mismatch oligos generated from two synthetic mRNA sequences (21). For each synthetic sequence included in the hybridization sample, two types of mismatches were studied: mutation and deletion. For each mismatch type, the number of altered bases ranged from 0 to 20. For a selected number of mismatches of a given mismatch type, 110 oligos with random mismatch positions were designed, except for the one base mismatch case where only 60 oligos were designed. For the zero base mismatch (perfect match), the same oligo was repeated 110 times on the microarray.
Synthetic mRNAs (21) referred to as ‘A’ and ‘B’ were labeled with Cy3 and Cy5, respectively. In order to study their behavior in complex samples, the mixture of the synthetic mRNAs was added to a pre-labeled mixture of cRNA derived from Jurkat and K562 cell lines. The Cy3- and Cy5-labeled samples were hybridized to the microarrays for different lengths of time (1, 4, 24, 48 and 72 h). These hybridizations were carried out in separate containers independently using identically produced microarrays and RNA samples, and the parameters were nominally the same except the duration. The hybridization levels were inferred from fluorescent intensities as measured by a confocal laser scanner.
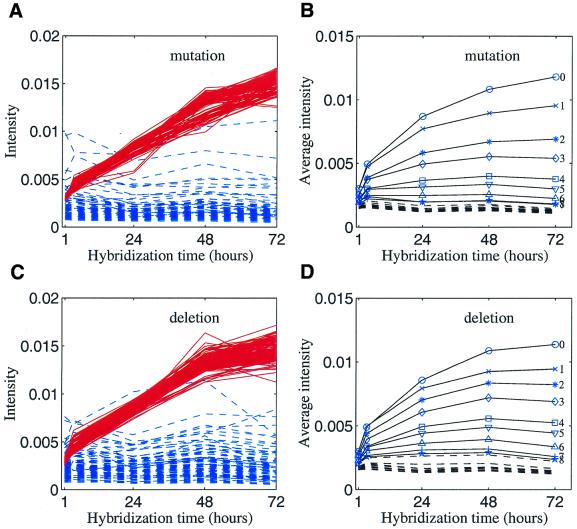
The intensity versus hybridization time for individual oligos complementary to synthetic mRNA ‘A’ is displayed in Figure 2A and C for cases of mutations and deletions. In order to best illustrate the important trend, two representative groups are plotted: perfect match oligos representing the specific group, and oligos with 10 base mismatches representing the non-specific group. It is clear that the time dependencies of those two groups are significantly different.
Figure 2.
(A) Intensity versus hybridization time for each individual microarray spot. Red, oligos with perfect match. Blue, oligos with 10 base mutations. (B) Average intensity versus hybridization time. The intensity for a given number of mutations was averaged over 110 oligos (or 60 oligos for one base mutation) and averaged again over two synthetic mRNAs. The number at the end of each curve represents the number of mutations. Numbers greater than eight are not indicated in the plot since they overlap at the bottom of the figure. (C) Same as (A), except for deletions. (D) Same as (B), except for deletions.
The average intensity for each number of mutations, averaged again over two synthetic mRNAs, is plotted in Figure 2B. Figure 2D shows similar curves for deletions. The kinetics curves for the mutations and deletions are largely similar to each other. The above results lead to the following three conclusions. (i) The differences between two intensities measured at the long and short hybridization times are bigger for more specific oligos. In other words, the intensity gain over the time courses is likely to be specific. (ii) For oligos with six or more base mismatches, the intensities do not change significantly after 4 h of hybridization. This suggests that they reached equilibrium (disassociation rate equals the binding rate) within 4 h. (iii) For oligos with fewer base mismatches (less than five), the intensities take a longer time (24 h or more) to reach equilibrium.
Sample mobility affects equilibrium time
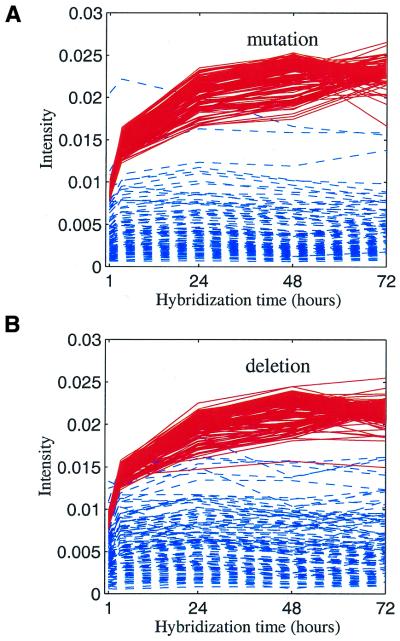
Although the experimental results are qualitatively in agreement with the simple physical model, we observed that equilibrium time also depends on sample mobility. To show the effect, the above experiment was repeated with the modification that the synthetic mRNAs were fragmented by ZnCl2 to an average size of 50∼100 bases long, which tends to increase their mobility. The sequence length for synthetic mRNA ‘A’ before fragmentation is 533 bases. Figure 3 shows the hybridization intensity for the synthetic mRNA ‘A’ oligos as a function of the hybridization time for perfect match and 10 base mismatch oligos. One difference is noticeable by comparing these two plots with Figure 2A and C: the perfect match oligos with the fragmented sample do not gain much intensity after 24 h, whereas the perfect match oligos in the unfragmented sample gain substantial intensity even after 48 h. Therefore, fragmenting the sample effectively reduces the time required to reach hybridization equilibrium.
Figure 3.
The fragmented sample. (A) Intensity versus hybridization time for each individual microarray spot. Red, oligos with perfect match. Blue, oligos with 10 base mutations. (B) Same as (A), except for deletions.
Verification in complex samples
Previous examples are still different from a ‘typical’ microarray experiment since the specific samples are synthetic and amplified separately, and the same oligo sequences are represented by hundreds of spots on the same array. Here we present a case where the cRNA sample is from a human cell culture, having a ‘natural’ complex abundance distribution, and each target sequence is only represented by one oligo spot on the microarray. In this study, the microarray contains 4005 oligos designed to be complementary to GenBank mRNA sequences, and 13 461 oligos from expressed sequence tag (EST) sequences (one oligo per mRNA or EST sequence). The rest of the oligos are used for control purposes. This microarray was designed to examine the utility of the EST sequences; oligos were derived directly complementary to the sequence in the public database. Subsequent analysis (data not shown) confirmed that ∼90% of the EST sequences had incorrect orientation indicated in GenBank, making the EST oligos highly depleted for specific hybridization signal as compared with the mRNA oligos on the microarray. The biological samples were mRNA from the Jurkat and K562 cell lines. These mRNAs were converted to single-strand cRNA by IVT and labeled with Cy3 or Cy5 dyes (21). The samples were fragmented before hybridization. The hybridization levels were measured at hybridization times of 4, 16, 24 and 48 h. These hybridizations were carried out in separate containers independently using identically produced microarrays and RNA samples, and the parameters were nominally the same except the duration.
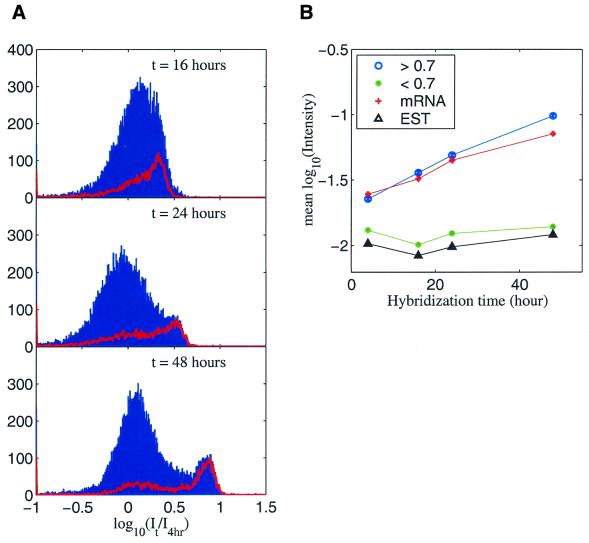
Figure 4A shows the histograms of intensity in the Jurkat channel over all oligos, normalized to the intensity at 4 h. The histograms of intensity for the mRNA oligos are represented by the red curves in these plots. In order, from top to bottom (16 to 24 and to 48 h), one can see that the mRNA oligos steadily gained intensities with time and gradually separated out from the intensities representing the rest of the oligos. The mRNA oligos were synthesized in the correct orientation with respect to the cognate cRNA sample and hence represent the specific oligos. If we make a cut and select those oligos with log10(intensity for 48 h/intensity for 4 h) > 0.7, there are a total of 2309 oligos which pass the threshold, out of which 1825 are mRNA oligos. Given the fact that mRNA spots constitute only ∼20% of total spots on the microarray, and nearly 80% of spots >0.7 are mRNAs, the data in Figure 4 validate the difference in kinetic properties between specific and non-specific binding.
Figure 4.
(A) Histogram of intensity ratios. Top, 16–4 h; middle, 24–4 h; bottom, 48–4 h. Red lines are the histograms for mRNA oligos only. (B) Mean log10(intensity) as a function of hybridization time. The ‘<0.7’ and ‘>0.7’ groups are divided according to log10(intensity for 48 h/intensity for 4 h).
By making this division at 0.7 on the bottom panel horizontal axis of Figure 4A, two groups are defined. The trend of the intensities can be viewed from Figure 4B. In the case where the sample is fragmented and each sequence (gene) is represented only once on the microarray, the equilibrium time is clearly different for the specific and the non-specific group. The ‘specific’ group did not reach equilibrium even at 48 h, whereas the other group reached equilibrium within 4 h. For comparison, the average intensities of mRNA-derived oligos and EST-derived oligos are also plotted in the same figure. This example demonstrates that the kinetics parameters can be well defined and clearly separated for the two groups of oligos under a ‘typical’ hybridization condition.
Applications of hybridization kinetics
Careful control of non-specific hybridization is important in many cases; here we provide two direct applications.
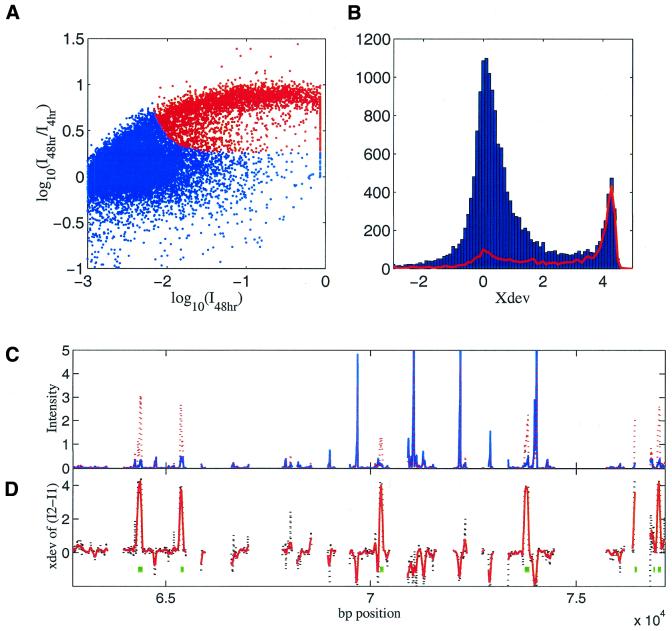
Screening oligos and identifying expressed genes. Kinetics can be used to screen oligos and select expressed genes. An oligo will fail to detect a significant specific signal if either of the following is true: oligo is not specific; the gene complementary to the oligo is not expressed. Figure 5A plots the ratio of intensities (48 h over 4 h) versus the intensities from the 48 h hybridization (same data set as in Figure 4). The oligos have a bimodal distribution along the y-axis. Oligos with log(ratio) ∼1 are the ones detecting specific signals, whereas the oligos with log(ratio) ∼0 are dominated by non-specific signals. A simple classification by the ratio of intensity would largely separate the specific from the non-specific bindings as illustrated by the histograms in Figure 4A. The problem that the ratio is not well defined when the intensities are low can be dealt with by defining a quantity:
Figure 5.
(A) Log intensity ratio (48 h hybridization/4 h hybridization) versus log intensity of 48 h hybridization for the jurkat sample. Spots in red are the ones with xdev > 2. The data were normalized to the scanner maximum dynamic range. Spots near the log intensity of 0 saturated the scanner. (B) Histogram of xdev (for time points at 4 and 48 h). Red line is the histogram for mRNA oligos only. (C) Hybridization intensity for Rb gene in the genomic region from 63 to 77 kb. Blue, intensity from 4 h hybridization. Red, intensity from 72 h hybridization. (D) xdev of 72 h intensity minus 4 h intensity. Black, xdev of each individual oligo. Red, running average of xdev of seven neighboring oligos. Green blocks are the known expressed exons.
where I2 and I1 are intensities at two hybridization times for each oligo and σ2 and σ1 are the corresponding expected uncertainties. Figure 5B shows the histogram of xdev between 48 and 4 h. One can see that the separation is better when compared with Figure 4A, bottom, where the histogram of intensity ratios is plotted. The red spots in Figure 5A are the spots with xdev > 2 and can be regarded as oligos detecting specific signals.
We have demonstrated how to select the most specific oligos by their kinetic behavior. Estimating the non-specific binding strength of all oligos in a hybridization could also be achieved by using the short hybridization time corresponding to the cross-hybridization equilibrium.
Exon identification. Only a few percent of the genomic sequences are actually transcribed into mRNAs (23). Experimentally identifying these mRNA sequences is a very important step for genome sequence annotation (9). Changes of hybridization signals during the approach to equilibrium can be used to enhance the identification of exons using microarray technology. Oligos for short overlapping segments of a genomic sequence region were selected and synthesized onto a microarray. mRNA samples were converted to cRNA and hybridized to the microarray to determine which parts of the genomic region were actually part of the mature mRNA structure. In this experiment, oligos complementary to the human Rb gene (24) region were selected. The Rb gene structure is well studied (25,26) and hence it is chosen to validate the hybridization technique for annotating the genome. The oligos passing a repetitive sequence filter were printed by an inkjet writer at eight base separation over the 180 kb genomic region. cRNA samples were prepared by a random primed IVT protocol to generate transcripts covering the entire length of the gene (see Materials and Methods). Fluorescently labeled cRNA was prepared from Jurkat mRNA (labeled with Cy3) and K562 mRNA (labeled with Cy5). These labeled cRNA samples were competitively hybridized to one microarray for 4 h and to another for 72 h.
Figure 5C and D shows an example of a tiling region from ∼63 to 77 kb. In Figure 5C, two intensity curves are displayed, one for 4 h hybridization and one for 72 h hybridization. Figure 5D shows the xdev between those two intensities for each oligo. The known exons are also indicated by the squares near y = –1. Also shown in Figure 5D is the running average of xdev from seven overlapping oligos (a low pass filter filtered xdev).
There are seven known exons in this particular region shown in Figure 5D. The intensity plot shows there are at least four to six bright intensity peaks in this region that could misidentify exons. However, the derived ‘xdev’ peaks at each known exon position and effectively eliminates the false positives due to cross-hybridizations. The filtered ‘xdev’ shows no false positives in this region and missed one very narrow exon out of seven if we set a threshold of xdev = 2.
Other applications. We have shown the use of kinetics in estimating cross-hybridization, screening oligos and expressed genes, and improving expression data quality. We note that it also could be used to check the orientation of target sequences such as ESTs, as a diagnostic for RNA sample quality, and a general indicator of the quality of a microarray experiment.
Multiple hybridizations on the same microarray. One of the practical problems associated with multiple hybridization time points is the requirement of the number of microarrays and the amount of RNA sample needed to complete a kinetics time course. Ideally, a labeled sample pair hybridized to a single microarray could be used to generate all of the hybridization kinetics data. Using a single microarray for collecting data from all hybridization time points has the added benefit of minimizing any inter-array variability that might exist when multiple microarrays are used.
To examine the feasibility of using a single microarray with a labeled sample pair from a single experiment, we hybridized a human 25K microarray with Cy3- and Cy5-labeled Jurkat and K562 cRNA. The microarray was hybridized for 4 h after which time it was removed from the hybridization solution, washed and scanned. During the washing and scanning of the microarray, the hybridization solution was stored at the hybridization temperature. After scanning, the slide was put back into the hybridization solution and left to hybridize for an additional 68 h (72 h total hybridization time). For comparison, one pair of control slides was hybridized with the Jurkat/K562 labeled cRNA, one for 4 h and another for 72 h.
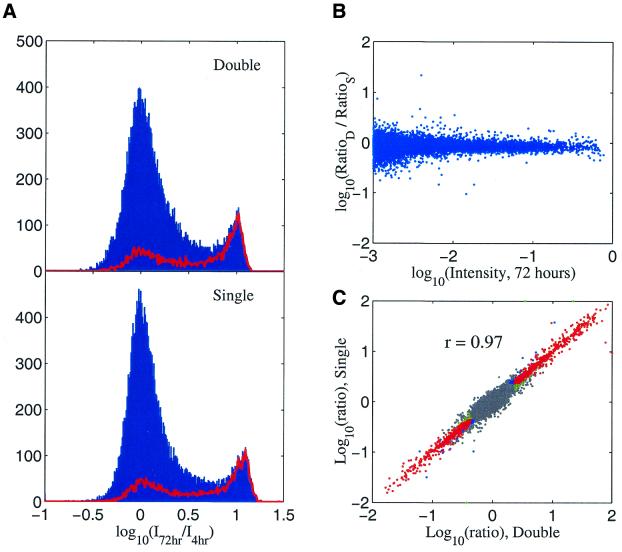
The hybridization kinetics observed for the specific and non-specific oligos on the microarray with multiple hybridization time points are identical to the kinetics seen for the control slides (Fig. 6A and B). Figure 6A shows the histograms for those two cases are very similar: we were able to see two peaks from either case and the mRNA-derived oligos behave as expected. Figure 6B shows the ratio (double hybridizations over control case) of the kinetics ratios (defined as Figures 4A and 6A) for each oligo. The spread is typically 0.1 or less in log scale, which indicates the two ratios in Figure 6A are very similar. Figure 6C further compares the conventional two-color ratio (Jurkat/K562) for 72 h hybridizations; again, the microarray that went through double hybridizations correlates with the single hybridization control case with a correlation coefficient of 0.97 in the log(ratio).
Figure 6.
Comparison of hybridization results of repeat hybridizations versus single hybridization per microarray. Double, a single microarray hybridized and scanned at 4 h and put back for another 68 h hybridization and scanned again. Single, each array only hybridized and scanned once, two arrays involved for two time points. (A) Histograms of log10(intensity for 72 h/intensity for 4 h). Red lines, histograms for mRNA oligos. (B) The ratio of ratios defined in (A) versus oligo intensity at 72 h. RatioD, intensity ratio for the case of double; RatioS, intensity ratio for the case of single. (C) The two-color ratio (Jurkat/K562) for the double hybridizations versus the single hybridization (72 h).
In summary, the multiple time point kinetics experiments can be performed on a single slide, with a single sample, without compromising the results.
DISCUSSION
All the above examples show that the kinetics properties of specific binding are quite different than for non-specific binding. The specific binding takes longer to reach equilibrium. However, the exact time scale depends on several factors: disassociation rate as discussed at the beginning of the paper, the mobility of the sample, and the average travel distance (or the chance probability) for a sample to find the perfect binding sites. The difference in time scale between Figure 2 (non-fragmented) and Figure 3 (fragmented) shows the effect of mobility. The difference between Figure 3 (fragmented synthetic RNA, with many repeating oligos on the array) and Figure 4 (fragmented complex sample, with only one oligo spot per gene on the array) is probably due to the effect of travel distance, which is generally less when there are many copies of a given oligo distributed over the array.
Since specific hybridization takes a longer time to reach equilibrium, increasing hybridization time will generally increase the specificity of hybridization; the intensity gain over the time course can be used to screen specific oligos from non-specific ones. The two examples in ‘Applications of hybridization kinetics’ support the above claims. In cases where binding sites are not a limiting factor of the hybridization, short hybridization time can be used to estimate the strength of cross-hybridization for each oligo.
Acknowledgments
ACKNOWLEDGEMENTS
We thank Dr Yudong He for his critical review of the manuscript, Dr Doug Bradley for his numerous suggestions, Dr Allan Jones for the synthetic mRNAs, Colleen Davis for her expert technical assistance, and Noel Balantac for performing some of the microarray hybridization experiments.
REFERENCES
- 1.Schena M., Shalon,D., Davis,R.W. and Brown,P.O. (1995) Quantitative monitoring of gene expression patterns with a complementary DNA microarray. Science, 270, 467–470. [DOI] [PubMed] [Google Scholar]
- 2.Lockhart D.J., Dong,H., Byrne,M.C., Follettie,M.T., Gallo,M.V., Chee,M.S., Mittmann,M., Wang,C., Kobayashi,M., Horton,H. and Brown,E.L. (1996) Expression monitoring by hybridization to high-density oligo arrays. Nat. Biotechnol., 14, 1675–1680. [DOI] [PubMed] [Google Scholar]
- 3.Lipshutz R.J., Fodor,S.P., Gingeras,T.R. and Lockhart,D.J. (1999) High density synthetic oligo arrays. Nature Genet., 21, 20–24. [DOI] [PubMed] [Google Scholar]
- 4.Wilson J.W., Bean,P., Robins,T., Graziano,F. and Persing,D.H. (2000) Comparative evaluation of three human immunodeficiency virus genotyping systems: the HIV-GenotypR method, the HIV PRT GeneChip assay and the HIV-1 RT line oligo assay. J. Clin. Microbiol., 38, 3022–3028. [DOI] [PMC free article] [PubMed] [Google Scholar]
- 5.Khan J., Wei,J.S., Ringner,M., Saal,L.H., Ladanyi,M., Westermann,F., Berthold,F., Schwab,M., Antonescu,C.R., Peterson,C. and Meltzer,P.S. (2001) Classification and diagnostic prediction of cancers using gene expression profiling and artificial neural networks. Nature Med., 7, 777–888. [DOI] [PMC free article] [PubMed] [Google Scholar]
- 6.Golub T.R., Slonim,D.K., Tamayo,P., Huard,C., Gaasenbeek,M., Mesirov,J.P., Coller,H., Loh,M.L., Downing,J.R., Caligiuri,M.A., Bloomfield,C.D. and Lander,E.S. (1999) Molecular classification of cancer: class discovery and class prediction by gene expression monitoring. Science, 286, 531–537. [DOI] [PubMed] [Google Scholar]
- 7.Alizadeh A.A., Eisen,M.B., Davis,R.E., Ma,C., Lossos,I.S., Rosenwald,A., Boldrick,J.C., Sabet,H., Tran,T., Yu,X. et al. (2000) Distinct types of diffuse large B-cell lymphoma identified by gene expression profiling. Nature, 403, 503–511. [DOI] [PubMed] [Google Scholar]
- 8.Hughes T.R., Marton,M.J., Jones,A.R., Roberts,C.J., Stoughton,R., Armour,C.D., Bennett,H.A., Coffey,E., Dai,H., He,Y.D., Kidd,M.J., King,A.M., Meyer,M.R., Slade,D., Lum,P.Y., Stepaniants,S.B., Shoemaker,D.D., Gachotte,D., Chakraburtty,K., Simon,J., Bard,M. and Friend,S.H. (2000) Functional discovery via a compendium of expression profiles. Cell, 102, 109–126. [DOI] [PubMed] [Google Scholar]
- 9.Shoemaker D.D., Schadt,E.E., Armour,C.D., He,Y.D., Garrett-Engele,P., McDonagh,P.D., Loerch,P.M., Leonardson,A., Lum,P.Y., Cavet,G., Wu,L.F., Altschuler,S.J., Edwards,S., King,J., Tsang,J.S., Schimmack,G., Schelter,J.M., Koch,J., Ziman,M., Marton,M.J., Li,B., Cundiff,P., Ward,T., Castle,J., Krolewski,M., Meyer,M.R., Mao,M., Burchard,J., Kidd,M.J., Dai,H., Phillips,J.W., Linsley,P.S., Stoughton,R., Scherer,S. and Boguski,M.S. (2001) Experimental annotation of the human genome using microarray technology. Nature, 409, 922–927. [DOI] [PubMed] [Google Scholar]
- 10.Frank-Kamenetskii M.D. (1997) Biophysics of DNA molecule. Phys. Rep., 288, 13–60. [Google Scholar]
- 11.Anshelevich V.V., Vologodskii,A.V., Lukashin,A.V. and Frank-Kamenetskii,M.D. (1984) Slow relaxational processes in the melting of linear biopolymers: a theory and its application to nucleic acids. Biopolymers, 23, 39–58. [DOI] [PubMed] [Google Scholar]
- 12.Wetmur J.G. and Davidson,M. (1968) Kinetics of renaturation of DNA. J. Mol. Biol., 31, 349–370. [DOI] [PubMed] [Google Scholar]
- 13.Nelson J.W. and Tinoco,I.,Jr (1982) Comparison of the kinetics of ribooligonucleotide, deoxyribooligonucleotide, and hybrid oligonucleotide double-strand formation by temperature jump kinetics. Biochemistry, 21, 5289–5295. [DOI] [PubMed] [Google Scholar]
- 14.Livshits M.A. and Mirzabekov,A.D. (1996) Theoretical analysis of the kinetics of DNA hybridization with gel-immobilized oligos. Biophys. J., 71, 2795–2801. [DOI] [PMC free article] [PubMed] [Google Scholar]
- 15.Persson B., Stenhag,K., Nilsson,P., Larsson,A., Uhlen,M. and Nygren,P. (1997) Analysis of oligo affinities using surface plasmon resonance: a means for mutational scanning. Anal. Biochem., 246, 34–44. [DOI] [PubMed] [Google Scholar]
- 16.Wang S., Friedman,A.E. and Kool,E.T. (1995) Origins of high sequence selectivity: a stopped-flow kinetics study of DNA/RNA hybridization by duplex- and triplex-forming oligos. Biochemistry, 34, 9774–9784. [DOI] [PubMed] [Google Scholar]
- 17.Tibanyenda N., De Bruin,S.H., Haasnoot,C.A., van der Marel,G.A., van Boom,J.H. and Hilbers,C.W. (1984) The effect of single base-pair mismatches on the duplex stability of d(T-A-T-T-A-A-T-A-T-C-A-A-G-T-T-G).d(C-A-A-C-T-T-G-A-T-A-T-T_A-A-T-A). Eur. J. Biochem., 139, 19–27. [DOI] [PubMed] [Google Scholar]
- 18.Ikuta S., Takagi,K., Wallace,R.B. and Itakura,K. (1987) Dissociation kinetics of 19 base paired oligo-DNA duplexes containing different single mismatched base pairs. Nucleic Acids Res., 15, 797–811. [DOI] [PMC free article] [PubMed] [Google Scholar]
- 19.Vernier P., Matrippolito,R., Helin,C., Bendali,M., Mallet,J. and Tricoire,H. (1996) Radioimager quantification of oligo hybridization with DNA immobilized on transfer membrane: application to the identification of related sequences. Anal. Biochem., 235, 11–19. [DOI] [PubMed] [Google Scholar]
- 20.Blanchard A.P., Kaiser,R.J. and Hood,L.E. (1996) High-density oligo arrays. Biosens. Bioelectron., 6/7, 687–690. [Google Scholar]
- 21.Hughes T.R., Mao,M., Jones,A.R., Burchard,J., Marton,M.J., Shannon,K.W., Lefkowitz,S.M., Ziman,M., Schelter,J.M., Meyer,M.R., Kobayashi,S., Davis,C., Dai,H., He,Y.D., Stephaniants,S.B., Cavet,G., Walker,W.L., West,A., Coffey,E., Shoemaker,D.D., Stoughton,R., Blanchard,A.P., Friend,S.H. and Linsley,P.S. (2001) Expression profiling using microarrays fabricated by an ink-jet oligo synthesizer. Nat. Biotechnol., 19, 342–347. [DOI] [PubMed] [Google Scholar]
- 22.Lauffenberger D.A. and Linderman,J.J. (1996) Receptors. Oxford University Press, New York.
- 23.Birney E., Bateman,A., Clamp,M.E. and Hubbard,T.J. (2001) Mining the draft human genome. Nature, 409, 827–828. [DOI] [PMC free article] [PubMed] [Google Scholar]
- 24.Friend S.H., Bernards,R., Rogelj,S., Weinberg,R.A., Rapaport,J.M., Albert,D.M. and Dryja,T.P. (1986) A human DNA segment with properties of the gene that predisposes to retinoblastoma and osteosarcoma. Nature, 323, 643–646. [DOI] [PubMed] [Google Scholar]
- 25.Hong F.D., Huang,H.J., To,H., Young,L.J., Oro,A., Bookstein,R., Lee,E.Y. and Lee,W.H. (1989) Structure of human retinoblastoma gene. Proc. Natl Acad. Sci. USA, 86, 5502–5506. [DOI] [PMC free article] [PubMed] [Google Scholar]
- 26.Toguchida J., McGee,T.L., Paterson,J.C., Eagle,J.R., Tucker,S., Yandell,D.W. and Dryja,T.P. (1993) Complete genomic sequence of the human retinoblastoma susceptibility gene. Genomics, 17, 535–543. [DOI] [PubMed] [Google Scholar]


