Abstract
The dissociation kinetics of a series of doubly deprotonated oligonucleotide 7-mers [ , d(AATTAAT)2−, d(TTAATTA)2−, and d(CCGGCCG)2−] were measured using blackbody infrared radiative dissociation in a Fourier-transform mass spectrometer. The oligonucleotides dissociate first by cleavage at the glycosidic bond leading to the loss of a neutral nucleobase, followed by cleavage at the adjacent (5′) phosphodiester bond to produce structurally informative a-base and w type ions. From the temperature dependence of the unimolecular dissociation rate constants, Arrhenius activation parameters in the zero-pressure limit are obtained for the loss of base. The measured Arrhenius parameters are dependent on the identity of the nucleobase. The process involving the loss of an adenine base from the dianions, , d(AATTAAT)2−, and d(TTAATTA)2− has an average activation energy (Ea) of ~1.0 eV and a preexponential factor (A) of 1010 s−1. Both guanine and cytosine base loss occurs for d(CCGGCCG)2−. The average Arrhenius parameters for the loss of cytosine and guanine are Ea = 1.32 ± 0.03 eV and A = 1013.3±0.3 s−1. No loss of thymine was observed for mixed adenine–thymine oligonucleotides. Neither base loss nor any other fragmentation reactions occur for over a 600 s reaction delay at 207 °C, a temperature close to the upper limit accessible with our instrument. The Arrhenius parameters indicate that the preferred cleavage sites for mixed oligonucleotides of similar mass-to-charge ratio will be strongly dependent on the internal energy of the precursor ions. At low internal energies (effective temperatures below 475 K), loss of adenine and subsequent cleavage of the adjacent phosphoester bonds will dominate, whereas at higher energies, preferential cleavage at C and G residues will occur. The magnitude of the A factors ≤1013 s−1 measured for the loss of the three nucleobases (A, G, and C) is indicative of an entropically neutral or disfavored process as the rate limiting step for this reaction.
An important goal of biomedical research is to relate phenotypic expression observed in living organisms to the genetic information encoded in their chromosomes. Characterizing this relationship is of enormous fundamental and practical importance. The medical implications are profound and will revolutionize diagnostic and therapeutic strategies, leading to improved gene level therapy and, ultimately, gene modification. A necessary first step in realizing this goal is to characterize the genetic information encoded in DNA. The goal of the Human Genome Project (HGP) [1a], which is expected to be complete within 5 years, is to sequence the human genome. Parallel and related research (e.g., phylogenetics) has also been directed at the genomes of other organisms and several complete sequences have already been reported [1b].
DNA sequencing for the HGP and related research has relied primarily on an enzymatic approach using a DNA polymerase enzyme with random terminating agents followed by electrophoretic separation. This approach has undergone extensive development and will almost certainly be the method used to obtain the vast majority of the sequence of the human genome. However, this approach does have some limitations, such as the inability to identify modified nucleotides. Base modifications, such as methylation, have been implicated in many forms of carcinoma [2] and the detection of these modifications is of considerable importance. It is also relatively inefficient at detecting small changes in DNA sequence as is required for genotyping single nucleotide polymorphisms.
For these reasons, there is interest in the development of complementary sequencing techniques. Both electrospray ionization (ESI) [3] and matrix-assisted laser desorption/ionization (MALDI) [4] can be used to generate intact gas-phase ions from nonvolatile and thermally labile biopolymers and mass spectrometry has emerged as a valuable new tool for the analysis of DNA. With the ability to provide fast and accurate molecular weight measurements, mass spectrometry can be used to rapidly verify the base composition of oligonucleotides and to identify chemical modifications that may be present. Molecular weights with low ppm mass measuring accuracies have been obtained for 100-mers (MW ~ 30 kDa) using ESI and Fourier-transform mass spectrometry (FTMS) [5]. These measurements were carried out using femtomole quantities of the sample, highlighting the sensitivity of the mass spectrometry measurements. In addition to identifying base composition, mass spectrometry can also be used to determine the base sequence. McLafferty and coworkers recently determined the complete sequence of a 50-mer using FTMS [5]. Direct sequencing of biopolymers by tandem mass spectrometry (MS/MS) involves dissociating the isolated precursor ion using collisional or radiative heating. The mass difference between fragment ions produced by cleavage between successive monomers, nucleotides in the case of DNA, can be used to reconstruct the sequence. Computer algorithms to obtain sequence information from MS/MS data have been developed and applied to oligonucleotide mixtures [6]. An important strength of the MS/MS approach, in addition to speed and sensitivity, is that it can be applied to modified oligonucleotides because the sequence is determined from mass differences.
The success of the MS/MS based sequencing strategy relies completely on the nature and extent of fragmentation of the gas-phase DNA ions. Therefore, the study of the dissociation reactions of gas-phase oligonucleotides, including the effects of the base-sequence and charge state on dissociation, can improve the information content attainable by this method. The dissociation reactions of oligonucleotide anions at low excitation energies have been investigated by a number of laboratories using both collisional and radiative excitation in conjunction with quadrupole ion trap [7–11], FTMS [5, 12–14], triple quadrupole [6, 15, 16], and hybrid mass spectrometers [17]. Pioneering studies on the dissociation characteristics of multiply charged oligonucleotides have been carried out by McLuckey and co-workers [7–11]. Using collisional activation in an ion trap, the dominant dissociation products for a variety of multiply charged oligonucleotide anions (4–8-mers) were identified [7]. A comprehensive study on the dissociation reactions of deprotonated dinucleotide ions was carried out by McCloskey and co-workers in a hybrid tandem mass spectrometer under multiple collision conditions [17]. The lowest energy dissociation pathways for the dinucleotide anions were elucidated by Beauchamp and co-workers using collisional activation in FTMS [14].
Collisional activation in trapping instruments is typically achieved through many low energy collisions that produce a gradual increase in ion internal energy. This type of “slow” heating favors the lower energy dissociation processes [18]. Under these low energy conditions, fragmentation of oligonucleotide anions occurs at the N–glycosidic bonds and the 3′ phosphodiester bonds. These cleavage sites are illustrated in Scheme I for a generic 4-mer. Cleavage of the glycosidic bond results in the loss of a nucleobase, either as a neutral or as an anion and a complementary (M–baseH) anion. The propensity for neutral or ionic base loss depends on the charge state of the ion, with higher charge states favoring loss of an ionized base [10]. Subsequent cleavage of the 3′ phosphoester bonds leads to the formation of the structurally informative a-base and w type ions. The nomenclature adopted here was originally proposed by McLuckey and co-workers [8].
Scheme 1.
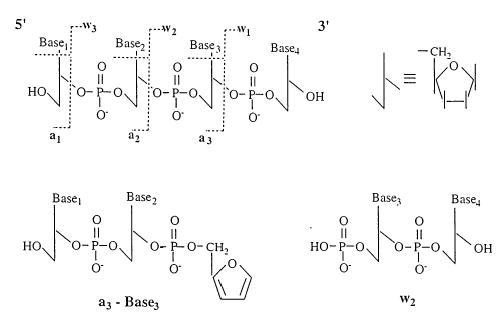
For neutral base loss from low charge-state ions, McLuckey and co-workers found that there was no preferential loss of any of the four nucleobases of A, G, T, and C [8]. McLafferty and co-workers observed a different behavior for large, multiply deprotonated oligonucleotides (up to 100-mers) using infrared multiphoton dissociation (IRMPD) and collisional activation in FTMS [4]. Under their experimental conditions, the four nucleobases exhibited differential reactivity: A > C ≅ G ≫ T. In general, no loss of thymine was observed for the anions studied [4]. Using MALDI/TOF, Smith and co-workers [19] observed a different ordering for the reactivities of the different nucleotides for small (<8-mers), singly charged oligonucleotide anions. The order of reactivity was reported as: C ≅ G > A ≫ T. Again, the thymine nucleotides were found to be unusually stable relative to the other three nucleotides. To explain this differential reactivity, the authors proposed that the nucleobases are protonated during the desorption/ionization step, leading to the formation of gas-phase zwitterions. Dissociation of the N–glycosidic bond is then thought to occur preferentially for the protonated base. Based on this mechanism, the differential reactivity of the different nucleobases should reflect their gas-phase basicities. In the absence of intramolecular charge solvation, the gas-phase basicity of the four bases decreases in the following order: G > C ≅ A ≫ T [20].
With the development of the blackbody infrared radiative dissociation (BIRD) technique [21], it is now possible to characterize the Arrhenius activation energy (Ea) and preexponential factor (A) for dissociation of large biomolecule ions in vacuo. With BIRD, ions are trapped in an ultrahigh vacuum by a magnetic and an electric field and rapidly exchange blackbody photons with the vacuum chamber walls. For large ions that have many vibrational modes, the rate of absorption and emission of photons is much faster than the rate of dissociation. As a result, the ions equilibrate to the temperature (which can be varied) of the vacuum chamber walls and have a Boltzmann distribution of internal energy [22]. The BIRD technique has been used to determine the Arrhenius parameters for the dissociation of a variety of cationized amino acids [23], peptides [24], and small proteins [25]. More recently, this method has been applied to the dissociation of DNA duplexes and evidence for the retension of Watson–Crick base pairing in the gas phase was obtained [26]. In the present work, the BIRD technique is used to measure the dissociation Ea and A factors for a series oligonucleotide dianions. The Arrhenius parameters are used to evaluate proposed dissociation mechanisms and explain the different fragmentation behavior observed under different experimental conditions.
Experimental
All experiments were performed with a Fourier-transform (FT) mass spectrometer equipped with a 2.7 tesla superconducting magnet and an Odyssey data system (Finnigan-FTMS, Madison, WI). DNA samples were synthesized by the Center for Biotechnology at Cornell University and desalted using two steps of HPLC. Gas-phase DNA anions were formed from ~10−4 M solutions of oligonucleotides in 50:50 H2O/CH3CN with nanoelectrospray (flow rate ~100 nL/min). Ions were collected in the FTMS cell for 5–15 s. In order to improve ion trapping efficiency, N2 was pulsed into the ion cell region at pressures of ~10−6 torr during ion accumulation. Isolation of the desired precursor ions was achieved using both single frequency rf and stored waveform inverse Fourier transform (SWIFT) excitation. The temperature of the vacuum chamber was controlled using a heating blanket with an Omega proportional temperature controller. Four copper-constantan thermocouples located inside the main vacuum chamber were used to monitor the temperature. The temperature difference between these thermocouples at the highest temperatures used was less than 2 °C.
For analysis of the kinetic data, the time-domain spectra were truncated to 32 K data points, apodized with the Blackmann–Harris window, and zero-filled once prior to performing a magnitude mode Fourier transform. Dissociation rate constants were obtained by performing a standard unweighted linear least squares analysis to a plot of ln {[M]/([M]+∑[F])} versus reaction delay, where M and F are the precursor and fragment ions, respectively. The errors in the Arrhenius activation parameters were obtained by calculating the variances and covariances (ANOVA table) of the Arrhenius activation energies (Ea) and frequency factors (A), from the linear regression data. This error analysis assumes that the kinetic data are independent and reflects uncertainties due to random errors.
Results and Discussion
BIRD of Oligonucleotide Anions
BIRD spectra of five doubly deprotonated oligonucleotide 7-mers (M2−): , , d(AATTAAT)2−, d(T-TAATTA)2−, and d(CCGGCCG)2− were measured at temperatures between 140 and 210 °C. A representative BIRD spectrum taken from the kinetic data for each 7-mer is shown in Figure 1a–e. Dissociation of the dianions, except , which does not dissociate under these conditions, results in loss of a neutral nucleo-base giving (M–baseH)2− and cleavage of the 3′ phosphoester bond leading to a-base and w type ions.
Figure 1.
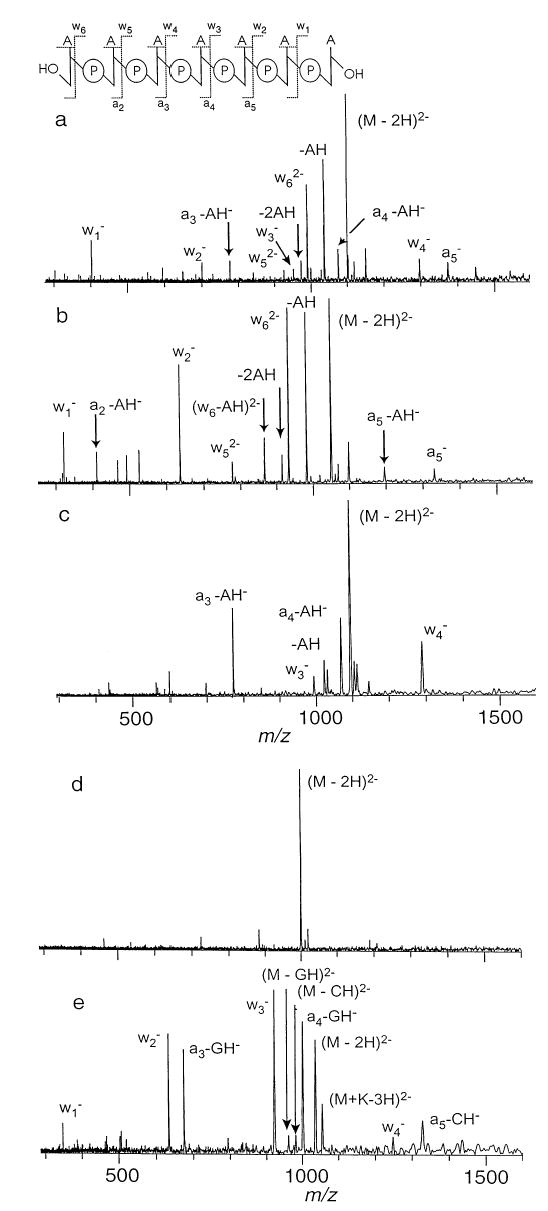
Blackbody infrared radiative dissociation spectra of doubly deprotonated DNA anions (a) with a reaction delay of 30 s and a cell temperature of 163 °C, (b) d(AATTAAT)2 (45 s, 171 °C), (c) d(TTAATTA)2− (120 s, 161 °C), (d) (600 s, 207 °C), and (e) d(CCGGCCG)2− (50 s, 181 °C).
BIRD of the three adenine-containing anions leads to varying amounts of (M–AH)2−. Extensive backbone cleavage leading to a-base and w type ions is also observed. In the case of , (M–AH)2− is the dominant dissociation product at a 30 s delay and a temperature of 163 °C. A small amount of the (M–2AH)2− is also observed under these conditions (Figure 1a). Backbone cleavage occurs at all of the phosphodiester bonds producing varying amounts of and and . The complementary (a3–AH)− to (a5–AH)− ions are also observed. Cleavage at the terminal (5′) phosphoester bond to produce occurs preferentially. The mixed strands, d(AATTAAT)2− and d(T-TAATTA)2−, exhibit similar dissociation behavior at similar reaction temperatures, with the notable exception that cleavage of the backbone occurs exclusively at sites adjacent to adenine containing residues (on the 3′ side). This indicates that the 5′ base directs the dissociation process. BIRD of d(AATTAAT)2− (Figure 1b) leads to abundant (M–AH)2−, , and (w6–AH)2− doubly charged ions, and complementary a2–AH/w5, a5–AH/w2 singly charged ions. BIRD of d(TTAATTA)2− (Figure 1c) leads predominantly to the complementary a4–AH/w3 and a3–AH/w4 singly charged ions as well as (M–AH)2−. Loss of thymine does not occur for any of the dianions, even for at 600 s reaction time at 207 °C (Figure 1d). This is close to the maximum temperature and reaction time accessible with the current instrument. BIRD of d(CCGGCCG)2− at 181 °C leads predominantly to the singly charged complementary a3–GH/w4, a4–GH/w3, and a5–CH/w2 singly charged ions (Figure 1e). Only a small amount of (M–CH)2− or (M–GH)2− is observed. There appears to be little preference for loss of cytosine compared to guanine.
For d(TTAATTA)2−, the sodium and potassium adducts of the precursor [e.g. (M+Na)2−], are much less reactive than the M2− ions at the same temperatures. Ion mobility measurements of various charge states of d(T)10 by Clemmer and co-workers [27] indicate that the addition of Na+ to multiply charged d(T)10 ions leads to more compact structures. The effect of the counterion was attributed to a reduction in the Coulombic repulsion between the charged phosphates, so that the ion adopts a more compact structure where the charge sites are presumably more efficiently solvated. Although in the present case the charge state is low, this increased self-solvation may explain the stability of these ions.
Primary Dissociation Pathways
To delineate the primary dissociation pathways of the precursor ions from secondary processes, double resonance experiments were carried out for the d(AAT-TAAT)2−, d(TTAATTA)2−, and d(CCGGCCG)2− ions. In a double resonance experiment, a single frequency rf waveform (6 V peak to peak) is applied continuously during the BIRD reaction delay in order to continuously eject a single fragment ion from the cell. Provided that the fragment ion is ejected in less time than that required for this same ion to dissociate, then all other fragment ions formed from this intermediate ion will not be observed in the mass spectrum. An example of a double resonance experiment is shown in Figure 2. The top spectrum (Figure 2a) is a BIRD spectrum of AAT-TAAT2− at 171 °C with a reaction delay of 45 s. Figure 2b was acquired under identical conditions but with the addition of a single frequency excite applied at the frequency corresponding to the (M–AH)2− fragment (m/z 982). The absence of the expected a-base and w ions in the spectrum indicates that all backbone fragmentation proceeds first by loss of a neutral adenine base:
Figure 2.
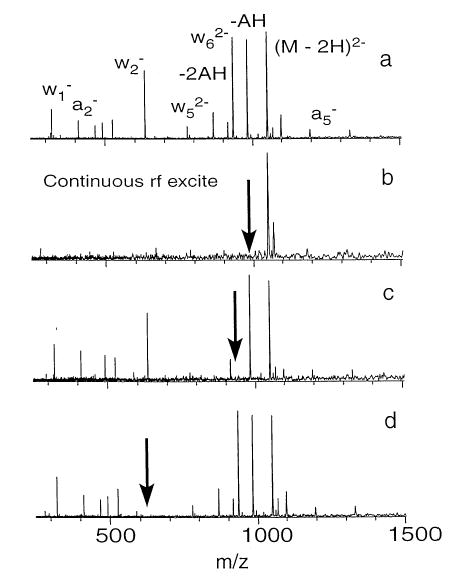
BIRD spectra of d(AATTAAT)2− (a) at 171 °C and a reaction delay of 45 s, (b) under the same conditions but with a single rf excitation to continuously remove (M–2H–AH)2−, (c) continuous ejection of , and (d) continuous removal of ; asterisk denotes the 2nd harmonic of (M–2H)2−.

If the excitation frequency used to eject the fragment ions at m/z 982 is moved slightly off-resonance, the spectrum reverts back to that observed in Figure 2a. This indicates that the excite is not leading to collisional heating of the precursor ion nor is it resulting in the primary ejection of the other fragment ions.
Similar double resonance experiments were carried out on several of the other fragment ions. The spectrum shown in Figure 2c was obtained by continuously ejecting . The only structural ion that is eliminated is indicating that the remaining a-base and w ions originate from (M–AH)2− and not . A similar experiment carried out for revealed that is not a precursor for .
Double resonance experiments were also carried out for d(TTAATTA)2− and d(CCGGCCG)2−. In all cases, base loss was found to precede backbone cleavage. This result agrees with earlier work by Beauchamp and co-workers [14] where double resonance experiments applied to on-resonance collisionally activated dissociation of singly deprotonated dinucleotide anions showed that dissociation of the phosphoester bond proceeds first by loss of the base on the 5′ side of the site of cleavage.
Dissociation Kinetics and Energetics
The first-order dissociation rate constants for base loss from the precursor ions (M2−) were obtained from a linear least squares fit of a plot of ln {[M]/([M]+∑[F])} versus reaction delay, where [M] and [F] are the measured intensities of the precursor and fragment ions, respectively. Results for d(AATTAAT)2− at four temperatures spanning a 51 °C range are shown in Figure 3. All plots are linear and have near zero intercepts. From the temperature dependence of the dissociation rate constants, Arrhenius plots are obtained (Figure 4). The dissociation activation energy (Ea) and preexponential factor (A) for each precursor are obtained from the slope and the y intercept, respectively. These values are listed in Table 1. The Arrhenius parameters for base loss from the three adenine-containing 7-mers are all similar. The Ea’s for loss of adenine range from 1.0 to 1.1 eV (23–25 kcal/mol). The A factors are between 1010 and 1011 s−1. The average Ea for loss of neutral cytosine and guanine is slightly higher, 1.3 eV (30 kcal/mol) as is the preexponential factor (1013 s−1). The individual rate constants for the loss of cytosine and guanine are obtained from the branching ratio of these two competing processes. The procedure for this has been described previously [24a]. The resulting Arrhenius plots are shown in Figure 4 along with the overall Arrhenius plot. The activation energy for loss of cytosine and guanine are 1.35 ± 0.02 and 1.31 ± 0.04 eV, respectively. These values are indistinguishable within experimental error. The log A for these two processes are 13.1 ± 0.2 and 12.5 ± 0.3, respectively. These results indicate that loss of cytosine is very slightly entropically favored.
Figure 3.
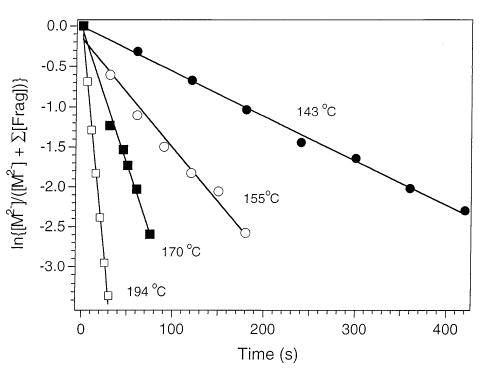
BIRD dissociation data for d(AATTAAT)2− fit to first-order kinetics at the temperatures indicated. The rate constants in order of increasing temperature are 0.0055, 0.0135, 0.034, and 0.112 s−1.
Figure 4.
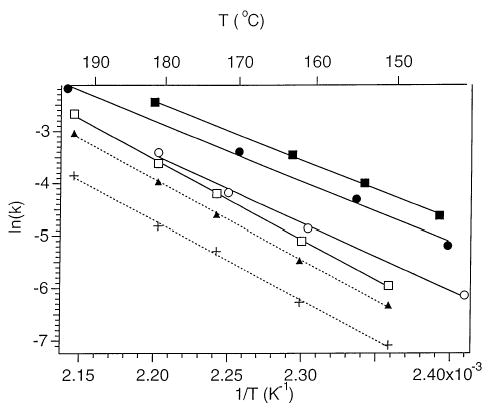
Arrhenius plots for the loss of neutral adenine from d(AATTAAT)2− (filled circle), d(TTAATTA)2− (open circle), and d(A7)2− (filled square), and for the dissociation of d(CCGGCCG)2− [all processes (open square), loss of neutral cytosine (filled triangle), and the loss of neutral guanine (plus)].
Table 1.
Measured Arrhenius activation parameters for the loss of neutral nucleobase from doubly deprotonated oligonucleotide 7-mers
| Oligonucleotide | Ea (eV) | Log A | Primary fragments |
|---|---|---|---|
| 1.03 ± 0.05 | 10.3 ± 0.6 | –AH | |
| d(AATTAAT)2− | 1.00 ± 0.07 | 9.8 ± 0.8 | –AH |
| d(TTAATTA)2− | 1.12 ± 0.06 | 10.9 ± 0.8 | –AH |
| . . . | . . . | . . . | |
| d(CCGGCCG)2− | 1.32 ± 0.03 | 13.3 ± 0.3 | –GH, –CH |
| → –CH | 1.35 ± 0.02 | 13.1 ± 0.2 | –CH |
| → –GH | 1.31 ± 0.04 | 12.5 ± 0.3 | –GH |
Kinetics above 200 °C.
The highest temperature accessible with the current apparatus is ~220 °C. The dissociation of ions at even higher temperatures can be estimated by extrapolating the kinetics measured at lower temperatures. The key assumption in doing this is that the same process for loss of each of the three bases, cytosine, guanine, and adenine measured at low temperature is also the one kinetically favored at higher temperature, i.e., a more entropically favored process is not accessible at the higher temperatures. With this assumption, the Arrhenius plots in Figure 4 extrapolated to 720 K are shown in Figure 5. Below 475 K, loss of adenine is expected to occur preferentially. At higher temperatures, loss of cytosine and guanine will dominate. Thus, base-selective cleavage, at least for oligonucleotides of comparable size and charge state, should be possible by controlling the internal energy deposited in the ions.
Figure 5.
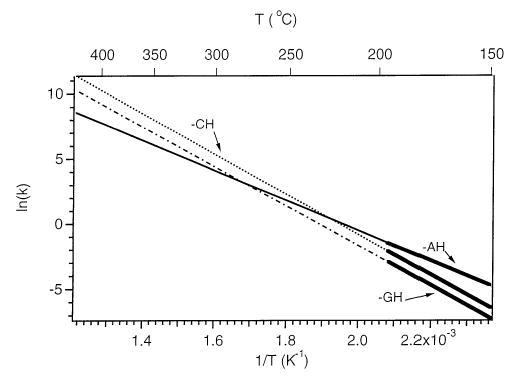
Arrhenius plots for the loss of the neutral bases cytosine, guanine and adenine from oligonucleotide 7-mer dianions extrapolated from the Figure 4 data to 720 K.
No thymine loss occurs for at 480 K (207 °C) even after 600 s. This places an upper limit of 10−4 s−1 for the dissociation rate constant at this temperature. The slow dissociation kinetics for loss of T could be because of energetic and/or entropic factors. However, the loss of T from di- and oligonucleotide anions has been observed in collisional activation experiments where it is possible to heat ions to higher “effective” temperatures than with BIRD under conditions used here, i.e., >500 K [8, 14, 17]. This suggests that at least part of the inertness of the thymine base is due to a high Ea because if it were simply an entropic effect, increasing the temperature would not lead to higher relative abundances. In the absence of experimentally determined Arrhenius parameters, a lower limit Ea for this process can be estimated based on an assumed A factor. For example, with an A factor of 1013 s−1, similar to that for loss of cytosine and guanine, the lower limit to Ea is 1.5 eV (35 kcal/mol); for a smaller A factor, 1010 s−1 (comparable to loss of adenine), the lower limit to the Ea drops to 1.3 eV (31 kcal/mol). To actually measure the Arrhenius parameters for this process, the maximum temperature accessible with our instrument must be increased.
Although the present measurements were carried out only for doubly charged 7-mers, the Arrhenius parameters can provide some insight into results obtained from other laboratories. For oligonucleotide anions of similar size and mass-to-charge ratio heated to relatively low internal energies, i.e., <475 K as in the present work, loss of neutral adenine and subsequent cleavage of the backbone at these sites are expected to dominate the dissociation spectra. Under conditions where the ions are heated to higher internal energies, as is possible in ion trap or triple quadrupole instruments, reactions at cytosine and guanine nucleotides will be kinetically favored. For singly charged ions formed by MALDI, Zhu et al. [19] found that cytosine and guanine nucleotides were twice as reactive as adenine nucleotides. This result suggests that the “effective” temperature of these MALDI ions was above 540 K but not so hot that loss of thymine occurred. Of course the Arrhenius plots considered here are for doubly charged ions and the Arrhenius parameters for base loss from singly charged ions may not be similar. One could obtain “effective” temperatures of MALDI ions if these specific Arrhenius parameters were known.
Dissociation Mechanisms
The preexponential factor can provide important insight into the reaction mechanism associated with the rate limiting step. From Transition State Theory, the preexponential factor for a unimolecular process is related to the entropy difference between the transition state structure and the precursor as follows:
For the dissociation of neutral polyatomics, preexponential factors of 1010–1013 s−1 are generally associated with rearrangement reactions involving cyclic transition states [28]. For example, the dissociation of acetic anhydride to acetic acid and ketene:
is thought to proceed via a 6-member ring transition state [28]. The measured preexponential factor for this reaction is 1012 s−1. Simple bond fission reactions, on the other hand, generally have A factors in the range of 1015–1018 s−1 [28]. Although one must be cautious in using the A factors measured for small polyatomic neutrals to interpret reactions mechanisms for large biomolecule ions, the present results indicate that rate limiting step associated with base loss is not entropically favorable, consistent with a rearrangement process.
There have been several mechanisms proposed for the base loss and backbone fragmentation. These mechanisms have been outlined in a review by Roepstorff and co-workers [28]. One mechanism proposed by Beauchamp and co-workers [14] is shown in Scheme II. Both base loss and backbone fragmentation are thought to be charge directed processes. An assumption with this mechanism is that the charges are localized on the phosphate oxygens which are expected to have the lowest intrinsic gas-phase acidities of the various functional groups in the oligonucleotides. The nucleobase is lost through an elimination reaction involving nucleophilic attack of a charged phosphate oxygen at the 2′ carbon of the 3′ sugar. This proton abstraction can occur through the formation of a 6-membered ring transition state. The base, which is lost as an anion, then forms an ion–dipole complex with the remaining oligonucleotide. Dissociation of the complex can lead to either a neutral or charged base, the propensity for the formation of either depends on the apparent or kinetic gas-phase acidities of the base and oligonucleotide. In the present work, only neutral base loss was observed indicating that the nucleobase has a higher apparent gas-phase acidity than the charged oligonucleotide. Backbone fragmentation leading to a-base and w ions then proceeds through a second charge directed elimination reaction involving cleavage at the 3′ phosphoester bond at the site of base loss.
Scheme 2.
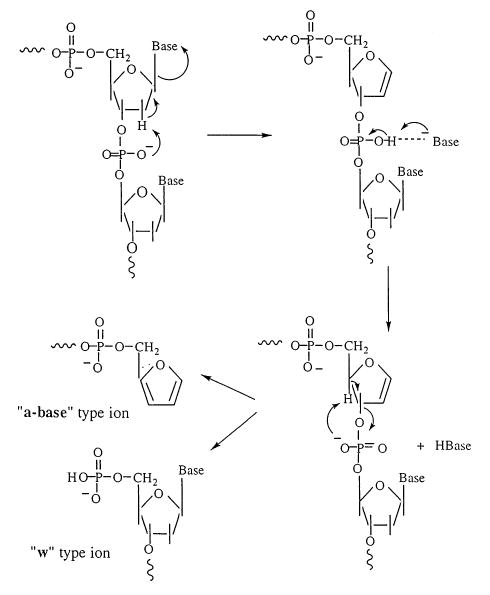
Beauchamp and co-workers modeled, at the PM3 level, the reaction coordinate for the loss of the 5′ base from three dinucleotides, AC, AG, and CG [14]. In all three cases, the energy barrier for the loss of the base was greater or equal to the energy barrier for dissociation of the ion–molecule complex. If one makes the reasonable assumption that the rearrangement reaction leading to cleavage of the glycosidic bond proceeds with a smaller A factor than that for dissociation of the ion–molecule complex, then the above calculations indicate that rate limiting step for base loss corresponds to cleavage of the glycosidic bond. The magnitude of the A factors measured for base loss in the present work is consistent with an elimination reaction as the rate limiting step although the different values measured for C and G vs. A indicates that the identity of the base influences this process. The present results also indicate that the Ea for base loss is governed primarily by the nature of the nucleobase that is cleaved. This can be seen in the dissociation of the mixed oligonucleotides, where the identity of the adjacent nucleotides has only a subtle influence on the reactivity of a given base. This result is in contrast to the semiempirical calculations by Beauchamp and co-workers, where the identity of the 3′ base was found to have a more significant effect on the calculated activation energy.
An alternative, albeit tentative explanation for the different Ea’s measured for the dissociation of the different bases lies in the fact that the product of the elimination reaction is a deprotonated nucleobase. Consequently, the Ea should scale with the deprotonation enthalpy (ΔHacid) of the base, with the more acidic bases exhibiting a lower Ea. According to this argument and based on our measured Ea’s, we would predict an acidity ordering of A < C ≈ G. A similar argument has been put forth by Kebarle and co-workers [30] to explain the threshold energies measured for the loss of deprotonated base from deprotonated mononucleotides. At present, accurate gas-phase acidity measurements have not been reported for the nucleobases. Based on the branching ratios observed for the loss of neutral base (BH) relative to deprotonated base (B−) from dinucleotide anions, McLuckey and co-workers [9] have determined the following ordering of gas-phase acidities for the nucleobases, A < G < T < C, with A being the most acidic. A similar study reported by Beauchamp and co-workers [14] yielded a slightly different ordering, A < T < G < C. Again A was found to be the most acidic nucleobase, consistent with the lowest measured Ea. These results would suggest that thymine has a gas-phase acidity similar to G and therefore should have an Ea of similar value, i.e., ~1.3 eV, although the observation of T loss at higher effective temperatures would indicate that this activation energy may be slightly higher.
Conclusions
The first Arrhenius parameters for the dissociation of oligonucleotide anions have been determined using BIRD. At reaction temperatures up to 200 °C (473 K), the oligonucleotides dissociate exclusively through loss of a neutral nucleobase followed by cleavage of the 3′ phosphoester bond producing the structurally informative a-base and w ions. Double resonance experiments confirm that base loss precedes backbone cleavage at these temperatures. The Arrhenius parameters measured for base loss are dependent on the nature of the nucleobase. Loss of neutral adenine has the lowest activation energy, with an average value of 1.05 eV for the three adenine containing oligonucleotides studied. The average activation energy for loss of neutral cytosine and guanine from d(CCGGCCG)2− is 1.32 eV. Thymine residues are unreactive at temperatures below 480 K for times up to 600 s. The magnitude of the preexponential factors measured in this work (≤1013 s−1) indicate that the rate limiting step associated with base loss is a rearrangement reaction. The different preexponential factors for A vs. C and G indicate that the identity of the base not only influences the energetics of the process but the entropy as well. Although detailed mechanistic information cannot be inferred from the present work, the results are consistent with a proposed dissociation mechanism where base loss proceeds by a 1,2-elimination reaction.
For the doubly deprotonated 7-mers, the dissociation kinetics for the different nucleobases have different temperature dependence. Extrapolating these results to higher internal energies, some base-selective fragmentation is expected for mixed oligonucleotide anions containing all four bases. Under conditions that produce ions with effective temperatures greater than 540 K, cleavage at cytosine and guanine residues is expected to preferentially occur, whereas at lower temperatures, dissociation at adenine residues will dominate. Extending the present study to include oligonucleotides of varying size and charge state would provide information about the generality of these Arrhenius parameters.
Acknowledgments
This research would not have been possible if not for the generous financial support provided by the National Science Foundation (CHE-9726183), National Institutes of Health (1R29GM50336-01A2), the Society of Analytical Chemists of Pittsburgh for sponsoring fellowship support through the American Chemical Society, Division of Analytical Chemistry (PDS), and the Canadian NSERC for fellowship support (JSK).
References
- 1.a Yager TD, Zewert TE, Hood LE. Acc Chem Res. 1994;27:94–100. [Google Scholar]; (b) Proteome Research: New Frontiers in Functional Genomics; Wilkins, M. R.; Williams, K. L.; Appel, R. D.; Hochstrasser, D. F., Eds.; Springer: Berlin, 1997.
- 2.Laird PW, Jackson-Grusby L, Fazeli A, Dickinson SL, Jung WE, Li E, Weinberg RA, Jaenisch R. Cell. 1995;81:197–205. doi: 10.1016/0092-8674(95)90329-1. [DOI] [PubMed] [Google Scholar]
- 3.Fenn JB, Mann M, Meng CK, Wong SF, Whitehouse CM. Science. 1989;246:64–71. doi: 10.1126/science.2675315. [DOI] [PubMed] [Google Scholar]
- 4.Hillenkamp F, Karas M, Beavis RC, Chait BT. Anal Chem. 1991;63:1193A–1202A. doi: 10.1021/ac00024a002. [DOI] [PubMed] [Google Scholar]
- 5.Little DP, Aaserud DJ, Valaskovic GA, McLafferty FW. J Am Chem Soc. 1996;118:9352–9359. [Google Scholar]
- 6.Ni J, Pomerantz SC, Rozenski J, Zhang Y, McCloskey JA. Anal Chem. 1996;68:1989–1999. doi: 10.1021/ac960270t. [DOI] [PubMed] [Google Scholar]
- 7.McLuckey SA, Van Berkel GJ, Glish GL. J Am Soc Mass Spectrom. 1992;3:60–70. doi: 10.1016/1044-0305(92)85019-G. [DOI] [PubMed] [Google Scholar]
- 8.McLuckey SA, Habibi-Goudarzi S. J Am Chem Soc. 1993;115:12085–12095. [Google Scholar]
- 9.McLuckey SA, Vaidyanathan G, Habibi-Goudarzi S. J Mass Spectrom. 1995;30:1222–1229. [Google Scholar]
- 10.Habibi-Goudarzi S, McLuckey SA. J Am Soc Mass Spectrom. 1995;6:102–113. doi: 10.1016/S1044-0305(94)00108-C. [DOI] [PubMed] [Google Scholar]
- 11.McLuckey SA, Vaidyanathan G. Int J Mass Spectrom Ion Processes. 1997;162:1–16. [Google Scholar]
- 12.Little DP, Chorush RA, Spier JP, Senko MW, Kelleher NL, McLafferty FW. J Am Chem Soc. 1994;116:4893–4897. [Google Scholar]
- 13.Little DP, McLafferty FW. J Am Chem Soc. 1995;117:6783–6784. [Google Scholar]
- 14.Rodgers MT, Campbell S, Marzluff EM, Beauchamp JL. Int J Mass Spectrom Ion Processes. 1994;137:121–149. [Google Scholar]
- 15.Barry JP, Vouros P, Schepdael AV, Law SY. J Mass Spectrom. 1995;30:993–1006. [Google Scholar]
- 16.Bartlett MG, McCloskey JA, Manalili S, Griffey RH. J Mass Spectrom. 1996;31:1277–1283. doi: 10.1002/(SICI)1096-9888(199611)31:11<1277::AID-JMS418>3.0.CO;2-F. [DOI] [PubMed] [Google Scholar]
- 17.Phillips DR, McCloskey JA. Int J Mass Spectrom Ion Processes. 1993;128:61–82. [Google Scholar]
- 18.McLuckey SA, Goeringer DE. J Mass Spectrom. 1997;32:461–474. [Google Scholar]
- 19.Zhu L, Parr GR, Fitzgerald MC, Nelson CM, Smith LM. J Am Chem Soc. 1995;117:6048–6056. [Google Scholar]
- 20.Greco F, Lugiori A, Sidona G, Uccella N. J Am Chem Soc. 1990;112:9092–9096. [Google Scholar]
- 21.a Price WD, Schnier PD, Williams ER. Anal Chem. 1996;68:859–866. doi: 10.1021/ac951038a. [DOI] [PubMed] [Google Scholar]; b Tholmann D, Tonner DS, McMahon TB. J Phys Chem. 1994;98:2002–2004. [Google Scholar]; c Dunbar RC, McMahon TB, Tholmann D, Tonner SC, Salahub DR, Wei D. J Am Chem Soc. 1995;117:12819–12825. [Google Scholar]
- 22.a Price WD, Schnier PD, Jockusch RA, Strittmatter EF, Williams ER. J Am Chem Soc. 1996;118:10640–10644. doi: 10.1021/ja961812r. [DOI] [PMC free article] [PubMed] [Google Scholar]; b Price WD, Williams ER. J Phys Chem A. 1997;101:8844–8852. doi: 10.1021/jp9722418. [DOI] [PMC free article] [PubMed] [Google Scholar]
- 23.a Price WD, Jockusch RA, Williams ER. J Am Chem Soc. 1997;119:11988–11989. doi: 10.1021/ja9711627. [DOI] [PMC free article] [PubMed] [Google Scholar]; b Price WD, Schnier PD, Williams ER. J Phys Chem B. 1997;101:664–673. doi: 10.1021/jp9628702. [DOI] [PMC free article] [PubMed] [Google Scholar]
- 24.a Schnier PD, Price WD, Strittmatter EF, Williams ER. J Am Soc Mass Spectrom. 1997;8:771–780. doi: 10.1016/S1044-0305(97)84129-3. [DOI] [PMC free article] [PubMed] [Google Scholar]; b Schnier PD, Price WD, Jockusch RA, Williams ER. J Am Chem Soc. 1996;118:7178–7189. doi: 10.1021/ja9609157. [DOI] [PMC free article] [PubMed] [Google Scholar]
- 25.a Jockusch RA, Schnier PD, Price WD, Strittmatter EF, Demirev PA, Williams ER. Anal Chem. 1997;69:1119–1126. doi: 10.1021/ac960804q. [DOI] [PMC free article] [PubMed] [Google Scholar]; b Gross DS, Zhao Y, Williams ER. J Am Soc Mass Spectrom. 1997;8:519–524. doi: 10.1016/S1044-0305(97)00010-X. [DOI] [PMC free article] [PubMed] [Google Scholar]
- 26.Schnier, P. D.; Klassen, J. S.; Strittmatter, E. F.; Williams, E. R. J. Am. Chem. Soc., in press. [DOI] [PMC free article] [PubMed]
- 27.Hoaglund CS, Liu Y, Ellington AD, Pagel M, Clemmer DE. J Am Chem Soc. 1997;119:9051–9052. [Google Scholar]
- 28.Benson, S. W. Thermochemical Kinetics. Methods for the Estimation of Thermochemical Data and Rate Parameters; Wiley: New York, 1968.
- 29.Nordhoff E, Kirpekar F, Roepstorff P. Mass Spectrom Rev. 1996;15:67–138. doi: 10.1002/(SICI)1098-2787(1996)15:2<67::AID-MAS1>3.0.CO;2-8. [DOI] [PubMed] [Google Scholar]
- 30.Ho Y, Kebarle P. Int J Mass Spectrom Ion Processes. 1997;165:433–455. [Google Scholar]


