Abstract
Photodissociation kinetics of the protonated pentapeptide leucine enkephalin measured using a cw CO2 laser and a Fourier-transform mass spectrometer are reported. A short induction period, corresponding to the time required to raise the internal energy of the ion population to a (dissociating) steady state, is observed. After this induction period, the dissociation data are accurately fit by first-order kinetics. A plot of the log of the unimolecular dissociation rate constant, kuni, as a function of the log of laser power is linear at low laser powers (<9 W, kuni <0.05 s−1), but tapers off at high laser power (9–33 W, kuni = 0.05–7 s−1). The entire measured dissociation curve can be accurately fit by an exponential function plus a constant. The experiment is simulated using a master equation formalism. In the model, the laser radiation is described as an energetically flat-topped distribution which is spatially uniform. This description is consistent with experimental results which indicate that ion motion within the cell averages out spatial inhomogeneities in the laser light. The model has several adjustable parameters. The effect of varying these parameters on the calculated kinetics and power dependence curves is discussed. A procedure for determining a limited range of threshold dissociation energy, Eo, which fits both the measured induction period and power dependence curves, is presented. Using this procedure, Eo of leucine enkephalin is determined to be 1.12–1.46 eV. This result is consistent with, although less precise than, values measured previously using blackbody infrared radiative dissociation. Although the blackbody dissociation results were used as a starting point to search for fits of the master equation model to experiment, these results demonstrate that it is, in principle, possible to determine a limited range of Eo from slow infrared multiphoton dissociation data alone.
Introduction
Mass spectrometry (MS) has emerged as a powerful technique for the structural characterization of biomolecules. Information about biomolecule conformation can be obtained from H/D exchange experiments both in solution and in the gas phase.1–3 Tandem mass spectrometry (MS/MS),4,5 a technique in which an ion of interest is mass selected and reacted and the products are mass analyzed, has been used to obtain the complete sequence of small proteins,6–9 and locate and identify sites of post-translational modifications and derivatization.10 For these types of experiments, MS/MS has the advantage that it can be applied directly to complex mixtures containing only trace quantities of the species of interest.11
The most common method used to characterize ion structure by MS/MS is via a dissociation experiment. Many methods have been used to activate large ions in MS/MS, including collisionally activated dissociation (CAD),12–14 surface-induced dissociation,8,15–19 electron-capture dissociation,20 blackbody infrared radiative dissociation (BIRD),21–27 and laser photodissociation.28–32 While the energy deposited into an ion with these methods has been well characterized for small ions, much less is known about the energy deposition and the energetics required for larger biomolecule fragmentation.33,34 Several methods for this, including temperature-dependent kinetic measurements in trapping mass spectrometers21–27,35–38 and energy-resolved surface-induced dissociation experiments,19,39 appear promising. Of these methods, blackbody infrared radiative dissociation has been used to investigate the dissociation energetics and mechanisms of a wide variety of biopolymers, including amino acids,36,37 peptides,22,23 proteins,24–26 and nucleotides.27
With BIRD, ions are trapped inside the heated vacuum chamber of a Fourier-transform mass spectrometer. The ions exchange photons with the vacuum chamber walls, which can be heated and produce a blackbody distribution of photons at the temperature of the vacuum chamber. At the low pressures of the experiment, collisions with background gas play a negligible role in the ion activation process. For large ions, the radiative exchange is fast enough that the ion population equilibrates with the blackbody field, producing a Boltzmann distribution of ion internal energies. We have called this the rapid energy exchange (REX) limit.25,35 In this limit, Arrhenius parameters for dissociation are equal to those which would be measured in the traditional high-pressure limit. For small ions and clusters, radiative exchange rates are lower due to fewer oscillators. Under typical experimental conditions, the ion internal energy distribution resembles a Boltzmann, but is depleted at the high-energy tail. In this regime, dissociation rate constants are lower than those measured in the REX limit. Master equation modeling of the BIRD results can be used to extract accurate threshold dissociation energies (Eo) from these measurements.35–37 BIRD measurements can be quite precise; Eo and Ea values are often determined to less than ±0.05 eV. If the dissociation process is in the REX limit, the experimentally measured Arrhenius preexponential can directly provide information about the mechanism of the dissociation process. While many different types of ions have been studied using BIRD, some ions do not dissociate at the maximum temperature obtainable with our current instrumentation (~220 °C), even with very long (500 s) reaction times.
Infrared multiphoton dissociation (IRMPD) can be used to dissociate such thermally stable ions.30 In this technique, ions undergo stepwise vibrational excitation. Low-power cw CO2 radiation gives fragments similar to those obtained by BIRD and collisionally activated dissociation.30,40 A review by Thorne and Beauchamp 15 years ago examines several aspects of IRMPD for ions up to a few hundred daltons.41 Of particular note is a study by Beauchamp and co-workers in which the variation of the photodissociation rate with laser power was measured for the proton-bound dimer of diethyl ether. In this study, the relationship between the log of the dissociation rate constant (kuni) and the log of laser irradiance was found to be linear.42 However, similar measurements on other small ions did not yield the same relationship.43
In 1991, Dunbar discussed the possible use of slow IRMPD under collision-free conditions to determine energetics.44 For ions with well-behaved dissociation processes (i.e., no low-energy bottlenecks), IRMPD should be analogous to blackbody dissociation and a linear relationship should exist between log(kuni) and log(laser power (P)) or irradiance if the laser heating process is slow enough. Dunbar modeled the IRMPD process using both a thermal (modified Tolman) analysis and a random walk/master equation simulation. Subsequently, Dunbar and co-workers compared cw CO2 dissociation kinetics of n-butylbenzene ions as a function of P to computer-simulated data.45 The authors concluded that both approaches to modeling slow IRMPD were valid. However, the authors expressed the opinion that it was necessary to anchor the simulated and experimental dissociation curves to a specific internal energy via the use of an independent thermometric technique. Recently, Marshall and co-workers examined the slow IRMPD of the nonapeptide bradykinin and two charge states of the protein ubiquitin.28,29 Using Dunbar’s thermal model, the threshold dissociation energy determined for bradykinin agreed with that determined by BIRD. For ubiquitin, qualitative, but not quantitative, agreement was found.
Here, we report the results of cw CO2 laser photodissociation of a protonated pentapeptide, leucine enkephalin (YGGFL), and compare the experimental results to those of a master equation simulation.46 After a short induction period, the dissociation data can be accurately fit to first-order kinetics. A plot of ln(kuni) vs ln(P) reveals that although the relationship is linear at low laser powers, curvature is clearly present at values of kuni greater than ~0.05 s−1. The master equation model reproduces both the induction period and the curvature in the dissociation plot. The model has several adjustable parameters. The effect of varying these parameters on the calculated dissociation curve is discussed. A procedure for determining a limited range of Eo which fit the experimental data is presented. The values obtained using this method are comparable in magnitude, but not in precision, to those obtained using BIRD.
Experimental Section
Instrumentation.
All experimental measurements were performed using a Fourier-transform mass spectrometer equipped with a 2.7 T magnet and an external electrospray ionization source. A detailed description of the instrumentation is available elsewhere.21,23 Light from a 25 W continuous wave sealed CO2 laser (model no. 48-2-28W, Synrad Inc., Bothell, WA) is used to dissociate the ions. The laser beam is directed toward the ion cell by a series of mirrors, and enters the vacuum system by passing through a ZnSe window mounted on one end of the vacuum chamber. The laser beam position is carefully aligned by adjusting the mirrors to achieve the maximum extent of dissociation (>98%) of the trapped ions. This was accomplished by scanning the beam horizontally using an IR mirror mounted on a 1-D translation stage. The extent of dissociation was roughly constant for a window of width ~5 mm, but dropped precipitously on either side of this. The beam was set in the middle of this range. The vertical direction was also scanned by adjusting the tilt of the mirror, and again the beam location was set in the middle of the range in which significant dissociation was observed. This procedure was then repeated to ensure good alignment. Following this alignment procedure, virtually all (>98%) of the precurser ions could be dissociated. The laser power is measured just before the ZnSe window (outside the vacuum chamber) using a Power Wizard power meter (PW-250, Synrad Inc., Bothell, WA). The power reported is the average of five power measurements. The maximum power output of the laser is ~33 W.
For experiments at elevated vacuum chamber temperatures, the entire vacuum chamber containing the ion cell is heated by a resistive heating blanket to a uniform temperature. The temperature of the ion cell is measured by a thermocouple located adjacent to the cell.
Dissociation Experiments.
Ions are formed using nanoelec-trospray ionization. The ions are guided by a series of electrostatic lenses through five stages of differential pumping into the ion cell, where they are trapped radially by the magnetic field and axially by a 5 V potential applied to the trapping plates. Ions are introduced into the ion cell for 1–3 s. The load time is adjusted to maximize the signal. After the ion load, a shutter is closed to prevent additional ions from entering the cell. A pulse of N2 gas (2 × 10⁻⁶ Torr) is used during the load event and for 2 s afterward to assist in trapping and thermalizing the ions. This is followed by a 2 s delay to pump out the N2 gas, after which time the vacuum chamber returns to a base pressure of ~3 × 10⁻⁹ Torr. In some experiments, ions were isolated using stored waveform inverse Fourier-transform, frequency sweeps, and single-frequency excitation waveforms. However, no isolation waveforms were used for most experiments. The laser is turned on for a reaction time ranging from 0.05 to 300 s. Following this, ions are excited for detection using a broadband chirp excitation with a sweep rate of 1100 Hz/μs. Data are acquired using an acquisition rate of 941 kHz (m/z 90 cutoff) on an Odyssey data system (Finnigan, Madison, WI).
Materials.
Leucine enkephalin was purchased from Sigma Chemical Co. (St. Louis, MO) and used without further purification. Solutions for electrospray were ~5 × 10⁻⁵ M peptide in a 50/50 water/methanol mixture with ~1% acetic acid added.
Structures.
Structures were generated by conformation searching using the MMFF force field provided with the MacroModel package v. 6.5 (MacroModel, Columbia University, New York, NY). The lowest energy structure was used as a starting point for AM1 semiempirical energy minimization. Vibrational frequencies, , and their corresponding transition dipole moments, {μ}, used in the master equation modeling are calculated from these structures. Semiempirical techniques do not calculate μ accurately.47,48 However, previous results suggest that, on average, AM1-calculated values of μ can be multiplied by a scaling factor of 2–4 to reproduce measured blackbody infrared radiative dissociation kinetics.22,36,37 For this reason, a multiplication factor for μ (TD*) was included in the modeling as an adjustable parameter.
Master Equation Model.
A master equation formalism was used to simulate the experiment. Code written in our group to simulate the BIRD experiment was modified to include the effects of laser irradiation. Details of our group’s implementation of the master equation can be found elsewhere.36 Briefly, the master equation follows the time evolution of the internal energy of the ion population. The energy of the ion population is divided into bins of 100 cm−1. A bin can be populated by absorption of a photon from a bin of lower energy or by spontaneous or stimulated emission from a bin of higher energy. Similarly, an energy bin can be depopulated by absorption or emission of a photon or by dissociation. Rate constants for absorption and emission are calculated from Einstein coefficients for these processes. Microcanonical dissociation rate constants are calculated using RRKM theory. The energy density used in the calculation of rates for stimulated processes is taken as the sum of the Planck density for a blackbody at the background temperature of the experiment plus a term describing the laser power density, :
| (1) |
The power density of the laser is modeled very simply as a flat-top distribution, both spatially and energetically:
| (2) |
where P is the laser power in watts, dCO2 is the diameter of the laser beam, is the width of the laser wavelength range in wavenumbers, c is the speed of light, and є is an efficiency factor which takes into account any factors which reduce the light intensity prior to the ions, such as reflections at the vacuum chamber window. Mathematically, dCO2 and є play the same role. However, we choose to leave them as separate parameters because they should represent separable physical quantities.
Parameters in the Master Equation Model.
Table 1 lists parameters included in the master equation model. We use P as measured outside the ZnSe window. The window is uncoated, so each face reflects 17% of the 10.6 μm light. Thus, we set the efficiency, є, at (0.83)2 = 69%. The 48-2-28W CO2 laser has an output range of 940.7–946.1 cm−1 (10.57–10.63 μm), a beam diameter of 3.5 mm and a divergence of 4 mR according to Synrad Inc.’s specifications. This translates into a ~9.1 mm beam diameter at the center of the ion cell located ~1.4 m from the laser. Both 10 and 100 cm−1 were used to model . The actual spectral width of the CO2 laser is 5.4 cm−1. However, using a value of 100 cm−1 allows for more uncertainty in the calculated vibrational frequencies. In the modeled dissociation curves discussed in this paper, a laser spectral width of 100 cm−1 is used unless otherwise noted.
TABLE 1.
Parameters in the Master Equation Model
| symbol | quantity | description/comments |
|---|---|---|
| Eo | threshold dissociation energy | used in RRKM calculations |
| A | Arrhenius preexponential | used in RRKM calculations, range of 108–1018 s−1 modeled |
| Z | vibrational frequency set | calculated using the AM1 semiempirical force field |
| {μ} | transition dipole moment set | calculated using the AM1 semiempirical force field |
| TD* | transition dipole multiplication factor | adjusted in model to fit kinetics |
| dCO2 | laser beam diameter | = 9.1 mm calculated from the manufacturer’s specifications, adjusted in model to fit kinetics |
| P | laser power | power in watts as measured outside the instrument |
| laser wavelength range | usually 100 cm−1, also modeled as 10 cm−1 | |
| є | efficiency factor | set at 69% |
| TBB | background blackbody temperature | usually 298 K, 406 K in one set of experiments |
For the RRKM calculations, transition-state frequency sets were constructed from the semiempirical reactant frequency set. One frequency (a C–C stretch at 1329 cm−1) was removed as the dissociation coordinate, and five other frequencies were systematically varied to construct eight transition-state frequency sets with REX A-factors ranging from 108 to 1018 s−1.
Results and Discussion
Laser Photodissociation.
Figure 1 shows Planck distributions at 298 and 406 K along with the modeled flat-topped laser irradiation density overlayed on a calculated absorption spectrum for the protonated pentapeptide leucine enkephalin (LeuEnk·H+). Note that, in this figure, the blackbody density is shown magnified by 104; the density of photons due to the blackbody field at the wavelengths overlapping the laser irradiation window is insignificant. However, due to the breadth of the blackbody distribution and the good overlap with the absorption spectrum of LeuEnk·H+ (the basis of the BIRD technique), background radiation due to the blackbody can significantly influence dissociation rates.
Figure 1.
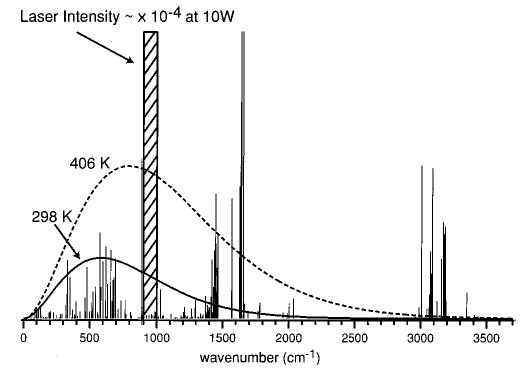
Vibrational frequencies and transition intensities (D2) of the protonated peptide leucine enkephlin, LeuEnk·H+ (YGGFL), calculated at the AM1 semiempirical level. Planck distributions at 298 and 406 K along with the modeled CO2 laser density (around 10.6 μm) are shown overlayed on the absorption spectrum.
Figure 2 shows a series of summed 10.6 μm photodissociation spectra of the LeuEnk·H+ at a laser power (P) of 18.9 W. In this set of experiments, LeuEnk·H+ was isolated before the laser irradiation. The major fragments which appear at short times are the same ones observed using low-energy dissociation techniques, such as BIRD22 and sustained off-resonance irradiation collisionally activated dissociation.49,50 Most notably, fragments corresponding to the loss of water from the parent ion and to the cleavage of the peptide bond between the fourth and fifth residues (the b4 ion) are present. As the duration of the laser irradiation is increased, these fragments can absorb additional photons and dissociate further, forming many lower-mass product ions with low abundance (Figure 2c).
Figure 2.
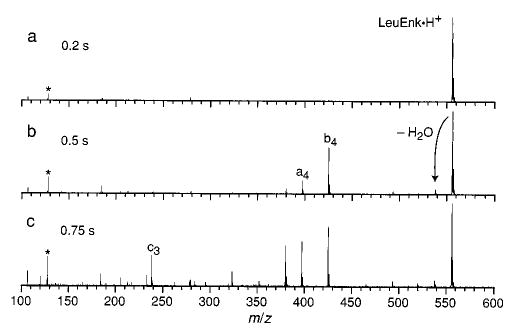
Summed photodissociation spectra of LeuEnk·H+ at 18.9 W laser power as a function of laser irradiation time (indicated on each spectrum). The asterisk indicates the reference frequency (note the intensity of the reference frequency in these spectra is not meaningful because these spectra are summed, and the phase of the reference signal is random).
Laser Beam/Ion Cloud Overlap.
Alignment of the laser beam with the ion cloud is important in these experiments. It is possible to manipulate the ion cloud such that complete dissociation is not obtained. When the ion cell is filled to the point where space-charge effects reduce the performance of the instrument, the maximum extent of dissociation drops below 90%. This is presumably due to Coulomb-repulsion-induced expansion of the ion cloud. Application of isolation waveforms can also have a similar effect. This is due to some absorption of rf radiation by ions at off-resonant frequencies. For this reason, isolation steps were generally not performed prior to kinetic measurements. However, single-frequency excitation of ions at frequencies far off resonance from the ion of interest has little effect on measured dissociation efficiencies and rates. For example, ejection of the proton-bound dimer of LeuEnk (LeuEnkd·H+) has no measurable effect on the dissociation rate constant extracted for LeuEnk·H+.
IR Laser Dissociation Kinetics.
Figure 3 shows dissociation data for LeuEnk·H+ at laser powers ranging from 5.7 to 32.5 W fit to unimolecular kinetics. In these kinetic plots, the natural log of the normalized abundance of LeuEnk·H+ (ln [LeuEnk·H+]) is plotted as a function of the duration of the laser irradiation. The abundance of LeuEnk·H+ is measured relative to a single-frequency radio signal (331 kHz), i.e., relative to an internal standard, to circumvent the difficulty in measuring the abundance of all the fragment ions, some of which appear at m/z lower than the low-mass detection cutoff. The kinetic data are obtained from single measurements. ln [LeuEnk·H+] is greater than zero at short reaction times because some (<8% relative abundance) LeuEnkd·H+ was present at the beginning of the experiments, and LeuEnkd·H+ dissociates to LeuEnk·H+. However, this dissociation is entropically favored22 and occurs rapidly at the laser powers used. It should be noted that no signal for doubly protonated LeuEnkd, which can be clearly distinguished by its isotopic pattern, was observed.
Figure 3.
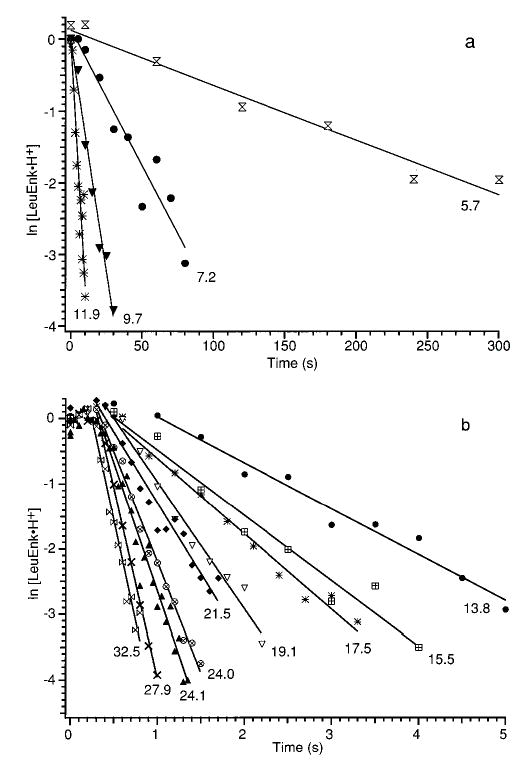
Kinetic data from laser dissociation of LeuEnk·H+ for a wide range of laser powers fit to first-order kinetics after a short induction period. Laser powers (W) are indicated in the figure.
In the kinetic plots at higher laser powers, an induction period of ~0.4 s is clearly present in the data (Figure 3b). To ensure that the induction period is not due to the presence of the LeuEnkd·H+, a kinetic data set at 24.1 W laser power was collected in which the dimer ion was ejected from the cell using a single-frequency excite (black triangles, Figure 3b). The use of the low-powered excite did not significantly change the rate or efficiency of dissociation compared to the 24.0 W dissociation data taken without the ejection (crossed circles, Figure 3b). In both sets of data, the same ~0.4 s induction period is evident. The length of the induction period is also not changed by adding more collision gas after the ions are trapped in the cell. This indicates that the ions are initially thermalized (at the vacuum chamber temperature) at the start of the laser irradiation period. However, the induction period is shorter in experiments conducted with the vacuum chamber at an elevated temperature. These results indicate that the induction period is a reflection of the time necessary to increase the internal energy of the ions from the starting temperature of 298 K to an energy at which dissociation occurs at a measurable rate.
After the induction period (and the dissociation of all the LeuEnkd·H+), the dissociation data can be fit accurately to first-order kinetics (Figure 3). The unimolecular dissociation rate constant, kuni, at a given laser power is determined from the slope of ln [LeuEnk·H+] vs time. In these experiments, the measured kuni ranges between 0.008 and 6.1 s−1. The good fit to first-order kinetics indicates that the distribution of ion internal energies reaches a steady state after the induction period.
Laser Dissociation Curves.
A plot of ln(kuni) vs ln(P) for LeuEnk·H+ is shown in Figure 4. The data set corresponding to the kinetic data of Figure 3 is shown as black triangles in this figure. The solid line is an exponential fit to this data set. Other data sets collected over a period of two months are shown as various open symbols. The error bars correspond to a factor of 2 in the measured rate constant. This represents an upper limit to the day-to-day variability of the experiment. These data clearly do not fall in a straight line. Rather, the rate of increase of kuni slows at higher laser powers. These data show that LeuEnk·H+ is not in the REX limit at the higher laser powers used in the experiment. This is due to a depletion of the high-energy tail of the steady-state internal energy distribution, resulting in a lowering of the experimentally measured rate constant. The same effect is present in ions which are not in the REX limit in the BIRD experiment.
Figure 4.
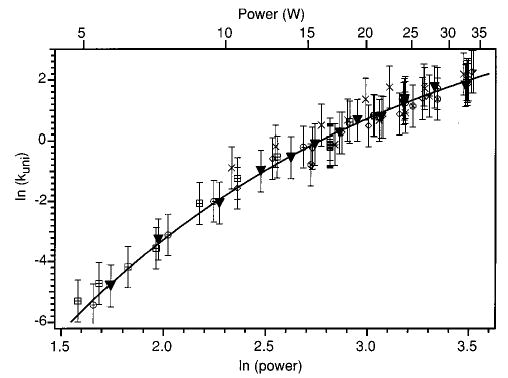
Laser photodissociation data for LeuEnk·H+ measured over a period of several months. The ▾’s correspond to the data set obtained from the kinetics shown in Figure 3. The line is an exponential fit to the ▾ data. The error bars are a range of a factor of 2 of the experimentally measured rate constant.
Effect of the Laser Beam Diameter.
Another series of experiments was performed to determine the effect of the laser beam diameter. An iris was placed between the laser and the ZnSe window about 75 cm from the center of the ion cell. The diameter of the opening of the iris was varied between ~1.5 and ~30 mm (fully open). The output of the laser was adjusted so that 8.5 W of power was measured after the iris, independent of the iris aperture. The results are shown in Figure 5. The measured dissociation rate constants varied between 0.060 and 0.079 s−1. There is no apparent correlation between the dissociation rate (or efficiency) and the iris aperture. Rather, it is clear that the dissociation rate depends on the total power and not significantly on the diameter of the laser beam. Thus, the average power density to which the ions are exposed appears to be approximately the same in all these kinetic data sets. When the laser beam diameter is small, the ions likely spend less time in the laser beam. However, while the ions are in the beam, they are exposed to a greater flux of photons. This results in an averaging effect. This is an important result because it lends validity to modeling the power output of the laser spatially as a flat-top distribution.
Figure 5.
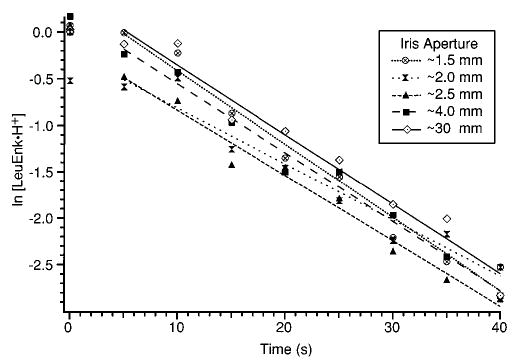
Effect of laser beam diameter on the photodissociation kinetics measured at 8.5 W total laser power. The diameter of the laser beam is limited by an iris of the aperture indicated. The solid line is a first-order fit to the kinetic data set measured with the iris at 30 mm.
Determining the Laser Beam Diameter/Transition Dipole Moment Multiplication Factor.
The scaling factor for the calculated transition dipole moments, TD*, and the laser beam diameter, dCO2, are determined by fitting the high laser power kinetic data. The A-factor and Eo were fixed at values that were measured previously using BIRD. The Arrhenius activation energy (Ea) and A-factor for the dissociation of LeuEnk·H+ determined using BIRD are Ea = 1.11 ± 0.06 eV and log(A) = 10.7 ± 0.6.22 If there is no reverse activation barrier for this dissociation process, then this Ea corresponds to a threshold dissociation energy, Eo, of 1.18 eV. These values were used to calculate microcanonical dissociation rate constants using RRKM theory. Kinetic data were then simulated using the master equation for a range of dCO2 and TD* values.
Figure 6 illustrates the effect of changing these parameters on the dissociation kinetics of LeuEnk·H+. The kinetic data at 24.1 W (ejecting LeuEnkd·H+) are shown in black triangles along with the fit to first-order kinetics after the induction period. The experimental kuni can be reproduced using an infinite number of combinations of TD* and dCO2. However, the choice of these two parameters determines the length of the induction period. The induction period with TD* = 1 and dCO2 = 7.0 mm is several tenths of a second longer than the measured period. Similarly, with TD* = 3 and dCO2 = 9.1 mm, the induction period is shorter than that measured. The entire experimental curve can be reproduced well using TD* = 1.8 and dCO2 = 8.3 mm. Thus, the effect of the absorption intensities can be separated from the effect of the beam diameter by fitting the induction period. The effect of the value of Eo on these parameters was not thoroughly investigated. However, only a limited range of Eo values can be used to fit both the induction period and the laser power dependence data.
Figure 6.
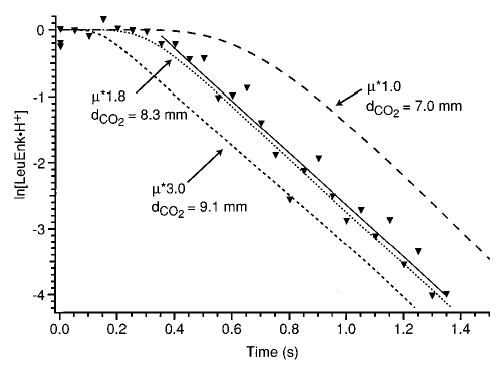
Effect of laser beam diameter (dCO2) and transition dipole moment multiplication factor (TD*) on simulated kinetic data at 24.1 W laser power. ▾ indicates experimental data at this laser power, and the solid line is a best-fit line to the experimental data.
In the procedure used here, Arrhenius parameters measured using BIRD were used as starting points in the search for fits to the photodissociation data when fitting the induction period. However, this is not a necessary step. Instead, the search could be performed in an iterative fashion. Guesses for the values of Eo and the A-factor could be used as starting points and used to fit the induction period and thus determine TD* and dCO2. These values would then be used to generate a power dependence curve. If the simulated plot had more (less) curvature than the measured data, new Eo/A-factor combinations using higher (lower) values would be used to generate new best guesses for TD* and dCO2, and this process would then be repeated. Thus, it is in principle possible to determine dissociation energetics from slow IRMPD data from first principles, without referencing these measurements to other techniques.
The values of TD* and dCO2 determined by fitting the induction period are quite reasonable. To model much of the BIRD data, values of TD* between 2 and 4 are typically required.22,36,37 Modeling of the BIRD data is relatively insensitive to individual transition intensities because the blackbody distribution overlaps with a large fraction of the absorption spectrum (Figure 1). Thus, many modes contribute to the rate constants of stimulated processes in the BIRD experiment. In contrast, a much smaller number of frequencies absorb and emit CO2 laser light. Eleven frequencies fall within the cm−1 window. Only a single frequency in the calculated spectrum is in the 10 cm−1 window. Thus, it is reasonable to expect that TD* will not be exactly the same value as is used for modeling the BIRD data. It is also not surprising that the beam diameter appears to be smaller than the ~9.1 mm value calculated from the manufacturer’s specifications. The Gaussian profile of the laser beam is modeled as a flat-top, spatially homogeneous profile. Therefore, if the ions spend more time near the center of the beam, they will be irradiated with a higher than average intensity. This can be accounted for by assigning the laser beam a smaller diameter than it has in reality. Alternatively, we could have chosen to leave dCO2 = 9.1 mm and accounted for this effect by raising є.
Using the parameters determined above, ln(kuni) vs ln(P) plots were generated using a background blackbody temperature, TBB, of 298 K. Figure 7 shows the modeled curve together with one set of the (room temperature) experimental data, shown as black triangles. The model reproduces the curvature of the laser dissociation plot well.
Figure 7.
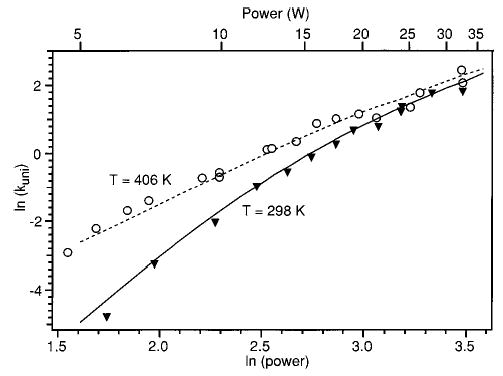
Laser photodissociation plots with vacuum chamber temperature at (▾) 298 and (○) 406 K. Simulated data with dCO2 = 8.3 mm and TD* = 1.8 at (solid line) 298 and (dashed line) 406 K are also shown.
The 24.1 W kinetics were also fit using a laser wavelength range 10 cm−1 wide. Using the smaller , the kinetics were accurately simulated using dCO2 = 7.0 mm and TD* = 1.8. Note that although TD* was found to be the same as that determined using cm−1, it is conceivable this value may change slightly depending on the value of . The ln(kuni) vs ln(P) curve calculated using these parameters was virtually identical to that calculated using the 100 cm−1 width and dCO2 = 8.3 mm. Thus, the choice of appears to have little effect on the master equation modeling results.
Effect of Temperature.
Another set of kinetic data was measured with the temperature of the vacuum chamber elevated to 406 K. The laser dissociation curve derived from these data is shown in open circles in Figure 7. Clearly, the rates of dissociation at the lower laser powers depend strongly on the background temperature, while at the higher laser powers, the elevated background temperature has only a minimal effect on kuni. These data were modeled using the same TD* and dCO2 determined above and a TBB = 406 K. The model accurately reproduces the effect of the elevated vacuum chamber temperature.
Effect of Eo and the A-Factor.
Varying the Eo and A-factor used in the model has a large effect on the calculated kuni. For example, raising Eo from 1.2 to 1.3 eV, leaving the A-factor unchanged, doubles the value of kuni at 24 W. Similarly, increasing the modeled frequency factor from 1010.7 to 1013.2s−1 increases the calculated kuni by approximately a factor of 3 at this laser power.
More interesting are the effects of changing Eo and the A-factor together. Figure 8 shows dissociation curves for A-factors of 1018 and 108 s−1 and Eo values of 1.65 and 0.95 eV, respectively. While both simulated data sets reproduce the experimentally measured kuni within a factor of 2 at all laser powers, the overall shapes of these curves are quite different. The combination of higher Eo and higher A-factor results in significant curvature of ln(kuni) with ln(P), while model curves with lower A-factors and Eo values are much flatter. The curve with Eo = 1.65 eV and log(A) = 18 exhibits greater curvature than do the experimental data while the curve with Eo = 0.95 eV and log(A) = 8 has significantly less curvature. Thus, it should be possible to determine a limited range of Eo values which fit the experimental data even if no information about the dissociation mechanism (i.e., the transition-state entropy) is known.
Figure 8.
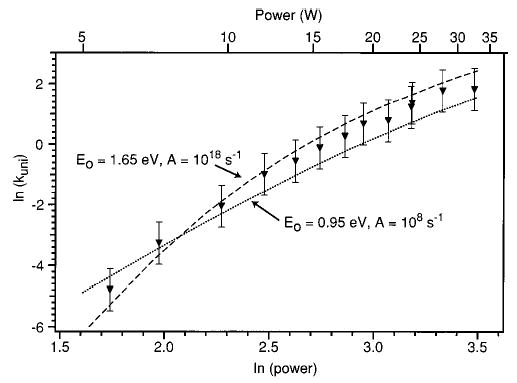
Experimental (▾) and simulated (dashed and dotted) laser dissociation curves. The threshold dissociation energy (Eo) and Arrhenius A-factor used in the calculations are indicated. Error bars are a factor of 2 in unimolecular dissociation rate constant.
Threshold Dissociation Energies.
Dissociation curves were calculated using the master equation model described above for A-factors ranging from 108 to 1018 s−1. This brackets transition states ranging from very “tight” to very “loose”. For each A-factor, dissociation curves were calculated for a series of values. The range of Eo values for each A-factor was chosen such that the calculated dissociation rate constants spanned a range of a factor of 2 of the experimental rate constant.
Both the experimental and simulated data can be fit accurately by an exponential function of the form
| (3) |
where C0, C1, and C2 are all positive constants (fitting parameters). The values of C1 and C2 determine the curvature, while C0 controls the vertical position of the curve. Fits were performed using an iterative nonlinear least-squares procedure included in the IgorPro v. 3.11 graphing program (WaveMetrics, Inc., Lake Oswego, OR). The procedure uses the Levenberg–Marquardt algorithm to search for the parameters which minimize χ2. The program also estimates the error for each parameter, sCi, as the square root of the diagonal elements of the covariance matrix. This error is an approximation of the true standard deviation.
The procedure used to fit the data follows: first, the experimental data are fit to an exponential form (eq 3) with equal weighting of all data points, allowing all three fitting parameters (C1, C2, and C3) to vary freely. In Figure 4, the best-fit exponential curve to the black triangle data set is shown as a solid line. This determines the values c0, c1, and c2 of the fitting parameters C0, C1, and C2 and their associated errors sc0, sc1, and sc2. This best exponential fit to the experimental data is then compared to the calculated dissociation curve. If the calculated rates are not within a factor of 2 of the fit to the experimental data, the Eo/A-factor combination is excluded as a fit. Next, both the calculated and the experimental data sets are fit to a series of exponentials in which C1 is fixed at values c1′ spanning the range (c1 − sc1) to (c1 + sc1), while C0 and C2 vary freely. For each exponential fit with C1 fixed at c1′, C2 is determined to have a value c2′ with associated error sc2′. If the value of C2 thus determined for the calculated data falls within the range c2′ ± sc2′, determined from the fit to the experimental data (with C1 fixed at c1′), then that calculated curve is counted as a fit.
Figure 9 shows the range of fits to the experimental data determined using this procedure. Using the criteria for a fit detailed above, the value of Eo was determined to be in the range 1.12–1.46 eV. The A-factor could not be determined as precisely within the expected range for peptides; A-factors ranging between 109 and 1016 s−1 could be used to fit the data. The Eo and A-factor extracted using the modeling are consistent with the values determined by BIRD.22 However, the precision of the laser dissociation/master equation modeling technique is currently not as good as that obtained by BIRD. For leucine enkephalin, the uncertainty in the activation energy range determined by BIRD was approximately one-third that of the range of Eo determined using the technique presented here. The A-factors show an even larger discrepancy. The uncertainty in the A-factor determined by BIRD is approximately 1 order of magnitude, whereas the uncertainty by the photodissociation/master equation modeling approach is a 7 order of magnitude range. Thus, little information about the transition-state entropy and dissociation mechanism is obtained. This is also the case when dissociation processes measured by BIRD are not in the rapid energy exchange limit and the data must be analyzed using the master equation or truncated Boltzmann technique.36
Figure 9.
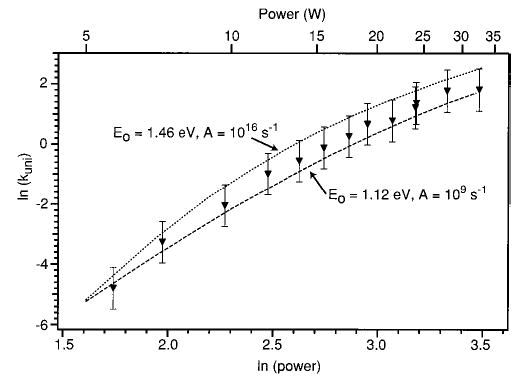
Experimental laser photodissociation data of LeuEnk·H+ (▾) together with the range of fits determined by master equation modeling.
Kinetic Modeling: Divergence from the REX Limit.
An alternative way to view the effect of changing TD* and dCO2 in the model is shown in Figure 10. Here, simulated laser dissociation curves over a very wide range of laser powers are shown for TD* = 1, 2, and 3 for two different dCO2 values. At very low laser powers, the unimolecular dissociation rate does not depend on TD*. In addition, the plots are linear in this region as predicted earlier by Dunbar.44 However, at ln(kuni) > ~ −6, the model starts to diverge from linearity. The simulated data most affected are those with the lowest TD*, i.e., those with the slowest rates of radiative exchange. This figure illustrates the transformation from kinetics in the REX limit (the linear portion) to kinetics of a depleted Boltzmann population. The range of rate constants at which this occurs is determined by the relative rates of radiative exchange and dissociation. At low laser powers, dissociation rates are slow enough that the ions come to a “temperature”, resulting in a near Boltzmann distribution of ion internal energy and hence in a linear ln(kuni) vs ln(P) relationship. As the laser power is increased and the dissociation rate increases, ions with slower radiative exchange rates (included in the model as those with lower transition dipoles) fall outside the REX limit, while those which exchange more quickly (TD* = 2 or 3) remain in the REX limit until slightly higher laser powers. It is important to note that these data cover a much wider range of kuni than is usually measured using BIRD. The typical BIRD kinetic window is indicated in Figure 10. A higher range of internal energies can be accessed in the laser photodissociation experiment. Because of this, the curvature in these power dependence data is more significant than the curvature in Arrhenius plots generated by BIRD.
Figure 10.
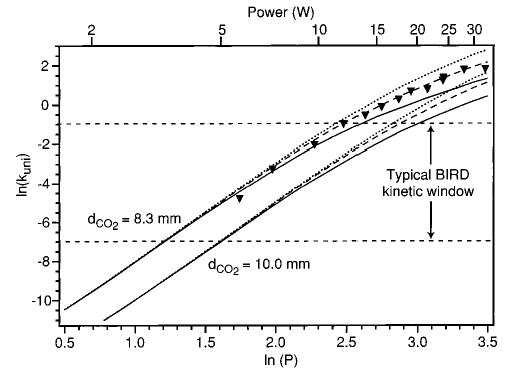
Laser dissociation data simulated using the master equation model with two different laser beam diameters and TD* = 1 (solid line), 2 (dashed line), and 3 (dotted line). The BIRD kinetic window is indicated.
Radiative exchange rates increase with the number of oscillators. Therefore, larger ions, such as protein ions, will be in the REX limit at higher laser powers than LeuEnk·H+. This should make modeling much simpler, as TD* will not affect the modeled kinetics in these ions.
Figure 11a illustrates how the internal energy of the LeuEnk·H+ ion population changes as a function of laser irradiation time. These data are calculated using the master equation simulation at a laser power of 24.1 W. Starting with a Boltzmann distribution at 298 K, the internal energy distribution of the ion population shifts to higher energy for the first several tenths of a second. After ~0.4 s, the shape of the energy distribution remains roughly constant, although the parent ion population is depleted as time progresses. At this point, a steady-state ion internal energy distribution is reached. This illustrates the origin of the induction period and subsequent first-order kinetics observed in the dissociation data. Figure 11b compares the calculated ion internal energy distribution at 0.5 s to that of a thermalized (Boltzmann) distribution at 580 K. The maximum of the simulated population distribution at 0.5 s is the same as that of a Boltzmann population at 580 K. However, the calculated energy distribution is substantially narrower than that of the Boltzmann distribution. Thus, the dissociation process is not in the REX limit at this laser power.
Figure 11.
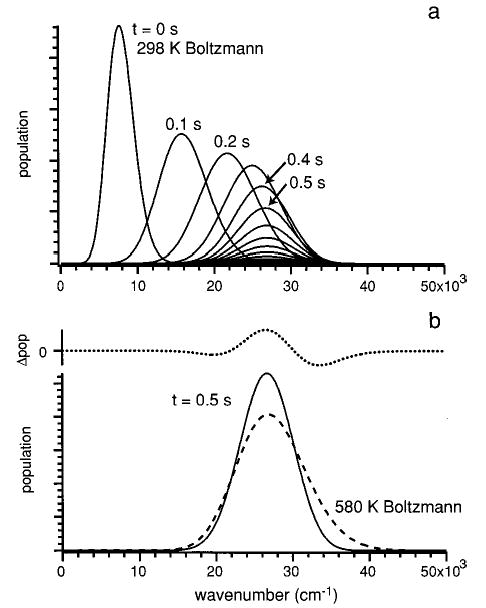
Calculated ion internal energy distribution of LeuEnk·H+ at 24.1 W laser power. Values of TD* = 1.8 and dCO2 = 8.3 mm were used for the simulation. Part a follows the time evolution of the distribution in 0.1 s time steps. Part b compares the steady-state energy distibution (solid line) to a Boltzmann distribution at 580 K (dashed line). Both curves are normalized to the same area. The difference between these distributions (dotted line) is shown separately.
Conclusion
The use of a cw CO2 laser to obtain the dissociation energy of a protonated pentapeptide, leucine enkephlin, using a Fourier-transform mass spectrometer is demonstrated. After a short induction period, the dissociation kinetics are accurately fit by first-order kinetics. These results indicate that the ion internal energy reaches a steady-state distribution shortly after the start of laser irradiation. The extent and rate of dissociation depend primarily on the total energy flux, not on the diameter of the laser beam. This indicates that the ion motion within the cell averages out spatial inhomogeneities in the laser light. A plot of the natural log of the unimolecular dissociation rate constant as a function of the natural log of laser power is linear for very slow rate constants, but deviates significantly at values of kuni > 0.05 s−1. These experimental data can be accurately fit by an exponential function plus a constant.
A master equation formalism is used to simulate the slow photodissociation process. The laser irradiation is modeled as a flat-topped distribution with an adjustable spectral width and laser beam diameter. A scaling factor for calculated transition intensities is also included as an adjustable parameter in the model. By fitting the measured induction period, it is possible to separate the effect of the transition intensity and laser beam diameter. With these values fixed, a limited range of threshold dissociation energies which fit the measured power dependence can be determined. For LeuEnk·H+, the threshold dissociation energy was determined to be in the range 1.12–1.46 eV. This is consistent with the activation energy measured previously using BIRD. However, the precision of the BIRD technique is much better than that currently of the photodissociation/master equation modeling procedure.
The precision of this method could be improved if the range of parameters used in the master equation modeling procedure were reduced. This would be possible if, for example, information about the dissociation mechanism for the process under investigation were known. Rearrangement reactions, such as typically occur for loss of water, could be fit with a lower maximum A-factor than the 1018 s−1 upper limit used here. More accurate calculations of transition dipole moments and frequencies would make possible a reduction in the range of transition dipole moment multiplication factors used. It may also be that the identity of larger peptides may not be a major factor in the range of transition dipole moments used in these calculations. Absorption cross sections and frequencies for larger peptides may be sufficiently similar that detailed calculations of these values for each ion may not be required. Dissociation kinetics for even larger ions, such as proteins, will likely be in the rapid energy exchange limit. The model kinetics will not depend on calculated transition dipole moments. Both of these factors would certainly increase the analytical utility of this method. We are investigating the dissociation kinetics of other peptide and protein ions to determine the extent to which model parameters are similar.
Acknowledgments
We thank Eric Strittmatter for providing a low-energy structure of protonated leucine enkephalin. Financial support was generously provided by the National Science Foundation (Grants CHE-9726183 and CHE-9732886) and the National Institutes of Health (Grant IR29GM50336-01A2, and fellowship support for R.A.J.).
References
- 1.Dienes T, Pastor SJ, Schurch S, Scott JR, Yao J, Cui SL, Wilkins CL. Mass Spectrom Rev. 1996;15:163–211. doi: 10.1002/(SICI)1098-2787(1996)15:3<163::AID-MAS2>3.0.CO;2-G. [DOI] [PubMed] [Google Scholar]
- 2.Green MK, Lebrilla CB. Mass Spectrom Rev. 1997;16:53–71. doi: 10.1002/(SICI)1098-2787(1997)16:2<53::AID-MAS1>3.0.CO;2-8. [DOI] [PubMed] [Google Scholar]
- 3.Miranker A, Robinson CV, Radford SE, Dobson CM. FASEB J. 1996;10:93–101. doi: 10.1096/fasebj.10.1.8566553. [DOI] [PubMed] [Google Scholar]
- 4.McLafferty, F. W. Tandem Mass Spectrometry; John Wiley and Sons: New York, 1983.
- 5.Busch, K. L.; Glish, G. L.; McLuckey, S. A. Mass Spectrometry/Mass Spectrometry: Techniques and Applications of Tandem Mass Spectrometry; VCH Publishers: New York, 1988.
- 6.McLafferty FW, Fridriksson EK, Horn DM, Lewis MA, Zubarev RA. Science. 1999;284:1289–1290. doi: 10.1126/science.284.5418.1289. [DOI] [PubMed] [Google Scholar]
- 7.Bruce JE, Anderson GA, Wen J, Harkewicz R, Smith RD. Anal Chem. 1999;71:2595–2599. doi: 10.1021/ac990231s. [DOI] [PubMed] [Google Scholar]
- 8.Meot-Ner (Mautner) M, Dongré AR, Somogyi Á, Wysocki VH. Rapid Commun Mass Spectrom. 1995;9:829–836. doi: 10.1002/rcm.1290090922. [DOI] [PubMed] [Google Scholar]
- 9.Hunt DF, Yates JR, III, Shabanowitz J, Winston S, Hauer CR. Proc Natl Acad Sci USA. 1986;83:6233–6237. doi: 10.1073/pnas.83.17.6233. [DOI] [PMC free article] [PubMed] [Google Scholar]
- 10.Huddleston MJ, Bean MF, Carr SA. Anal Chem. 1993;65:877. doi: 10.1021/ac00055a009. [DOI] [PubMed] [Google Scholar]
- 11.Valaskovic GA, Kelleher NL, McLafferty FW. Science. 1996;273:1199–1202. doi: 10.1126/science.273.5279.1199. [DOI] [PubMed] [Google Scholar]
- 12.Cody RB, Jr, Amster IJ, McLafferty FW. Proc Natl Acad Sci USA. 1985;82:6367–6370. doi: 10.1073/pnas.82.19.6367. [DOI] [PMC free article] [PubMed] [Google Scholar]
- 13.Smith RD, Barinaga CJ, Udseth HR. J Phys Chem. 1989;93:5019–5022. [Google Scholar]
- 14.Senko MW, Speir JP, McLafferty FW. Anal Chem. 1994;66:2801–2808. doi: 10.1021/ac00090a003. [DOI] [PubMed] [Google Scholar]
- 15.Williams ER, Henry KD, McLafferty FW, Shabanowitz J, Hunt DF. J Am Soc Mass Spectrom. 1990;1:413–416. doi: 10.1016/1044-0305(90)85022-E. [DOI] [PubMed] [Google Scholar]
- 16.Chorush RA, Little DP, Beu SC, Wood TD, McLafferty FW. Anal Chem. 1995;67:1042–1046. doi: 10.1021/ac00102a004. [DOI] [PubMed] [Google Scholar]
- 17.McCormack AL, Somogyi A, Dongré AR, Wysocki VH. Anal Chem. 1993;65:2859–2872. doi: 10.1021/ac00068a024. [DOI] [PubMed] [Google Scholar]
- 18.Bier ME, Schwartz JC, Schey KL, Cooks RG. Int J Mass Spectrom Ion Processes. 1990;103:1–19. [Google Scholar]
- 19.Dongre AR, Somogyi A, Wysocki VH. J Mass Spectrom. 1996;31:339–350. doi: 10.1002/(SICI)1096-9888(199604)31:4<339::AID-JMS322>3.0.CO;2-L. [DOI] [PubMed] [Google Scholar]
- 20.Zubarev RA, Kelleher NL, McLafferty FW. J Am Chem Soc. 1998;120:3265–3266. [Google Scholar]
- 21.Price WD, Schnier PD, Williams ER. Anal Chem. 1996;68:859–866. doi: 10.1021/ac951038a. [DOI] [PubMed] [Google Scholar]
- 22.Schnier PD, Price WD, Strittmatter EF, Williams ER. J Am Soc Mass Spectrom. 1997;8:771–780. doi: 10.1016/S1044-0305(97)84129-3. [DOI] [PMC free article] [PubMed] [Google Scholar]
- 23.Schnier PD, Price WD, Jockusch RA, Williams ER. J Am Chem Soc. 1996;118:7178–7189. doi: 10.1021/ja9609157. [DOI] [PMC free article] [PubMed] [Google Scholar]
- 24.Jockusch RA, Schnier PD, Price WD, Strittmatter EF, Demirev PA, Williams ER. Anal Chem. 1997;69:1119–1126. doi: 10.1021/ac960804q. [DOI] [PMC free article] [PubMed] [Google Scholar]
- 25.Price WD, Schnier PD, Jockusch RA, Strittmatter EF, Williams ER. J Am Chem Soc. 1996;118:10640–10644. doi: 10.1021/ja961812r. [DOI] [PMC free article] [PubMed] [Google Scholar]
- 26.Gross DS, Zhao Y, Williams ER. J Am Soc Mass Spectrom. 1997;8:519–524. doi: 10.1016/S1044-0305(97)00010-X. [DOI] [PMC free article] [PubMed] [Google Scholar]
- 27.Schnier PD, Klassen JS, Strittmatter EF, Williams ER. J Am Chem Soc. 1998;120:9605–9613. doi: 10.1021/ja973534h. [DOI] [PMC free article] [PubMed] [Google Scholar]
- 28.Marshall, A. G.; Hendrickson, C. L.; Emmett, M. R.; Eyler, J. R. Proceedings of the 46th ASMS Conference on Mass Spectrometry and Allied Topics, 1998; p 44.
- 29.Freitas MA, Hendrikson CL, Marshall AG. Rapid Commun Mass Spectrom. 1999;13:1639–1642. doi: 10.1002/(SICI)1097-0231(19990815)13:15<1639::AID-RCM691>3.0.CO;2-S. [DOI] [PubMed] [Google Scholar]
- 30.Little DP, Speir JP, Senko MW, O’Connor PB, McLafferty FW. Anal Chem. 1994;66:2809–2815. doi: 10.1021/ac00090a004. [DOI] [PubMed] [Google Scholar]
- 31.Stephenson, J. L., Jr.; Booth, M. M.; Boue, S. M.; Eyler, J. R.; Yost, R. A. In Biochemical and Biotechnical Applications of Electrospray Ionization Mass Spectrometry; Snyder, A. P., Ed.; Academic Press: San Diego, 1996; pp 512–564.
- 32.Guan ZQ, Kelleher NL, O’Connor PB, Aaserud DJ, Little DP, McLafferty FW. Int J Mass Spectrom Ion Processes. 1996;158:357–364. [Google Scholar]
- 33.Armentrout PB, Baer T. J Phys Chem. 1996;100:12866–12877. [Google Scholar]
- 34.McLuckey SA, Goeringer DE. J Mass Spectrom. 1997;32:461–474. [Google Scholar]
- 35.Price WD, Williams ER. J Phys Chem A. 1997;101:8844–8852. doi: 10.1021/jp9722418. [DOI] [PMC free article] [PubMed] [Google Scholar]
- 36.Price WD, Schnier PD, Williams ER. J Phys Chem B. 1997;101:664–673. doi: 10.1021/jp9628702. [DOI] [PMC free article] [PubMed] [Google Scholar]
- 37.Jockusch RA, Williams ER. J Phys Chem A. 1998;102:4543–4550. doi: 10.1021/jp980264w. [DOI] [PMC free article] [PubMed] [Google Scholar]
- 38.Asano KG, Goeringer DE, McLuckey SA. Int J Mass Spectrom. 1999;187:207–219. [Google Scholar]
- 39.Lim HJ, Schultz DG, Yu CW, Hanley L. Anal Chem. 1999;71:2307–2317. doi: 10.1021/ac981411p. [DOI] [PubMed] [Google Scholar]
- 40.Tonner DS, McMahon TB. Anal Chem. 1997;69:4735–4740. doi: 10.1021/ac970727e. [DOI] [PubMed] [Google Scholar]
- 41.Thorne, L. R.; Beauchamp, J. L. In Gas-Phase Ion Chemistry; Bowers, M. T., Ed.; Academic Press: Orlando, 1984; Vol. 3, pp 41–97.
- 42.Bomse DS, Woodin RL, Beauchamp JL. J Am Chem Soc. 1979;101:5503–5512. [Google Scholar]
- 43.Thorne LR, Beauchamp JL. J Chem Phys. 1981;74:5100–5105. [Google Scholar]
- 44.Dunbar RC. J Chem Phys. 1991;95:2537–2547. [Google Scholar]
- 45.Uechi GT, Dunbar RC. J Chem Phys. 1992;96:8897–8905. [Google Scholar]
- 46.Jockusch, R. A.; Paech, K.; Williams, E. R. Proceedings of the 47th ASMS Conference on Mass Spectrometry and Allied Topics, 1999; p 2566.
- 47.Bailey LE, Navarro R, Hernanz A. Biospectroscopy. 1997;3:47–59. [Google Scholar]
- 48.El-Azhary AA, Suter HU, Kubelka J. J Phys Chem A. 1998;102:620–629. [Google Scholar]
- 49.Schnier PD, Jurchen JC, Williams ER. J Phys Chem B. 1999;103:737–745. doi: 10.1021/jp9833193. [DOI] [PMC free article] [PubMed] [Google Scholar]
- 50.Vachet RW, Ray KL, Glish GL. J Am Soc Mass Spectrom. 1998;9:341–344. doi: 10.1016/S1044-0305(98)00008-7. [DOI] [PubMed] [Google Scholar]


