Intimately associated with DNA, histone proteins serve as both a structural scaffold for DNA packaging into the nucleus and an epigenetic means for the regulation of gene expression. One such histone-based mechanism for transcriptional regulation is posttranslational modification (PTM) of histones H2A, H2B, H3, and H4.1,2 Combinations of modifications such as acetylation, methylation, and phosphorylation create a “Histone Code” that influences gene transcription, gene silencing, and chromatin formation.3–5 Essential for complete understanding of this code is an efficient methodology for detection, exact localization, and quantitation of modifications at specific sites. We combine here gas-phase concentration and purification6 inside a quadrupole-FTMS hybrid (Q-FTMS) with top down fragmentation using electron capture dissociation (ECD)7,8 and large-scale PTM prediction. This prediction uses a new type of protein database that has been “shotgun annotated” by assigning site-specific posttranslational modifications (and all their combinations) prior to searching for best matches with ECD data. The approach considers PTMs during a database search and enables complete and automated characterization of human histones harboring 2–6 PTMs from asynchronous and butyrate-treated HeLa cells.
With its sequence and modification sites extensively studied, human histone H4 was chosen as a model. We generated all possible protein forms by combinatorial modification of the seven known sites1,2 according to following rules: arginine 3 can be mono- or dimethylated, lysines 5, 8, 12, 16, and 20 can be mono-, di-, trimethylated or acetylated, and serine 1 can be phosphorylated. For a given rule set, the possible number of protein forms was calculated by the following equation:
where ni is the number of possible PTMs for amino acid i, and fi is the number of occurrences of amino acid i in the sequence allowed to be modified. For histone H4, this generated 31 × 55 × 21 = 18 750 protein forms. Consideration of possible N-terminal acetylation and start methionine on/off increased the total to 46 875. Perl scripts were written to populate all these protein forms into a relational database (7.8 megabyte, MySQL) stored within the architecture of ProSight PTM, a software environment designed for Top Down Proteomics.9 Database searches (typically <6 min) were executed with MS/MS data from particular histone forms using ProSight Retriever, an algorithm for probability-based protein identification.9
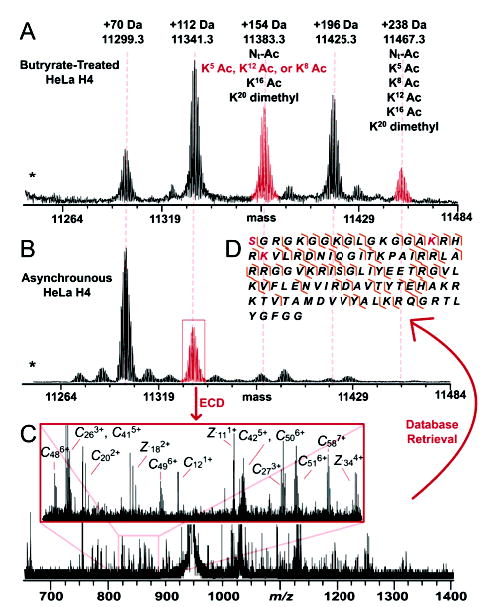
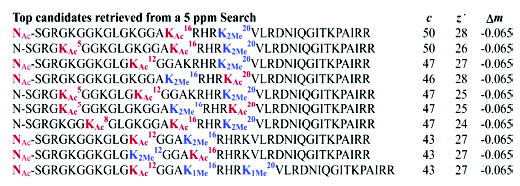
An ESI/Q-FTMS spectrum of acid-extracted and RPLC-purified histone H410 from asynchronous human HeLa cells revealed many potentially modified forms (Figure 1b). An MS/MS spectrum from ECD of a species +112 Da above unmodified H4 gave 91 observed fragment ion masses (Figure 1c). The calibrated fragment ion masses were used to probe the heavily annotated database using tolerances of 5, 15, and 25 ppm (Supporting Information Table 1) with the top 10 hits from the 5 ppm search shown in Figure 2. Of the 91 fragment ions, 50 and 28 match c and z• ions, respectively (Supporting Information Table 2), and the overall mass difference (Δm) of +112.05 Da is consistent with the experimental Mr value within 2 ppm. The best match atop the retrieval list is histone H4 with an N-terminal acetylation, Lys16 acetylation, and Lys20 dimethylation. Detailed validation of these three PTMs was done manually. Other highly ranked histone forms include those with two exactly correct modifications, and one of correct identity but incorrect position between the amino-terminus and Lys20. Such positional “isomers” between the top-scoring form and the next-best forms are discerned by a few critical fragment ions. For example, two and four matching fragment ions are lost for the second and third best hits, respectively, confidently discounting their presence. With all top 10 hits having two acetylations and two methylations, cleaving the protein backbone between each PTM site is critical to achieve complete protein characterization.11 Thus, the top candidate in Figure 2 best fits the 91 c/z• fragment ions, with 12 of these putative matches, but having >5 ppm errors. The presence of PTM “regioisomers” in the retrieval list increases confidence in PTM detection, with the degree of localization ultimately defined by the raw MS/MS data itself. Using threshold MS/MS data from infrared dissociation of the +112 Da form, histone H4 was cleaved in only 26 of 114 backbone sites (data not shown). With only three ions coming from cleavages in the N terminus, the data are consistent with the highest ranking candidate in Figure 2 but also many others.
Figure 1.

(A) ESI/FT mass spectrum (15 scans) of intact H4 isolated from the butyrate-treated HeLa cells (scale set to mass for 12+ ions). An asterisk (*) denotes the position of the unobserved, unmodified histone H4. (B) ESI/FT mass spectrum (40 scans) of intact H4 isolated from the nuclei of asynchronous HeLa cells (scale set to mass for 12+ ions). (C) ECD MS/MS spectrum (107 scans) of a +112 Da modified form of histone H4. (D) ECD fragmentation map of histone H4 +112 Da after streamlined protein characterization achieved by retrieval from a highly annotated database. The best match from the database search is N-terminal acetylation, K16 acetylation, and K20 dimethylation (highlighted in red).
Figure 2.

Top 10 matches from an entire database search with 5 ppm tolerance. A total of 37 histone forms with >65 matching fragment ions were returned during this search; methylation is depicted in blue, while acetylation is in red.
The conversion of high mass accuracy into database retrieval specificity is especially important for highly annotated databases. Restricting mass tolerances from 25 to 15 to 5 ppm returned 878, 830, and 37 histone forms with >65 matching fragment ions (Supporting Information Table 1). The striking 95.8% drop between 25 and 5 ppm is attributed primarily to the differentiation of acetylation vs trimethylation of lysines which have the same nominal Δm but differ in their mass defects by 36 mDa.
Our data in addition to other studies12 report that multiply acetylated H4 occurs at very low abundance in asynchronously grown HeLa cells. To enrich these higher mass forms, HeLa cells were treated with the nonspecific histone deacetylase inhibitor sodium butyrate,13 and histone H4 was interrogated by ESI/Q-FTMS as before. Many higher-mass forms were observed (Figure 1a), and ECD was performed on the +238 Da and +154 Da species, generating 62 and 116 fragment ions, respectively (MS/MS data not shown).14 At 5 ppm, the highest-scoring form (44 matching c/z• ions) for the +238 Da species contained acetylation at the N terminus, K5, K8, K12, and K16 as well as dimethylation at K20. These six PTMs precisely account for the overall Δm and were verified manually. However, after querying the database with the +154 Da species’ fragment ions, the top three matches were an N-terminal acetylation, K16 acetylation, and K20 dimethylation, with an acetylation at either K8, K12, or K5. For each of these three PTM isomers, a high number of fragment ions matched (73, 72, and 70, respectively). The presence of the K8 species cannot be validated with the current data. This is because some localization-critical fragment ions (e.g., the c9) that match both the K12 and K5 species are consistent with the presence of a K8 isomer even in its absence. The presence of acetyl-K8 could be addressed by careful abundance measurements of key fragment ions or preferably MS3.
In preparation for shotgun annotation of other histones and proteins in other functional classes, larger databases comprising shotgun annotated H2A, H2B, and H3 were created, yielding sizes of 89, 113, and 1.35 GB, respectively. Searches of such larger databases will require ECD data of the highest quality and offer a method complementary to existing PTM detection using antibodies15 and bottom up MS16 for streamlined elucidation of the Histone Code. For proteomic-scale databases dealing with polymorphisms and alternative splicing via shotgun annotation, the approach described here will require alteration to realize applicability in eukaryotic proteome projects. Placing only the knowledge of biological variability within the database (verses the extensive pre-prediction used here) is ultimately a superior approach and avoids creation of large databases. An algorithm would then calculate PTM possibilities on-the-fly (e.g. after a sequence tag search) to best match the observed data.9
In sum, the 105 resolving power of FTMS in MS/MS mode combined with the increased populations of precursor ions afforded by the quadrupole preconcentrator makes Q-FTMS/MS using ECD the best instrumental configuration to couple with shotgun annotation. The overall efficiency for measurement of PTM combinations first demonstrated here represents a new advance for chemical-level description of multiply modified proteins by mass spectrometry.
Acknowledgments
We thank Craig Mizzen, Robert Skeel, Geneva Belford, Steven Patrie, Michael Roth, and Andy Forbes for technical assistance. J.J.P. was supported on an NIH Institutional NRSA in Molecular Biophysics (5T32 GM 08276), and the laboratory of N.L.K., by the National Institutes of Health (GM 067193).
Footnotes
Supporting Information Available: Results from 25 informatic control experiments and tabulated fragment ions/search results for the +112, +154, and +238 Da forms of histone H4 (PDF). This material is available free of charge via the Internet at http://pubs.acs.org.
References
- 1.Jaskelioff M, Peterson CL. Nat Cell Biol. 2003;5:395–399. doi: 10.1038/ncb0503-395. [DOI] [PubMed] [Google Scholar]
- 2.Felsenfeld G, Groudine M. Nature. 2003;421:448–453. doi: 10.1038/nature01411. [DOI] [PubMed] [Google Scholar]
- 3.Krogan NJ, Kim M, Tong A, Golshani A, Cagney G, Canadien V, Richards DP, Beattie BK, Emili A, Boone C, Shilatifard A, Buratowski S, Greenblatt J. Mol Cell Biol. 2003;23:4207–4218. doi: 10.1128/MCB.23.12.4207-4218.2003. [DOI] [PMC free article] [PubMed] [Google Scholar]
- 4.Fernandez-Capetillo O, Mahadevaiah SK, Celeste A, Romanienko PJ, Camerini-Otero RD, Bonner WM, Manova K, Burgoyne P, Nussenzweig A. Dev Cell. 2003;4:497–508. doi: 10.1016/s1534-5807(03)00093-5. [DOI] [PubMed] [Google Scholar]
- 5.Santos-Rosa H, Schneider R, Bannister AJ, Sherriff J, Bernstein BE, Emre NC, Schreiber SL, Mellor J, Kouzarides T. Nature. 2002;419:407–411. doi: 10.1038/nature01080. [DOI] [PubMed] [Google Scholar]
- 6.Reid GE, Shang H, Hogan JM, Lee GU, McLuckey SA. J Am Chem Soc. 2002;126:7353–7362. doi: 10.1021/ja025966k. [DOI] [PubMed] [Google Scholar]
- 7.Zubarev RA, Kelleher NL, McLafferty FW. J Am Chem Soc. 1998;120:3265–3266. [Google Scholar]
- 8.Ge Y, Lawhorn BG, ElNaggar M, Strauss E, Park JH, Begley TP, McLafferty FW. J Am Chem Soc. 2002;124:672–678. doi: 10.1021/ja011335z. [DOI] [PubMed] [Google Scholar]
- 9.Taylor GK, Kim YB, Forbes AJ, Meng F, McCarthy R, Kelleher NL. Anal Chem. 2003;75:4081–4086. doi: 10.1021/ac0341721. [DOI] [PubMed] [Google Scholar]
- 10.Chadee DN, Hendzel MJ, Tylipski CP, Allis CD, Bazett-Jones DP, Wright JA, Davie JR. J Biol Chem. 1999;274:24914–24920. doi: 10.1074/jbc.274.35.24914. [DOI] [PubMed] [Google Scholar]
- 11.Sze SK, Ge Y, Oh H, McLafferty FW. Proc Natl Acad Sci U.S.A. 2002;99:1774–1779. doi: 10.1073/pnas.251691898. [DOI] [PMC free article] [PubMed] [Google Scholar]
- 12.Zhang K, Williams KE, Huang L, Yau P, Siino JS, Bradbury EM, Jones PR, Minch MJ, Burlingame AL. Mol Cell Proteomics. 2002;1:500–508. doi: 10.1074/mcp.m200031-mcp200. [DOI] [PubMed] [Google Scholar]
- 13.Boffa LC, Vidal G, Mann RS, Allfrey VG. J Biol Chem. 1978;253:3364–3366. [PubMed] [Google Scholar]
- 14.The higher number of fragment ions observed for the +154 vs the +238 Da species is attributed to the former being higher in abundance in butyrate-treated cells and because it is a mixture of 2–3 acetylation isomers. Fragment ion spectra were internally calibrated using unmodified z• ions before database searching.
- 15.Briggs SD, Xiao T, Sun ZW, Caldwell JA, Shabanowitz J, Hunt DF, Allis CD, Strahl BD. Nature. 2002;418:498. doi: 10.1038/nature00970. [DOI] [PubMed] [Google Scholar]
- 16.Zhang L, Eugeni EE, Parthun MR, Freitas MA. Chromosoma. 2003;112:77–86. doi: 10.1007/s00412-003-0244-6. [DOI] [PubMed] [Google Scholar]


