

Abstract
Purpose
To investigate the magnetic field dependence of the signal-to-noise ratio (SNR) for carotid vessel wall magnetic resonance imaging (MRI) using phased-array (PA) surface coils by comparing images obtained at 1.5 T and 3 T, and to determine to what extent the improved SNR at the higher field can be traded for improved spatial resolution.
Materials and methods
Two pairs of dual-element PA coils were constructed for operation at the two field strengths. The individual elements of each PA were matched to 50 Ω impedance on the neck and tuned at the respective frequencies. The coils were evaluated on a cylindrical phantom positioned with its axis parallel to the main field, and with the coils placed on either side of the phantom parallel to the sagittal plane. In-vivo MR images of the carotid arteries were obtained in five subjects at both field strengths with a fast spin-echo double-inversion black-blood pulse sequence with fat saturation. SNR was measured at both field strengths using standard techniques.
Results
At a depth corresponding to the average location of the carotid arteries in the study subjects, mean phantom SNR for the two coils was higher at 3 T by a factor of 2.5. The greater than linear increase is due to only partial coil loading of these relatively small coils. The practically achievable average SNR gain in vivo was 2.1. The lower in vivo SNR gain is attributed to a reduction in T2 and prolongation of T1 at the higher field strength and, to a lesser extent, the requirement for reduced refocusing pulse flip angle to operate within specific absorption ratio limits. The superior SNR at 3 T appears to provide considerably improved vessel wall delineation.
Conclusions
Carotid artery vessel wall MRI using phased-array surface coils provides a considerable increase in SNR when field strength is raised from 1.5 T to 3 T. This increase can be traded for enhanced in-plane resolution.
Keywords: high field MRI, 3 T, carotid arteries, phased array coils, SNR
INTRODUCTION
Carotid atherosclerosis is a disease characterized by plaque formation at the carotid bifurcation, leading to vascular stenosis and eventually to stroke, one of the leading causes of death in the industrialized world. Quantification of plaque volume and content is important as a means for risk assessment and monitoring of treatment with lipid-lowering drugs [1]. High-resolution MRI of carotid vessel wall is emerging as a powerful noninvasive diagnostic tool for assessing atherosclerotic disease burden. However, the method is demanding since it requires SNR sufficient to image at sub-millimeter pixel size for exact delineation of plaque architecture. Depending on the thickness of the subcutaneous fat layer near the bifurcation the artery is located at a depth of 20 – 40 mm from the surface of the neck in most subjects, hence surface coil reception results in higher SNR than imaging with a head or neck coil. It had been shown previously that it is advantageous to position the coil array such that the coils are arranged transversely around the neck [2], a design which was also adopted in this work.
Several reports of vessel wall imaging dealing with optimization of size and geometry for receive-only PA surface coils at 1.5 T are available in the literature [2,3]. However, there have not been rigorous studies at fields above 1.5 T to evaluate the benefits and limitations of high-field imaging of the carotid arteries, except in abstract form [4,5]. Higher field strength increases the achievable SNR (typically about linearly), which can be utilized to achieve higher spatial resolution without compromising SNR or, alternatively, to reduce the effective scan time at given SNR. An effective doubling of SNR would obviously allow reduction in scan time by a factor of 4 or, alternatively, at a given SNR, allow to increase the in-plane resolution by a factor of √2.
In this article we evaluate the practically achievable gain in SNR from doubling of the static field as a means to improve vessel wall delineation and show that this gain can be traded for enhanced resolution. This improved resolution should therefore allow for more accurate measurement of intimal thickening in early-stage atherosclerosis although no vessel wall thickness comparisons were made at this stage.
MATERIALS AND METHODS
To preclude subject-dependent effects on SNR, experiments were first conducted on a cylindrical phantom of 18 cm diameter. Subsequently data were acquired at 1.5 T and 3 T in five volunteers. Imaging was performed on whole-body scanners at 63.64 MHz (1.5 T Siemens Sonata) and 123.22 MHz (3.0 T Siemens Trio). Both systems were equipped with 40 mT/m gradients. Transmission was done with the body coil. For reception, two pairs of custom-built, receive-only, dual phased-array (PA) coils were used. The PA coils were constructed to allow for bilateral carotid artery imaging at the two field strengths. Each of the PAs consisted of two individual square elements (5 cm x 5 cm). The conductive loop was etched from a copper-clad Teflon sheet. The individual elements were tuned to the respective frequencies and matched to 50 Ω impedance on the human neck. The two elements in each phased array were secured to plastic forms and overlapped suitably to decouple the magnetic interactions between them. The overall dimensions of each phased-array pair were 5 cm x 8.6 cm (Fig. 1). In addition, the individual elements were decoupled from the transmit coil with a high-impedance blocking network activated by a diode during RF transmit [2]. The coils were tested initially on a cylindrical phantom containing saline doped with NiSO4, with the long axis of the phantom parallel to the static field and the PA coils placed on either side of the phantom such that their length (8.6 cm) followed the curvature of the cylinder. The arrangement of the coils on the phantom is shown in Fig. 2a. A turbo spin-echo pulse sequence (turbo factor 17) preceded by a double-inversion preparation phase [6] was used. The field of view was 18 cm x 18 cm with a matrix size of 256 x 256, yielding an in-plane resolution of 0.70 mm x 0.70 mm pixel size. Additional scan parameters were: Slice thickness 2 mm, receiver bandwidth 250 Hz/pixel, pulse repetition time (TR) and echo time (TE) 2000 ms and 8.7 ms, respectively. These parameters (except FOV and TR) are consistent with the presently used 1.5 T clinical protocol at the authors’ institution. In the phantom experiments the signal was measured from a profile on a coronal slice along an axis passing through the center of the coils (Fig. 2b). The noise was determined from the mean of four regions of interest (ROI) in the image background and the variation of SNR at different depths from the surface of the coils recorded.
FIGURE 1.
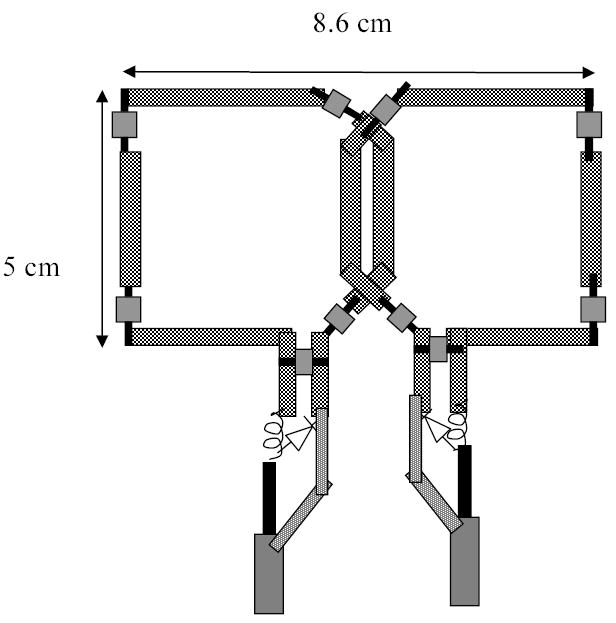
Dual-element phased-array surface coil, representing half of a bilateral pair, custom-built for imaging the carotid vessel wall, with decoupling circuits indicated.
FIGURE 2.

a) Cylindrical phantom with the coils on either side showing the axis along which the signal profile was obtained. b) SNR profile along the axis shown in a).
Further, five healthy volunteers (mean age 40 ± 13), after having given informed consent, underwent the same scan protocol (double-inversion black-blood pulse sequence with fat saturation) at both field strengths. The scan plane was axial and the imaging parameters were essentially identical to the one used in the phantom study except that cardiac gating was used (TR = 2RR intervals) at a field of view of 12 cm x 12 cm. For these in vivo images, the signal was measured on a profile on the vessel wall. Since the vessel wall is only about 1.5 mm thick, assessment of the vessel wall SNR is prone to error. Therefore, additional signal measurements were made from different ROIs in the sternocleidomastoid muscle adjacent to the vessel wall. Since cross-sectional images of the neck often occupy the entire FOV, measurement of the background noise is difficult. Hence to obtain a signal-free region for noise measurement at each field strength and resolution, a single slice was additionally obtained with a larger field of view in the frequency-encode direction (FOV = 24 cm x 12 cm; matrix size = 512 x 256), maintaining the same bandwidth/pixel so that the image SNR is not affected. The noise was estimated as the mean intensity of four ROIs in the background of these magnitude images and SNR obtained as the ratio of signal to ROI noise but no correction was made for the Raleigh characteristics of magnitude noise [7].
RESULTS
Coil loading (both phantom and in vivo) was found to be dominated by different relative impedances at the two fields. The ratios of the loaded to unloaded quality factor (QL/QU) of the coils at the higher field (3.0T) was about 0.46 and was found to be less than that at the lower field (1.5 T), which was about 0.75. These data indicate that at 3 T the noise is sample dominated whereas at 1.5 T contributions from the circuit and sample are comparable. At a depth of about 2.25 cm from the surface of the phantom (average location of the arteries in the neck of the five volunteers examined) the mean SNR for the two coils at 3 T was found to be 157.5 ± 6.72 versus 63.2 ± 0.4 at 1.5 T, corresponding to a gain of 2.49.
The in vivo axial images obtained with the clinical protocol used at 1.5 T (pixel size 0.47 x 0.47 mm2) in one subject are shown in Fig. 3a and Fig. 3b. The average SNR obtained at 3 T was 17.6 ± 1.8 and 14.8 ± 2.7 while at 1.5T it was 8.6 ± 1.1 and 7.0 ± 1.0 for the left and right coils respectively, which is less than the values measured in the phantom. This resulted in a mean gain of 2.09. The standard deviations were calculated from the average SNR measured in five subjects. The possible reasons for the discrepancies between phantom and human subject scans are discussed below.
FIGURE 3.
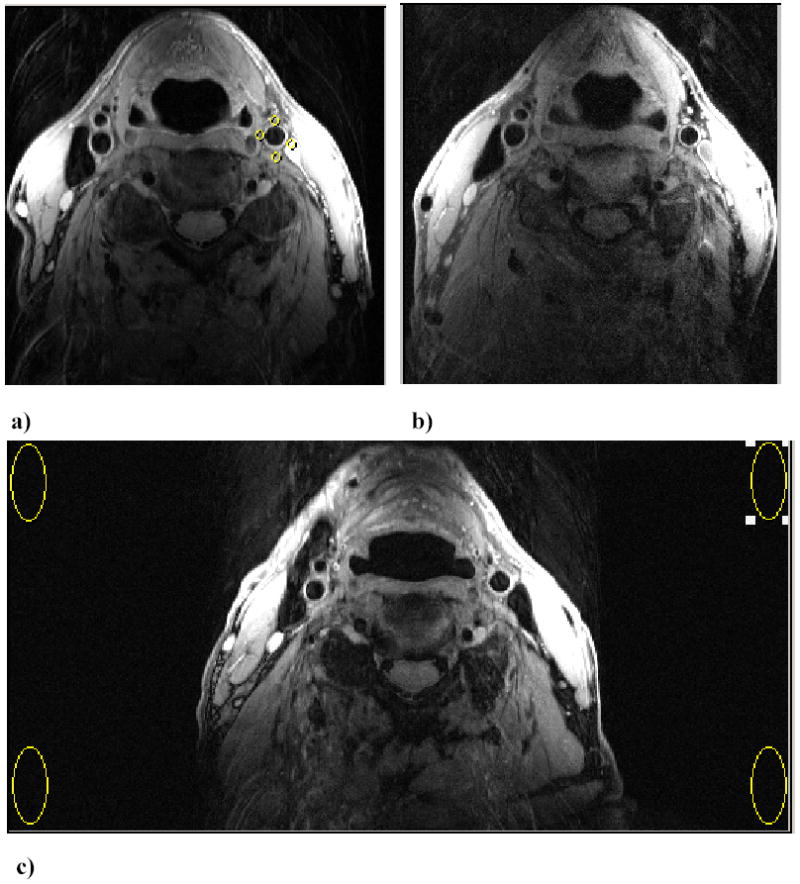
Axial images of the carotid arteries at approximately 0.8cm distal to the right carotid bifurcation in one subject showing the improved SNR at a) 3 T compared to b) 1.5 T. (FOV = 12 cm x 12 cm; matrix size = 256 x 256; Pixel size = 0.47 x 0.47 mm2). The typical signal measurements in the adjacent muscles are shown by the ROIs. c) Measurement of noise level by increasing FOV (24 cm x 12cm) to allow measurement in a region devoid of phase-encoding ghosting (Matrix 512 x 256). Noise is estimated as mean of signal from 4 ROIs in the image background.
A potential benefit of the higher intrinsic SNR at 3 T is to allow imaging at higher spatial resolution without loss in SNR. Fig. 4 illustrates this potential with images acquired at a pixel size of 0.31 x 0.31 mm2 in three subjects as compared to the routine clinical resolution of 0.47 x 0.47 mm2, with all remaining parameters being the same including slice thickness. As can be seen in the magnified portion of the carotid arteries in (b) and (c), the images acquired at higher pixel resolution (0.31 x 0.31 mm2) suffer no appreciable loss of clarity at 3 T, but are noticeably more grainy at 1.5 T. Specifically, there is significantly improved vessel wall delineation at 3 T compared to 1.5 T by virtue of the greater contrast-to-noise ratio at the higher field strength.
FIGURE 4.

Effect of reduced pixel size in magnified carotid artery in three subjects below (top row), at (center row), and above (bottom row) the bifurcation: a) 3 T, pixel size 0.47 x 0.47 mm2; b) 3 T, pixel size 0.31 x 0.31 mm2; c) 1.5 T, pixel size same as in b).
DISCUSSION
Signal- to-Noise Ratio
The induced signal strength in MR imaging is proportional to the square of the Larmor frequency, ωo. The root mean square (rms) noise voltage also depends on ωo. At high frequencies (usually above 0.5 T [8], except for very small RF coils [9]), the noise voltage is sample dominated and is proportional to ωo, hence resulting in SNR that scales linearly with ωo. Conversely, at lower frequencies, the noise is often circuit-dominated (coil and associated electronics) and thus scales as ωo1/4, resulting in SNR that is proportional to ωo7/4. Thus, assuming all parameters except field strength to be the same, the theoretical gain in SNR with increasing field strength can be greater than linear for relatively small receive coils, depending on the field of operation and hence the impedance of the whole system. This is clearly substantiated by the present phantom results. However, the practically realizable benefit of high field in vivo can also depend on the allowable peak power deposition in human tissue (which is significant for pulse sequences using repeated refocusing pulses). Additionally, increased static field and RF inhomogeneity across the sample, increased susceptibility artifacts along with exclusive parameter non-optimization for pulse sequences due to varying relaxation parameters may adversely affect SNR at higher field and may account for the observed discrepancies between the phantom and in vivo SNR.
Specific Absorption Ratio (SAR)
Specific absorption rate (SAR) is a measure of the amount of heat deposited in the body due to the application of RF pulses. The RF power absorbed by the biological tissue increases with static magnetic field. Theory predicts a square law dependence of SAR on field strength at lower strength values and a slightly weakened dependence at higher values, which has also been verified experimentally [10–12]. Among many methods to reduce SAR, some particularly relevant to echo-train imaging sequences such as the turbo spin-echo (TSE) include: lowering the flip angle of the refocusing pulses and hence reducing the power deposited by them [13,14], stretching the rf pulses, reshaping [15] and modulating the refocusing flip angle throughout the echo train [16]. Reduction of the refocusing flip angle results in a complex signal from stimulated and spin-echo coherence pathways with mixed T1 and T2 contrast [14]. Stretching the refocusing pulses leads to decreased bandwidths and hence can result in increased chemical shift artifacts. For proton-density weighted imaging, in which the earlier echoes determine image contrast, SNR is typically reduced. Pulse stretching leads to longer echo-spacing and hence exacerbates the effects of relaxation throughout the echo train. Though SAR was not an issue at 1.5 T, the RF power deposited in the tissue exceed the SAR limitations at 3 T, requiring the refocusing flip angle to be reduced in two of the subjects to about 160o, resulting in slightly lower image SNR. We estimate the resulting loss in SNR, based on measurements in the phantom to be about 10%. Since reduced flip angle was required in only two of the subjects, this would, however, explain at most 5% of the reduction in average SNR gain observed in vivo.
Relaxation Parameters
The second possible cause of the lower SNR gain in vivo than in the phantom experiments is the difference between the relaxation times at the two field strengths. The known field strength dependence of relaxation times suggests that the spin-lattice relaxation times (T1) for water in various tissues as well as blood increase and converge at higher fields [17–19]. Further, the induced inhomogeneous field caused by local susceptibility differences increases linearly with field strength and hence the spin-spin relaxation times (T2) shorten (the likely mechanism being diffusion in local field gradients [20]). The reduced T2 could also cause some blurring necessitating increased acquisition bandwidths at higher fields. Field-dependent relaxation therefore requires parameter optimization at higher fields. Increased tissue requires increased TR for the double-inversion sequence at 3 T. In the present work the same protocol was used at both fields (TR = 2RR intervals) to hold the total scan time constant. Alternatively, increasing TR at 3 T would result in an increase in acquisition time, essentially reducing the sensitivity gain/unit time, thus foregoing the basic advantage of reduction of the scan time for given resolution at high fields. Assuming that muscle T1 increases by approximately 50% at 3 T compared to 1.5 T and that T2 decreases by approximately 10% (values interpolated based on a comparison between 1.5 and 4T [21]) the decrease in the in vivo SNR gain at 3 T relative to 1.5 T can be roughly estimated to be about 20% with the TR and TE of the protocol used in the present studies for an average heart rate of 80 bpm.
CONCLUSIONS
Black-blood imaging in a tissue-equivalent phantom at 3 T in combination with phased array coils results in a greater than a linear increase of SNR relative to 1.5T. This gain in SNR is slightly reduced in vivo but remains above linear and is shown to allow improved delineation of neck vessel wall anatomy at 3 T.
Acknowledgments
This work was supported by NIH Grants T32-EB000814 and RO1 HL68908
The authors are indebted to Dr. Thomas Connick for advice with coil construction.
Footnotes
Work was presented in preliminary form at the 12th Scientific Meeting of the ISMRM, Kyoto, 2004.
Contributor Information
SeshaSailaja. Anumula, Laboratory for Structural NMR Imaging, Department of Radiology, University of Pennsylvania Health System, Philadelphia, PA, USA Sailaja.Anumula@uphs.upenn.edu.
Hee Kwon Song, Laboratory for Structural NMR Imaging, Department of Radiology, University of Pennsylvania Health System, Philadelphia, PA, USA hsong@uphs.upenn.edu.
Alexander C. Wright, Laboratory for Structural NMR Imaging, Department of Radiology, University of Pennsylvania Health System, Philadelphia, PA, USA WrightAl@uphs.upenn.edu.
Felix W. Wehrli, Laboratory for Structural NMR Imaging, Department of Radiology, University of Pennsylvania Health System, Philadelphia, PA, USA WehrliF@uphs.upenn.edu.
References
- 1.Fayad ZA, Fuster V, Fallon JT, et al. Noninvasive in vivo human coronary artery lumen and wall imaging using black-blood magnetic resonance imaging. Circulation. 2000;102(5):506–510. doi: 10.1161/01.cir.102.5.506. [DOI] [PubMed] [Google Scholar]
- 2.Hayes CE, Mathis CM, Yuan C. Surface coil phased arrays for high-resolution imaging of the carotid arteries. J Magn Reson Imaging. 1996;6(1):109–112. doi: 10.1002/jmri.1880060121. [DOI] [PubMed] [Google Scholar]
- 3.Liffers A, Quick HH, Herborn CU, Ermert H, Ladd ME. Geometrical optimization of a phased array coil for high-resolution MR imaging of the carotid arteries. Magn Reson Med. 2003;50(2):439–443. doi: 10.1002/mrm.10526. [DOI] [PubMed] [Google Scholar]
- 4.Terashima M, Nguyen PK, Yarnykh VL, et al. Carotid Plaque Imaging at 1.5T and 3T: Systematic SNR Comparison. Proc Intl Soc Mag Reson Med. 2004;11:1910. [Google Scholar]
- 5.Yarnykh VL, Hayes CE, Shimakawa A, et al. High-resolution Black-blood MRI of Carotid Atherosclerotic Plaque at 3T: Optimization of Clinical Protocol. Proc Intl Soc Mag Reson Med. 2004;12:1912. [Google Scholar]
- 6.Edelman RR, Chien D, Kim D. Fast selective black blood MR imaging. Radiology. 1991;181(3):655–660. doi: 10.1148/radiology.181.3.1947077. [DOI] [PubMed] [Google Scholar]
- 7.Henkelman RM. Measurement of Signal Intensities in the Presence of Noise in Mr Images. Med Phys. 1985;12(2):232–233. doi: 10.1118/1.595711. [DOI] [PubMed] [Google Scholar]
- 8.Edelstein WA, Glover GH, Hardy CJ, Redington RW. The intrinsic signal-to-noise ratio in NMR imaging. Magn Reson Med. 1986;3(4):604–618. doi: 10.1002/mrm.1910030413. [DOI] [PubMed] [Google Scholar]
- 9.Song HK, Wehrli FW, Ma J. In vivo MR microscopy of the human skin. Magn Reson Med. 1997;37(2):185–191. doi: 10.1002/mrm.1910370207. [DOI] [PubMed] [Google Scholar]
- 10.Bottomley PA, Andrew ER. RF magnetic field penetration, phase shift and power dissipation in biological tissue: implications for NMR imaging. Phys Med Biol. 1978;23(4):630–643. doi: 10.1088/0031-9155/23/4/006. [DOI] [PubMed] [Google Scholar]
- 11.Robitaille PM, Abduljalil AM, Kangarlu A, et al. Human magnetic resonance imaging at 8 T. NMR Biomed. 1998;11(6):263–265. doi: 10.1002/(sici)1099-1492(199810)11:6<263::aid-nbm549>3.0.co;2-0. [DOI] [PubMed] [Google Scholar]
- 12.Vaughan JT, Garwood M, Collins CM, et al. 7T vs. 4T: RF power, homogeneity, and signal-to-noise comparison in head images. Magn Reson Med. 2001;46(1):24–30. doi: 10.1002/mrm.1156. [DOI] [PubMed] [Google Scholar]
- 13.Hennig J. Multiecho Imaging Sequences with Low Refocusing Flip Angles. J Magn Reson. 1988;78(3):397–407. [Google Scholar]
- 14.Alsop DC. The sensitivity of low flip angle RARE imaging. Magn Reson Med. 1997;37(2):176–184. doi: 10.1002/mrm.1910370206. [DOI] [PubMed] [Google Scholar]
- 15.Conolly S, Nishimura D, Macovski A, Glover G. Variable-Rate Selective Excitation. J Magn Reson. 1988;78(3):440–458. [Google Scholar]
- 16.Busse RF, Zur Y, Li X. Body Imaging at 3T: Lower SAR yields Improved Coverage with VERSE and Modulated Angle Refocusing Trains. 2003. p 206.
- 17.Bottomley PA, Foster TH, Argersinger RE, Pfeifer LM. A Review of Normal Tissue Hydrogen Nmr Relaxation-Times and Relaxation Mechanisms from 1–100 Mhz - Dependence on Tissue-Type, Nmr Frequency, Temperature, Species, Excision, and Age. Med Phys. 1984;11(4):425–448. doi: 10.1118/1.595535. [DOI] [PubMed] [Google Scholar]
- 18.Koenig SH, Brown RD., 3rd Determinants of proton relaxation rates in tissue. Magn Reson Med. 1984;1(4):437–449. doi: 10.1002/mrm.1910010404. [DOI] [PubMed] [Google Scholar]
- 19.Fischer HW, Rinck PA, Van Haverbeke Y, Muller RN. Nuclear relaxation of human brain gray and white matter: analysis of field dependence and implications for MRI. Magn Reson Med. 1990;16(2):317–334. doi: 10.1002/mrm.1910160212. [DOI] [PubMed] [Google Scholar]
- 20.Jezzard P, Duewell S, Balaban RS. MR relaxation times in human brain: measurement at 4 T. Radiology. 1996;199(3):773–779. doi: 10.1148/radiology.199.3.8638004. [DOI] [PubMed] [Google Scholar]
- 21.Takahashi M, Uematsu H, Hatabu H. MR imaging at high magnetic fields. Eur J Radiol. 2003;46(1):45–52. doi: 10.1016/s0720-048x(02)00331-5. [DOI] [PubMed] [Google Scholar]