

Abstract
Transcription-coupled repair (TCR) and global genomic repair (GGR) of UV-induced cyclobutane pyrimidine dimers were investigated in the yeast GAL1–10 genes. Both Rpb9- and Rad26-mediated TCR are confined to the transcribed strands, initiating at upstream sites ~100 nucleotides from the upstream activating sequence shared by the two genes. However, TCR initiation sites do not correlate with either transcription start sites or TATA boxes. Rad16-mediated GGR tightly correlates with nucleosome positioning when the genes are repressed and are slow in the nucleosome core and fast in linker DNA. Induction of transcription enhanced GGR in nucleosome core DNA, especially in the nucleosomes around and upstream of the transcription start sites. Furthermore, when the genes were induced, GGR was slower in the transcribed regions than in the upstream regions. Finally, simultaneous deletion of RAD16, RAD26, and RPB9 resulted in no detectable repair in all sites along the region analyzed. Our results suggest that (a) TCR may be initiated by a transcription activator, presumably through the loading of RNA polymerase II, rather than by transcription initiation or elongation per se; (b) TCR and nucleosome disruption-enhanced GGR are the major causes of rapid repair in regions around and upstream of transcription start sites; (c) transcription machinery may hinder access of NER factors to a DNA lesion in the absence of a transcription-repair coupling factor; and (d) other than GGR mediated by Rad16 and TCR mediated by Rad26 and Rpb9, no other nucleotide excision repair pathway exists in these RNA polymerase II-transcribed genes.
Nucleotide excision repair (NER)1 of UV-induced cis-syn cyclobutane pyrimidine dimers (CPDs) in DNA is heterogeneous in the genomes of both prokaryotes and eukaryotes. One reason for this heterogeneity is transcription-coupled repair (TCR). For many genes being actively transcribed, NER is considerably faster in the transcribed strand (TS) as compared with the nontranscribed strand (NTS) or with both strands of inactive genes (1, 2). On the other hand, damage in a transcriptionally silent gene, and in the NTS of an actively transcribed gene, is repaired by the so-called global genomic repair (GGR) pathway. It was recently shown that two TCR subpathways, mediated by Rad26 and Rpb9, respectively, exist in RNA polymerase II (Pol II) transcribed genes of Saccharomyces cerevisiae (3). Although facilitating Rad26-mediated TCR, Rpb4, another nonessential subunit (besides Rpb9) of Pol II, represses Rpb9-mediated TCR (3). It has also been shown that deletion of SPT4, encoding a protein involved in transcription elongation, releases the requirement of Rad26 for TCR (4). Furthermore, TCR was also observed in the RNA polymerase I-transcribed ribosomal RNA genes in yeast (5, 6) but has not yet been observed in ribosomal RNA genes of mammalian cells (7–9).
In Escherichia coli, TCR has been observed only in the transcribed regions of analyzed genes (10–12). In eukaryotes, however, TCR initiation sites can be very different from gene to gene. For example, in the yeast RPB2 and GAL1 genes, TCR is initiated ~40 and 180 nucleotides (nt) upstream of the transcription start sites, respectively (3). In the yeast URA3 gene, TCR seems to be limited to the transcribed region (13, 14).
Chromatin structure also contributes to NER heterogeneity in the genome (15, 16). In the nuclei of eukaryotic cells, DNA is packaged into a nucleoprotein complex known as chromatin (17). This complex provides the compaction and structural organization of DNA for processes such as replication, transcription, recombination, and repair. The fundamental subunits of chromatin are nucleosome cores, where 147 bp of DNA is wrapped in 1.65 left-handed superhelical turns around a histone octamer (18). The DNA between adjacent nucleosome cores is called linker DNA; it varies in length from about 20 to 90 bp in different organisms and tissues or even between individual nucleosome cores in the same cell (19). A detailed analysis of NER in the URA3 gene of a yeast minichromosome showed that NER in the NTS is faster in linker DNA than in the core regions (20). Similar correlations were observed in the GAL1-URA3 fusion gene of a yeast minichromosome (21) and in the yeast genomic URA3 gene (14).
The divergent yeast GAL1 and GAL10 genes, which share a common upstream activating sequence (UAS), are regulated identically (22, 23). These genes are completely repressed in glucose media and highly induced with galactose. Extensive studies have been done on isolated nuclei or chromatin to map the nucleosome structure in the GAL1–10 region (24–27). Using bleomycin as a DNA cleaving agent, we recently mapped nucleosome positioning in the GAL1–10 genes in permeabilized whole yeast cells (28). In glucose cultures, nucleosomes with fixed positions exist in regions adjacent to the UAS, and the variability of nucleosome positioning sharply increases with increasing distance from this sequence. In agreement with the past reports using isolated nuclei or chromatin (24–27), galactose induction causes nucleosome disruption throughout the region analyzed in permeabilized whole yeast cells, with the disruption of those nucleosomes close to the UAS being the most striking (28).
Rapid NER has been observed around and upstream of the transcription start sites in a number of actively transcribed genes (13, 29–35). In some instances, this rapid repair also occurs in the NTS (29, 33, 34). It has been speculated that there may be other NER pathways operating in these regions in addition to TCR and GGR. These different repair mechanisms may superimpose on chromatin substrates in the cells. A longstanding question is how these different NER pathways contribute to repair in different regions of a gene. With proper deletion mutants (i.e. TCR-deficient, GGR-deficient) available, we were able to dissect the different NER pathways in the well characterized yeast GAL1–10 genes.
EXPERIMENTAL PROCEDURES
Yeast Strains
Wild type yeast strain Y452 (MATα, ura3-52, his3-1, leu2-3, leu2-112) and its isogenic rad16, rad16 rad26, rad16 rpb9, rad16 rad26 rpb9, and rad26 rpb9 deletion mutants were created as described previously (3).
UV Irradiation and Repair Incubation
Cells were grown at 28 °C in minimal medium containing 2% glucose or 2% galactose to log phase (1.0), washed with 2% glucose or galactose, and irradiated with A600 ≈ 50 J/m2 of 254 nm UV light (36). Repair incubation, DNA isolation, and CPD mapping were done as described (3, 12, 28, 36, 37). Briefly, genomic DNA was isolated following UV irradiation and different times of repair incubation, using glass beads to break the cells (3). About 1 μg of genomic DNA was digested with restriction endonuclease(s) to release the fragments of interest. The restriction fragments were incised at CPD sites with an excess amount of purified T4 endonuclease V (kindly provided by Dr. R. Stephen Lloyd, University of Texas Medical Branch, Galveston, TX). Excess copies of biotinylated oligonucleotides, which are complementary to the 3′ end of the fragment to be labeled, were mixed with the sample. The mixture was heated to 95 °C for 5 min to denature the DNA and then cooled to an annealing temperature. The annealed fragments were attached to streptavidin magnetic beads (Dynal, Inc.) and the non-annealed fragments removed by washing the beads at the annealing temperature. The attached fragments were labeled at the 3′ ends using [α-32P]dATP (PerkinElmer Life Sciences), nonradioactive dCTP, and Sequenase (version 2, United States Biochemicals) (3). The labeled fragments were eluted from the beads and resolved on DNA sequencing gels. The dried gels were then exposed to PhosphorImager screens, and the 32P-labeled DNA was visualized on an Amersham Biosciences (model 445-P90) PhosphorImager.
Quantitation of CPDs at Individual Sites
Five overlapping fragments in each strand of the GAL1–10 region were analyzed. As the bands on the upper part of a sequencing gel are not well separated, only the CPD bands on the lower part of the gel are used for quantitation. The signal intensity at all pixels in a gel lane was measured by Image-QuaNT software (Amersham Biosciences) and the data transferred to Microsoft Excel. After the gel background signal (i.e. the signal in the areas that do not have samples) was subtracted, the total signal intensities in different lanes of a gel were normalized to the same amount. A relatively low UV dose for yeast (50 J/m2) was used for CPD induction. However, even under these conditions, a small portion of the fragments may still have more than one CPD induced, and a small portion of the signal at a site will not show up on a gel if another CPD exists upstream (relative to the labeled 3′ end) of the site. The effect of this “hidden signal” increases as a CPD site is more distant from the labeled 3′ end. This hidden signal was corrected as described previously (28).
The signal intensities in a lane containing the unirradiated control samples were used as a base line for other lanes that contain UV-irradiated samples. The signal intensities in a lane containing UV-irradiated sample were corrected by subtraction of the base line. The data were then imported into the PeakFit program (SPSS, Inc.) to fit and deconvolute peaks corresponding to the individual CPD sites on the gels (36). The percent of CPDs remaining at individual sites after different times of repair incubation were calculated and the times required for repairing 50% of CPDs (t1/2) were obtained by either linear or second order polynomial regression. We analyzed repair over a period of 4 h, because significant cell growth occurs if longer repair times are used, and this obscures the fraction of repaired DNA in the samples (because of the increased fraction of newly replicated, undamaged DNA). The t1/2 values > 4 h were obtained by extrapolation of either linear or second order polynomial regression of the data obtained from 0, 1, 2, and 4 h of repair. Profiles of the repair rates along the GAL1–10 region were obtained from smoothed lines of t1/2 values (e.g. see Figs. 3, 7, and 10). Smoothing was carried out by averaging the individual t1/2 values at continuous intervals of 40 nt, where the 40-nt brackets were ramped along the DNA by 1 nucleotide.
Fig. 3. Plots showing TCR in the galactose-induced GAL1–10 genes.
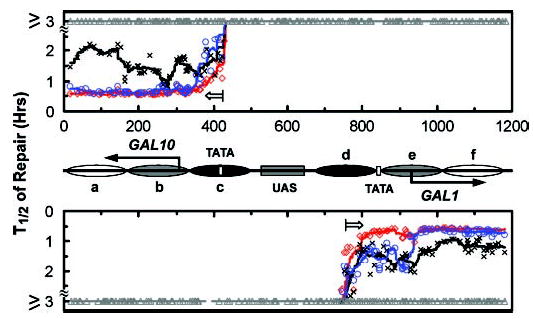
Symbols (⋄, ○, ×, and ▵) represent individual t1/2 values. The lines are smoothed t1/2 values for the different mutants (see “Experimental Procedures”). The upper and lower panels represent the top (TS for GAL10 and NTS for GAL1 genes) and bottom strands, respectively. The open arrows in the panels indicate TCR initiation sites. Between the panels is a schematic diagram of the GAL1–10 region as shown in Fig. 1. The mutants shown are: rad16 (red), rad16 rad26 (blue), rad16 rpb9 (black), and rad16 rad26 rpb9 (gray).
Fig. 7. Plot showing tight correlation between GGR and nucleosome structure in TCR-deficient rad26 rpb9 cells.
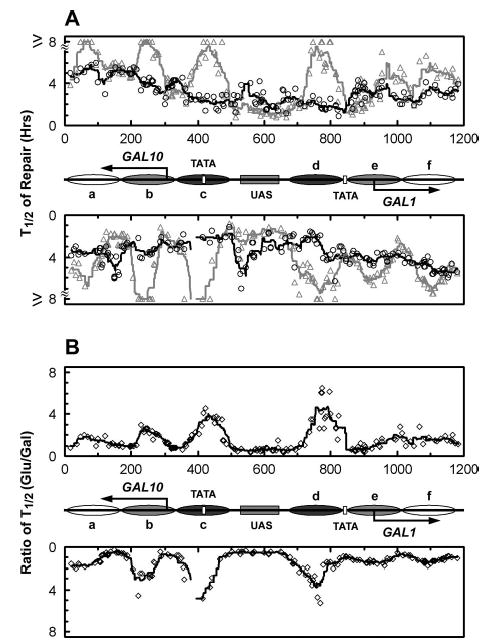
A, time (in hours) required to repair 50% (T1/2) of the CPDs in the GAL1–10 region in glucose (gray triangles) and galactose (black circles) cultures. The gray and black lines are smoothed t1/2 values for the glucose and galactose cultures, respectively (see “Experimental Procedures”). The upper and lower panels represent the top and bottom strands, respectively. Between the panels is a schematic diagram of the GAL1–10 region as shown in Fig. 1. B, ratios of t1/2 between glucose and galactose cultures. The open diamonds represent the individual ratios of t1/2 values for the two cultures, and the solid lines are smoothed values of these ratios. The smoothing method and schematics between the panels are the same as those described for A.
Fig. 10. Plots showing NER in the GAL1–10 region in wild type cells.
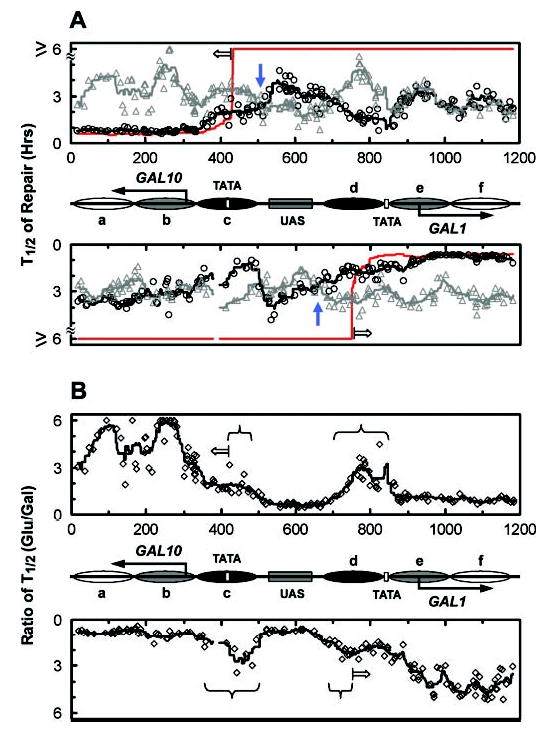
A, time (in hours) required to repair 50% (T1/2) of the CPDs in the GAL1–10 region in glucose (gray triangles) and galactose (black circles) cultures. The gray and black lines are smoothed t1/2 values of glucose and galactose cultures, respectively (see “Experimental Procedures”). The red line represents the smoothed t1/2 values for galactose-cultured rad16 cells (see red line in Fig. 3), indicating TCR operative regions when the genes are induced. The upper and lower panels represent the top and bottom strands, respectively. Between the panels is a schematic diagram of the GAL1–10 region as shown in Fig. 1. The open arrows in the upper and lower panels indicate TCR initiation sites for the induced GAL10 and GAL1 genes, respectively. Blue arrows denote the first positions of intersection upstream of the transcription start sites between the black and gray lines. B, ratios of t1/2 between glucose and galactose cultures of wild type cells. The open diamonds represent the individual ratio of t1/2 values for the two cultures and the solid lines the smoothed values of these ratios. The smoothing method and schematics between the panels are the same as those described for A. The open arrows in the upper and lower panels indicate the TCR initiation sites for the induced GAL10 and GAL1 genes, respectively. Braces indicate regions where galactose induction enhances repair, likely because of enhanced GGR when nucleosomes are disrupted.
RESULTS
Rad26- and Rpb9-mediated TCRs Are Confined to the TS, Initiating at Upstream Sites That Are ~100 Nucleotides from the UAS
In actively transcribed eukaryotic genes, rapid repair has been observed around transcription start sites (3, 29–31, 33). Furthermore, the initiation sites of the rapid repair vary from gene to gene, ranging from immediately downstream (13, 14, 38) to tens (3, 29–31, 33) or even hundreds of nucleotides upstream of the transcription start sites (3). The mechanism(s) for this rapid repair is poorly understood. We asked how TCR may contribute to the rapid repair and which gene element(s) (e.g. UAS, TATA, and transcription start site) determines a TCR initiation site. To address these questions, we analyzed both Rad26- and Rpb9-mediated TCR in the galactose-induced GAL1–10 genes (Fig. 1) at nucleotide resolution. Deletion of RAD16 eliminates GGR (39), and the two TCR subpathways can be examined easily in a rad16 background (3). Therefore, rad16, rad16 rpb9, rad16 rad26, and rad16 rad26 rpb9 cells were grown in galactose media to log phase (A600 ≈ 1.0), UV-irradiated, and incubated for different periods of time in repair media. The genomic DNA was isolated, cut with restriction enzyme to release the fragments of interest, and incised at CPDs with excess amounts of purified T4 endonuclease V (40). The fragments were 3′ end-labeled on individual strands, separated on sequencing gels, and exposed to PhosphorImager screens.
Fig. 1. Schematic of the GAL1–10 region analyzed for NER.
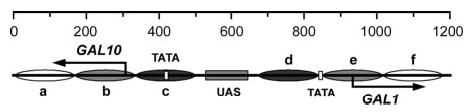
Solid arrows and vertical open bars indicate the transcription start sites and TATA boxes of the genes, respectively. The shaded box indicates the UAS shared by the two divergent genes. Ovals a–f represent nucleosomes in glucose cultures, where the intensity of shading denotes the invariability of the nucleosome positions (darkest, least variable; lightest, most variable). Nucleotide positions, which are numbered from a site in the GAL10 gene (310 nucleotides downstream of the major GAL10 transcription start site), are indicated above the schematic diagram.
Representative gels showing Rad26- and Rpb9-mediated TCR in the GAL10 and GAL1 genes are presented in Fig. 2. The intensity of a band in the 0′ lane reflects CPD yield at the respective site, and the decreasing band intensity with increasing time (1, 2, and 4 h) of incubation reflects repair of CPDs (36). The signal intensities of individual CPD bands on the gels were quantified using peak deconvolution (see “Experimental Procedures”), and the percent CPDs remaining at each site after different times of repair was determined (e.g. see Ref. 41, Fig. 5 therein). The times required for repairing 50% of the CPDs (t1/2) at individual sites were then obtained by regression analysis of these curves of percent CPDs remaining (Fig. 3). In rad16, rad16 rpb9, and rad16 rad26 cells, obvious TCR can be seen in a continuous sequence of the TS. In the GAL10 gene, TCR is initiated ~120 nt upstream of the transcription start site (Fig. 2A and Fig. 3, upper panel, marked with an open arrow), which is immediately upstream of the TATA box (Figs. 2A and 3, marked with an open box). In the GAL1 gene, TCR is initiated ~180 nt upstream of the transcription start site (Fig. 2B and Fig. 3, lower panel, marked with an open arrow), which is ~100 nt upstream of its TATA box (Figs. 2B and 3, marked with an open box). Thus, the TCR initiation sites do not correlate with the locations of the transcription start sites or the TATA boxes of these genes. Interestingly, however, the TCR initiation sites of the two genes are both ~100 nt downstream from the ends of their shared UAS (Figs. 2 and 3).
Fig. 2. Gels showing Rad26- and Rpb9-mediated TCR in galactose-induced GAL1–10 genes.
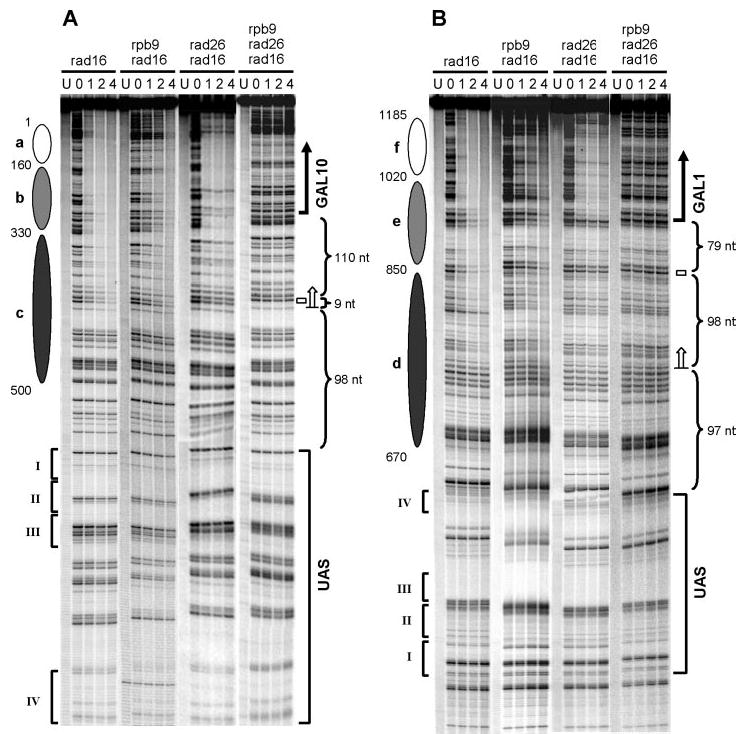
The TS of GAL10 (A) and GAL1 (B) genes, respectively, are shown. Gel lanes are DNA samples from unirradiated (U) and irradiated cells following 0, 1, 2, and 4 h repair incubation. Ovals on the left of each panel represent nucleosome locations in glucose cultures, where the intensity of shading denotes the invariability of the nucleosome positions (darkest, least variable; lightest, most variable). Roman numerals denote the positions of the four Gal4 binding sites in the UAS. Bold vertical arrows and open bars on the right of each panel indicate the major transcription start sites and TATA boxes of the genes, respectively. Open arrows on the right of each panel indicate the TCR initiation sites.
Fig. 5. NER in the top strand (TS for GAL10 and NTS for GAL1) of glucose (Glu)- and galactose (Gal)-cultured TCR-deficient rad26 rpb9 cells.
A and B show sequencing gels for two of five overlapping restriction fragments analyzed along the top strand of the GAL1–10 genes. Gel lanes are DNA samples from unirradiated (U) and UV-irradiated cells following 0, 1, 2, and 4 h repair incubation. Ovals on the left of the panels represent nucleosome locations in glucose cultures, where the intensity of shading denotes the invariability of the nucleosome positions (darkest, least variable; lightest, most variable). Bold vertical arrows on the right of the panels indicate the major transcription start sites. Open bars marks TATA boxes of the genes. Roman numerals on the left of panel B denote the positions of the four Gal4 binding sites in the UAS.
In rad16 rpb9 cells, there is a general trend of similar repair rates in the coding regions and in the regions upstream of the transcription start sites (Fig. 2; Fig. 3, black symbols). This result indicates that Rad26-mediated TCR may operate equally in the two regions. In contrast, in rad16 rad26 cells, faster repair appears to occur in the coding regions compared with the regions upstream of the transcription start sites (Fig. 2; Fig. 3, blue symbols), indicating that Rpb9-mediated TCR may be more effective in the coding regions of the two genes. Furthermore, the repair rates in the transcribed regions of the TS are only slightly slower in rad16 rad26 cells than in rad16 cells (Fig. 3, compare blue and red symbols), indicating that Rad26 may be almost dispensable for TCR in these regions. In the constitutively expressed RPB2 gene, however, TCR is more dependent on Rad26, as the repair rate in the transcribed region of this gene is much slower in rad16 rad26 cells than in rad16 cells (3). Therefore, there may only be a small proportion of Pol II associated with Rpb4 (a suppressor of Rpb9-mediated TCR) during the robust transcription of the GAL1–10 genes (3). The Rpb9-mediated TCR, if unsuppressed by Rpb4, can be very efficient in the transcribed regions.
In rad16, rad16 rpb9, and rad16 rad26 cells, no repair could be seen in the TS regions more than 120 or 180 nt upstream of the transcription start site for the GAL10 or GAL1 genes, respectively (Figs. 2 and 3). This indicates that neither the Rad26- nor the Rpb9-mediated TCR subpathway is operative in these regions. Furthermore, NER is not observed in any region of the NTS in rad16, rad16 rad26, and rad16 rpb9 cells cultured in galactose media (Figs. 3 and 4), indicating that neither the Rad26- nor the Rpb9-mediated TCR subpathway is operative in the NTS of the two genes, even in the regions around and upstream of the transcription start sites.
Fig. 4. Gels showing absence of TCR in the entire NTS of the GAL10 (A) and GAL1 (B) genes in galactose-induced rad16 cells.
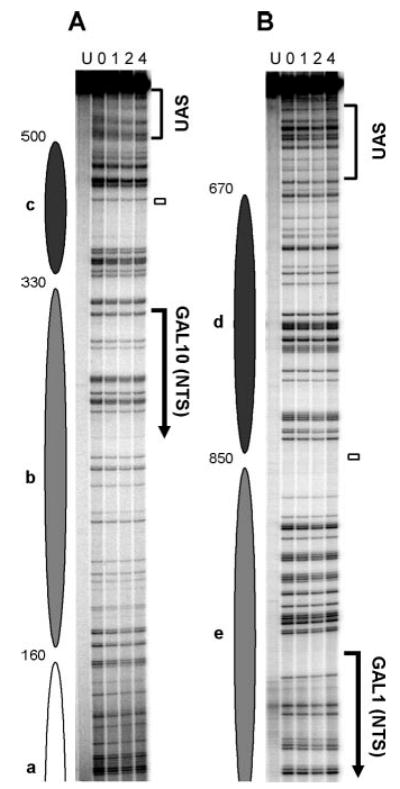
Gel lanes are DNA samples from unirradiated (U) and UV-irradiated cells following 0, 1, 2, and 4 h repair incubation. Ovals on the left of each panel represent nucleosome locations in glucose cultures, where the intensity of shading denotes the invariability of the nucleosome positions (darkest, least variable; lightest, most variable). Vertical arrows and open bars on the right of each panel indicate the major transcription start sites and TATA boxes of the genes, respectively.
Finally, within the entire 4-h period of repair incubation, no apparent repair was observed in any region of the GAL1–10 genes in rad16 rad26 rpb9 cells (Fig. 2; Fig. 3, gray symbols). This indicates that no other apparent NER pathway besides Rad16-mediated GGR, Rad26-mediated TCR, and Rpb9-mediated TCR exists in these Pol II-transcribed genes.
GGR Tightly Correlates with Nucleosome Structures
We analyzed repair in the GAL1–10 genes in rad26 rpb9 cells where GGR is intact and TCR is completely abolished (3). Representative gels showing Rad16-mediated GGR in the GAL1–10 genes of cells grown in glucose and galactose are presented in Figs. 5 and 6, and the quantification data for these gels are shown in Fig. 7. In glucose cultures, where nucleosomes are positioned along the GAL1–10 genes, repair rates correlate with nucleosome positioning and stability, being slower in the nucleosome core region and faster in the linker DNA (Figs. 5 and 6, Glu lanes, and Fig. 7A, gray triangles). This correlation is strongest in the nucleosomes adjacent to the UAS (e.g. nucleosomes c and d) and fades off with distance from the shared sequence (Figs. 5–7). These results agree well with the variability of nucleosome positioning in the region, most fixed in the region adjacent to the UAS and more variable with distance from the UAS (28).
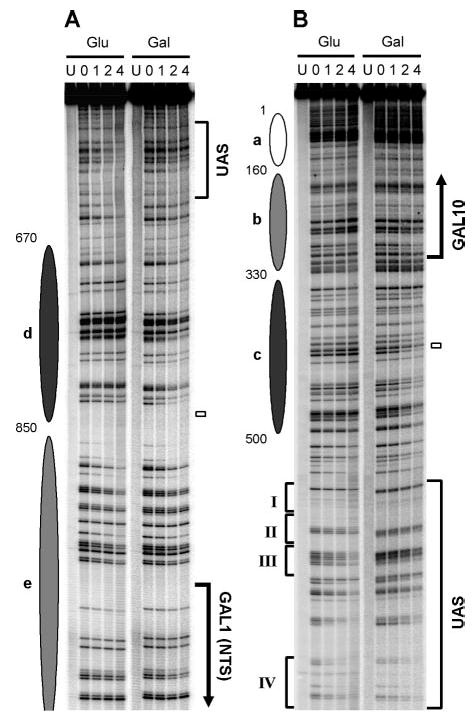
Fig. 6. NER in the bottom strand (TS for GAL1 and NTS for GAL10) of glucose (Glu)- and galactose (Gal)-cultured TCR-deficient rad26 rpb9 cells.
A and B are sequencing gels for two of five overlapping restriction fragments analyzed along the bottom strand of the GAL1–10 genes. See legend to Fig. 5 for details.
Galactose induction caused a general enhancement of GGR in both strands of the GAL1–10 genes (Figs. 5 and 6, compare Glu and Gal lanes; Fig. 7A, compare black and gray symbols; Fig. 7B). This enhancement closely correlates with nucleosome positioning and disruption profiles in glucose and galactose cultures. Indeed, decreases in the t1/2 of >4-fold occurred in both DNA strands of the core regions of nucleosomes c and d (Fig. 7), which are disrupted most dramatically upon galactose induction (28). However, this striking enhancement does not correlate with either the transcription start sites or the TATA boxes of the genes (Figs. 5–7, compare GGR profiles with the locations of gene elements).
Induction of Transcription Hinders Repair in the Transcribed Regions of the GAL1–10 Genes in TCR-deficient Cells
In galactose-induced TCR-deficient cells, the repair rates are slower in the transcribed region than in the upstream sequences (Figs. 5B and 6B, Gal lanes; Fig. 7A, black symbols). This repair profile sharply contrasts with that of the TCR-proficient cells (compare Figs. 2A and 5B, 2B and 6B, and 3 and 7A). This result indicates that transcription inhibits NER in the absence of a coupling mechanism between these two processes.
Interplay of GGR and TCR in Chromatin Substrates of Wild Type Cells
Our results suggest that, other than GGR mediated by Rad16 and TCR mediated by Rad26 and Rpb9, no other NER pathway exists in the Pol II transcribed genes (see above). Another question concerns the interplay of GGR and TCR in chromatin substrates in wild type cells. Thus, we attempted to dissect the two pathways in the GAL1–10 genes. Representative gels for cells grown in glucose and galactose are presented in Figs. 8 and 9, and the quantification data for these gels are shown in Fig. 10. In glucose cultures, where the genes are repressed and characteristic nucleosomes are present, repair rates also correlate with nucleosome positions in the wild type cells, being slow in the core region and faster in the linker DNA (Figs. 8 and 9, Glu lanes; Fig. 10A, gray symbols). This correlation fades off with distance from the UAS (Figs. 8–10), agreeing with the variability of nucleosome positions (28). However, the correlation between repair rates and nucleosome positioning in glucose cultures is much weaker in the wild type cells than in the TCR-deficient rad26 rpb9 cells (compare Figs. 5A and 8A, 5B and 8B, 6A and 9A, 6B and 9B, and 7 and 10). These results suggest that some residual repair mediated by Rpb9 or Rad26 may still operate in the glucose repressed GAL1–10 genes in wild type cells, which may obscure the modulation of NER by nucleosome structure. Indeed, we found that a low level of Rad26 (but not Rpb9)-mediated repair does occur sporadically in both strands of the GAL1–10 region (which does not correspond to the normal transcribed region of the galactose induced GAL1–10 genes) when the genes are repressed by glucose (data not shown).
Fig. 8. NER in the top strand of the GAL1–10 region (TS for GAL10 and NTS for GAL1) of glucose (Glu)- and galactose (Gal)-cultured wild type cells.
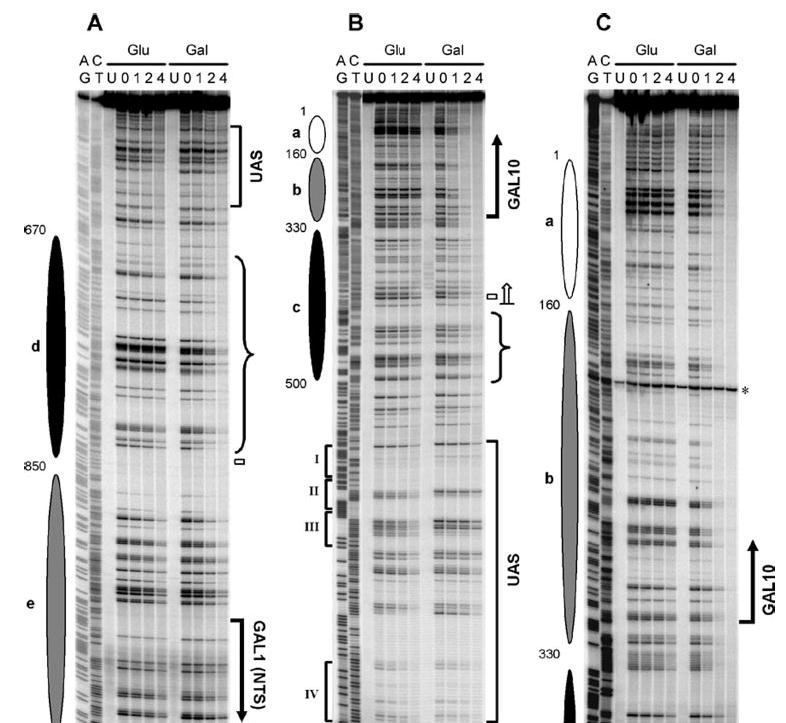
A–C are sequencing gels for three of five overlapping restriction fragments analyzed along the top strand of the GAL1–10 genes. The left two lanes in each panel are for Maxam-Gilbert sequencing markers (AG and CT). The other lanes are DNA samples from unirradiated (U) and UV-irradiated cells following 0, 1, 2, and 4 h repair incubation. Ovals on the left of each panel represent nucleosome locations in glucose cultures, where the intensity of shading denotes the invariability of the nucleosome positions (darkest, least variable; lightest, most variable). Bold vertical arrows on the right of the panels indicate the major transcription start sites. Open bars mark the TATA boxes of the genes. The open arrow on the right of panel B indicates the TCR initiation site for the GAL10 gene. Braces on the right of panels A and B mark the regions where galactose induction dramatically enhances repair, likely because of nucleosome disruption-enhanced GGR rather than TCR. Roman numerals on the left of panel B denote the positions of the four Gal4 binding sites in the UAS. The asterisk on the right of panel C indicates a nonspecific band, which was from an unknown DNA fragment that nonspecifically binds to the biotinylated oligonucleotide used to label the GAL10 fragment.
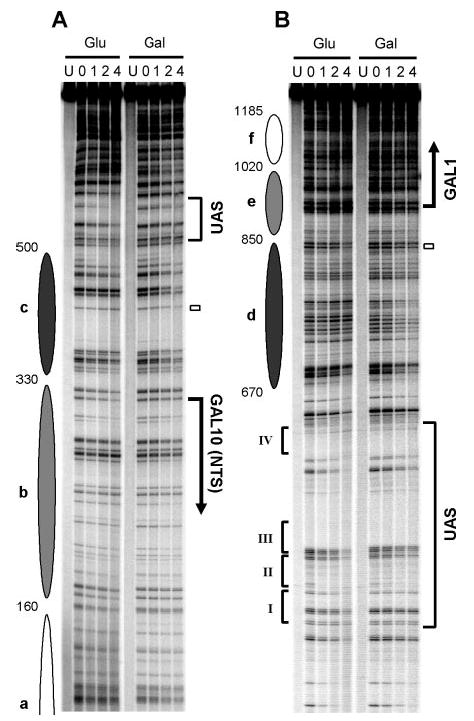
Fig. 9. NER in the bottom strand of the GAL1–10 region (TS for GAL1 and NTS for GAL10) of glucose (Glu)- and galactose (Gal)-cultured wild type cells.
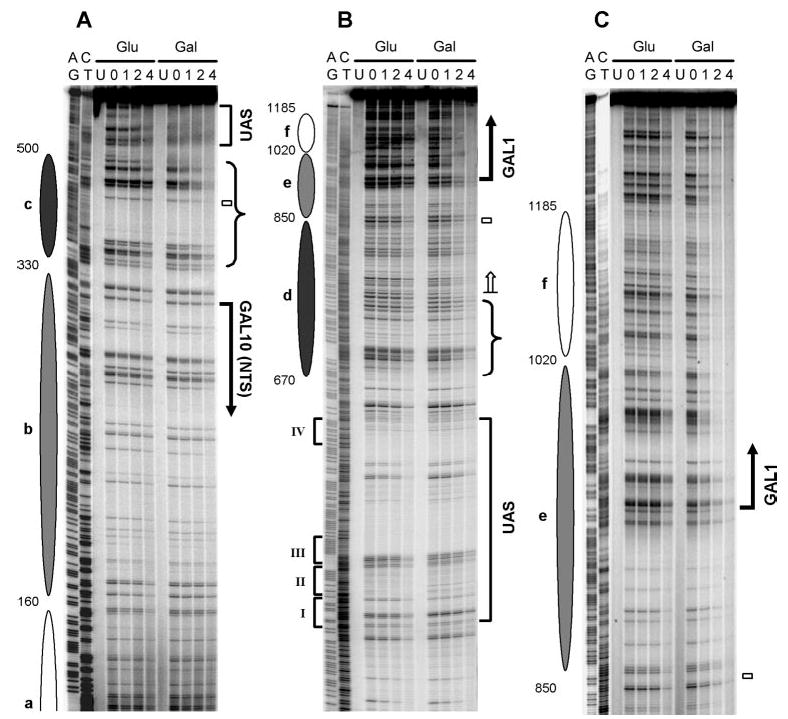
Panels A–C are sequencing gels for three of five overlapping restriction fragments analyzed along the bottom strand of the GAL1–10 genes. See legend to Fig. 8 for schematic and symbol details.
Compared with glucose cultures, faster repair can be seen in the TS of the two genes in galactose cultures (Figs. 8B and C, 9, B and C, and 10). In the TS of the GAL10 gene, the galactose-enhanced repair is initiated ~200 nt upstream of the transcription start site (Fig. 10A, upper panel; note the position indicated by the blue arrow where black and shaded lines intersect upstream of the GAL10 gene), which is ~80 nt further upstream of the TCR initiation site of the gene (Figs. 2A, 8B, and 10, marked with open arrows). In the TS of the GAL1 gene, this galactose-enhanced repair is initiated ~260 nt upstream of the transcription start site (Fig. 10A, lower panel; note the position indicated by the blue arrow where black and shaded lines intersect upstream of the GAL1 gene), which is ~80 nt further upstream of the TCR initiation site of the gene (Figs. 2B, 9B, and 10, marked with open arrows). Thus, the galactose-enhanced NER in the regions between −120 and −200 in the GAL10 gene (Fig. 8B and 10B, marked with braces) and between −180 and −260 in the GAL1 gene (Figs. 9B and 10B, marked with braces) should be because of GGR rather than TCR. In support of this notion, galactose also enhanced repair in these regions in TCR-deficient rad26 rpb9 cells (compare Figs. 5B and 8B, Figs. 6B and 9B). Furthermore, the galactose-enhanced GGR in the more upstream regions of the TS correlate well with the disruption of the most fixed nucleosomes (Fig. 10c and d).
In addition to enhancing NER in the TS, galactose induction increases repair in certain upstream regions in the NTS of the GAL1–10 genes in wild type cells (Figs. 8A, 9A, and 10B, marked with braces). As neither Rad26- nor Rpb9-mediated TCR operates in the NTS of the GAL1–10 genes (Figs. 3 and 4), the galactose-enhanced repair in these regions should be because of GGR rather than TCR. These regions also correlate with the positions of the two severely disrupted nucleosomes (c and d) in galactose (Figs. 8A, 9A, and 10).
DISCUSSION
In eukaryotes, the initiation of transcription starts with the binding of transcription factor IID to the promoter via the direct interaction of its TATA-binding protein subunit with the TATA box (42). It has been shown that transcription-dependent DNA melting on the yeast GAL1 and GAL10 promoters is more closely correlated to the position of the TATA box than the transcription start site (43). On both of these genes, melting begins about 20 bp downstream of the TATA box. It was proposed that, after melting the promoter, Pol II locates the transcription start site by scanning the DNA (43).
In the present report, we show that both Rad26- and Rpb9-mediated TCR occur in continuous TS sequences, with initiation upstream of the transcription start sites for both the GAL1 and GAL10 genes (Figs. 2 and 3). Interestingly, these TCR initiation sites do not correlate with either the TATA boxes or the transcription start sites but, rather, with the shared UAS sequence (~100 bp from each end). These results suggest that both Rad26- and Rpb9-mediated TCR may be immediately operative once Pol II is loaded onto the promoters by the transcription activator Gal4, even prior to actual transcription initiation. It is believed that Gal4 binds to the UAS sequence strongly when the genes are induced (22). Furthermore, both Rad26- and Rpb9-mediated TCR have been found to initiate at a site which is ~40 nt upstream of the transcription start site in the yeast RPB2 gene (3). Therefore, at least for some Pol II genes, TCR may not be limited to regions where Pol II is in the elongation mode. However, a number of repair analyses at the gene level suggest that Pol II is required to be in the elongation mode to initiate TCR in eukaryotic cells (44 –47). The reason for this discrepancy is not known, but it could be because of differences in resolution of the repair analyses used.
It has been shown that, in two mutant mammalian cell lines in which the entire APRT promoter region has been deleted, NER are still efficient in both strands of the promoterless APRT gene, even though neither strand appears to be transcribed (48). Furthermore, strand specificity of NER in the APRT genes seems to be genomic context-dependent (49). Thus it is possible that, under certain genomic context, Pol II is loaded onto certain DNA sequences although no actual transcription occurs. Once loaded on to the DNA, Pol II may also be able to signal TCR in mammalian cells.
Our repair results with TCR-deficient cells show that transcriptional induction of the GAL1–10 genes actually hinders NER in the transcribed regions (Figs. 5B and 6B, Gal lanes; Fig. 7A, black symbols). This result indicates that transcription machinery stalled at a lesion may hinder access of NER factors if a coupling factor between transcription and repair is absent. It has been shown that the E. coli RNA polymerase inhibits NER if a transcription-repair coupling factor is not presented (50, 51). Furthermore, an extremely high level of transcription in a tRNA gene in E. coli also inhibit repair in the TS, presumably because of a “piling up” of RNA polymerases downstream of a DNA lesion (12). Thus, the TCR mechanisms in E. coli and eukaryotes may be similar in that both use a transcription-repair coupling factor to facilitate access of NER factors to a lesion that is “shielded” by blocked RNA polymerases.
In glucose-repressed rad26 rpb9 cells, a strong correlation between nucleosome positioning and NER is observed in the regions that are adjacent to the UAS. This “nucleosome effect” fades off with distance from the shared sequence of the two genes. Such a scenario fits well with the variability of nucleosome positioning observed with protection of bleomycin cleavage along the GAL1–10 genes in glucose cultured cells (28). In addition, these observations suggest that the variable positioning of nucleosomes on DNA may obscure the effect of histone binding on NER.
In glucose-cultured wild type cells, the correlation between nucleosome positioning and NER is much weaker, and our data suggest that this is at least partly because of a low level of sporadic Rad26-mediated repair.2 However, no transcripts from the GAL1–10 region have been detected in glucose-cultured cells by routine Northern blot analysis (Ref. 22 and Footnote 2). Thus, Rad26-mediated repair may be operative at extremely low levels of transcription in yeast. Alternatively, transcription elongation may not be necessary for Rad26 to mediate repair (see above). Regardless of the mechanism, a sporadic Rad26-mediated repair may obscure the modulation of NER by nucleosome structure in yeast cells. Indeed, this may explain our previous observation that a rather weak correlation exists between nucleosome positioning and NER in a GAL1::URA3 fusion gene in the minichromosome YRpSO1, and little (or no) correlation exists in the HIS3 gene carried on the same minichromosome (21).
Rapid NER has been observed around (and upstream of) the transcription start sites in a number of actively transcribed Pol II genes (13, 29 –31, 33–35), and several explanations for the rapid repair have been proposed. First, local concentrations of DNA repair factors may be higher around transcription initiation sites because of association of general transcription factors (e.g. TFIIH) functioning in transcription initiation and repair (29, 33). Second, nucleosome structure (29, 34, 35) or other structural features (35) may be disrupted during transcription initiation, which may allow easier access of NER machinery to the lesions in these regions. Finally, there may be an interim repair mechanism functioning at the transition from GGR to TCR (52).
In the present report, we have shown that TCR, which is confined to continuous sequences of the TS, initiates upstream of the transcription start sites of the GAL1–10 genes. Therefore, in addition to causing rapid repair in the transcribed region, TCR mediated by Rad26 and Rpb9 directly contributes to rapid repair in the TS upstream of the transcription start sites. Furthermore, we show that galactose-enhanced repair in both strands of the GAL1–10 genes in TCR-deficient cells correlates well with nucleosome disruption profiles. Thus, GGR may contribute to enhanced repair in both strands around or upstream of the transcription start sites, when the genes are induced, by a mechanism involving nucleosome disruption.
Recently, an in vitro study using reconstituted chromatin substrates showed that transcription activators bound to a region upstream of a gene promoter can stimulate NER (53). Furthermore, it was shown that binding of activators to their cognate sequences induces local chromatin remodeling mediated by ATP-driven chromatin remodeling and acetyltransferase activities to facilitate DNA repair (53). In addition, it was previously shown that binding of transcription activator Gal4 to the UAS is essential for activation of transcription and disruption of upstream nucleosomes in the GAL1–10 genes (23). Therefore, transcription activators bound to cognate sites may not directly recruit NER machinery to nearby regions, because enhanced repair correlates only with (a) TS regions where Rad26- and Rpb9-mediated TCR occur and (b) nucleosome disruption profiles. On the other hand, transcription activators may enhance NER by an indirect mechanism such as enhancing TCR via recruitment of Pol II to gene promoters and/or enhancing GGR via nucleosome disruption. Indeed, the TCR initiation sites correlate well with the UAS in the GAL1–10 genes (see above). Moreover, disruption of nucleosomes adjacent to the UAS is the most striking in this region upon galactose induction of permeabilized cells (28), and this correlates well with the most striking enhancement of NER.
Taken together, these results support the notion that both TCR and nucleosome disruption are the major causes of rapid repair in the regions around and upstream of the transcription start site of an actively transcribed Pol II gene. The TCR contribution to enhanced repair is confined to the TS, which may extend to the sequence upstream of the transcription start site. On the other hand, disruption of nucleosomes may enhance GGR, which is responsible for enhanced repair in the further upstream regions of the TS and in the entire NTS of this region. Finally, other than GGR mediated by Rad16 and TCR mediated by Rad26 and Rpb9, no other NER pathway seems to exist in Pol II transcribed genes.
Acknowledgments
We thank Dr. R. Stephen Lloyd for supplying purified T4 endonuclease V, Drs. John Wyrick and Feng Gong for critical reading of the manuscript, and Deirdre Fahy for technical assistance. We also thank members of the Smerdon laboratory for critical discussions.
Footnotes
This study was supported by NIEHS, National Institutes of Health Grants ES04106 and ES02614.
The abbreviations used are: NER, nucleotide excision repair; CPD, cyclobutane pyrimidine dimer; GGR, global genomic repair; nt, nucleotide(s); NTS, nontranscribed strand; Pol II, RNA polymerase II; TCR, transcription-coupled repair; TS, transcribed strand; UAS, upstream activating sequence.
S. Li and M. J. Smerdon, unpublished results.
References
- 1.Hanawalt PC. Mutat Res. 2001;485:3–13. doi: 10.1016/s0921-8777(00)00071-9. [DOI] [PubMed] [Google Scholar]
- 2.Hanawalt PC. Oncogene. 2002;21:8949 –8956. doi: 10.1038/sj.onc.1206096. [DOI] [PubMed] [Google Scholar]
- 3.Li S, Smerdon MJ. EMBO J. 2002;21:5921–5929. doi: 10.1093/emboj/cdf589. [DOI] [PMC free article] [PubMed] [Google Scholar]
- 4.Jansen LE, den Dulk H, Brouns RM, de Ruijter M, Brandsma JA, Brouwer J. EMBO J. 2000;19:6498 –6507. doi: 10.1093/emboj/19.23.6498. [DOI] [PMC free article] [PubMed] [Google Scholar]
- 5.Conconi A, Bespalov VA, Smerdon MJ. Proc Natl Acad Sci U S A. 2002;99:649 –654. doi: 10.1073/pnas.022373099. [DOI] [PMC free article] [PubMed] [Google Scholar]
- 6.Meier A, Livingstone-Zatchej M, Thoma F. J Biol Chem. 2002;277:11845–11852. doi: 10.1074/jbc.M110941200. [DOI] [PubMed] [Google Scholar]
- 7.Stevnsner T, May A, Petersen LN, Larminat F, Pirsel M, Bohr VA. Carcinogenesis. 1993;14:1591–1596. doi: 10.1093/carcin/14.8.1591. [DOI] [PubMed] [Google Scholar]
- 8.Christians FC, Hanawalt PC. Mutat Res. 1994;323:179 –187. doi: 10.1016/0165-7992(94)90031-0. [DOI] [PubMed] [Google Scholar]
- 9.Fritz LK, Smerdon MJ. Biochemistry. 1995;34:13117–13124. doi: 10.1021/bi00040a024. [DOI] [PubMed] [Google Scholar]
- 10.Selby CP, Sancar A. Microbiol Rev. 1994;58:317–329. doi: 10.1128/mr.58.3.317-329.1994. [DOI] [PMC free article] [PubMed] [Google Scholar]
- 11.Kunala S, Brash DE. J Mol Biol. 1995;246:264 –272. doi: 10.1006/jmbi.1994.0082. [DOI] [PubMed] [Google Scholar]
- 12.Li S, Waters R. J Mol Biol. 1997;271:31–46. doi: 10.1006/jmbi.1997.1154. [DOI] [PubMed] [Google Scholar]
- 13.Tijsterman M, Verhage RA, van de Putte P, Tasseron-de Jong JG, Brouwer J. Proc Natl Acad Sci U S A. 1997;94:8027–8032. doi: 10.1073/pnas.94.15.8027. [DOI] [PMC free article] [PubMed] [Google Scholar]
- 14.Tijsterman M, de Pril R, Tasseron-de Jong JG, Brouwer J, Verhage RA, van de Putte P. Mol Cell Biol. 1999;19:934 –940. doi: 10.1128/mcb.19.1.934. [DOI] [PMC free article] [PubMed] [Google Scholar]
- 15.Smerdon MJ, Conconi A. Prog Nucleic Acids Res Mol Biol. 1999;62:227–255. doi: 10.1016/s0079-6603(08)60509-7. [DOI] [PubMed] [Google Scholar]
- 16.Thoma F. EMBO J. 1999;18:6585–6598. doi: 10.1093/emboj/18.23.6585. [DOI] [PMC free article] [PubMed] [Google Scholar]
- 17.Wolffe, A. P. (1999) Chromatin: Structure and Function, 3rd Ed., pp. 7–172, Academic Press, London
- 18.Luger K, Mader AW, Richmond RK, Sargent DF, Richmond TJ. Nature. 1997;389:251–260. doi: 10.1038/38444. [DOI] [PubMed] [Google Scholar]
- 19.Holde, K. E. v. (1989) Chromatin, pp. 289 –354, Springer-Verlag KG, Berlin
- 20.Wellinger RE, Thoma F. EMBO J. 1997;16:5046 –5056. doi: 10.1093/emboj/16.16.5046. [DOI] [PMC free article] [PubMed] [Google Scholar]
- 21.Li S, Livingstone-Zatchej M, Gupta R, Meijer M, Thoma F, Smerdon MJ. Nucleic Acids Res. 1999;27:3610 –3620. doi: 10.1093/nar/27.17.3610. [DOI] [PMC free article] [PubMed] [Google Scholar]
- 22.Lohr D, Venkov P, Zlatanova J. FASEB J. 1995;9:777–787. doi: 10.1096/fasebj.9.9.7601342. [DOI] [PubMed] [Google Scholar]
- 23.Bash R, Lohr D. Prog Nucleic Acids Res Mol Biol. 2001;65:197–259. doi: 10.1016/s0079-6603(00)65006-7. [DOI] [PubMed] [Google Scholar]
- 24.Lohr D, Torchia T, Hopper J. J Biol Chem. 1987;262:15589 –15597. [PubMed] [Google Scholar]
- 25.Fedor MJ, Lue NF, Kornberg RD. J Mol Biol. 1988;204:109 –127. doi: 10.1016/0022-2836(88)90603-1. [DOI] [PubMed] [Google Scholar]
- 26.Fedor MJ, Kornberg RD, Lue NF. Mol Cell Biol. 1989;9:1721–1732. doi: 10.1128/mcb.9.4.1721. [DOI] [PMC free article] [PubMed] [Google Scholar]
- 27.Cavalli G, Thoma F. EMBO J. 1993;12:4603–4613. doi: 10.1002/j.1460-2075.1993.tb06149.x. [DOI] [PMC free article] [PubMed] [Google Scholar]
- 28.Li S, Smerdon MJ. J Biol Chem. 2002;277:44651–44659. doi: 10.1074/jbc.M206623200. [DOI] [PubMed] [Google Scholar]
- 29.Tu Y, Tornaletti S, Pfeifer GP. EMBO J. 1996;15:675–683. [PMC free article] [PubMed] [Google Scholar]
- 30.Tu Y, Bates S, Pfeifer GP. J Biol Chem. 1997;272:20747–20755. doi: 10.1074/jbc.272.33.20747. [DOI] [PubMed] [Google Scholar]
- 31.Tu Y, Bates S, Pfeifer GP. Mutat Res. 1998;400:143–151. doi: 10.1016/s0027-5107(98)00038-4. [DOI] [PubMed] [Google Scholar]
- 32.Teng Y, Li S, Waters R, Reed SH. J Mol Biol. 1997;267:324 –337. doi: 10.1006/jmbi.1996.0908. [DOI] [PubMed] [Google Scholar]
- 33.Tommasi S, Oxyzoglou AB, Pfeifer GP. Nucleic Acids Res. 2000;28:3991–3998. doi: 10.1093/nar/28.20.3991. [DOI] [PMC free article] [PubMed] [Google Scholar]
- 34.Hu W, Feng Z, Chasin LA, Tang MS. J Biol Chem. 2002;277:38305–38310. doi: 10.1074/jbc.M206375200. [DOI] [PubMed] [Google Scholar]
- 35.Powell NG, Ferreiro J, Karabetsou N, Mellor J, Waters R. DNA Repair (Amst) 2003;2:375–386. doi: 10.1016/s1568-7864(02)00239-2. [DOI] [PubMed] [Google Scholar]
- 36.Li S, Waters R, Smerdon MJ. Methods Companion Methods Enzymol. 2000;22:170 –179. doi: 10.1006/meth.2000.1058. [DOI] [PubMed] [Google Scholar]
- 37.Li S, Waters R. Carcinogenesis. 1996;17:1549 –1552. doi: 10.1093/carcin/17.8.1549. [DOI] [PubMed] [Google Scholar]
- 38.Gao S, Drouin R, Holmquist GP. Science. 1994;263:1438 –1440. doi: 10.1126/science.8128226. [DOI] [PubMed] [Google Scholar]
- 39.Verhage R, Zeeman AM, de Groot N, Gleig F, Bang DD, van de Putte P, Brouwer J. Mol Cell Biol. 1994;14:6135–6142. doi: 10.1128/mcb.14.9.6135. [DOI] [PMC free article] [PubMed] [Google Scholar]
- 40.Lloyd RS. Mutat Res. 1998;408:159 –170. doi: 10.1016/s0921-8777(98)00032-9. [DOI] [PubMed] [Google Scholar]
- 41.Liu X, Smerdon MJ. J Biol Chem. 2000;275:23729 –23735. doi: 10.1074/jbc.M002206200. [DOI] [PubMed] [Google Scholar]
- 42.Smale ST, Kadonaga JT. Annu Rev Biochem. 2003;72:449 –479. doi: 10.1146/annurev.biochem.72.121801.161520. [DOI] [PubMed] [Google Scholar]
- 43.Giardina C, Lis JT. Science. 1993;261:759 –762. doi: 10.1126/science.8342041. [DOI] [PubMed] [Google Scholar]
- 44.Leadon SA, Lawrence DA. Mutat Res. 1991;255:67–78. doi: 10.1016/0921-8777(91)90019-l. [DOI] [PubMed] [Google Scholar]
- 45.Leadon SA, Lawrence DA. J Biol Chem. 1992;267:23175–23182. [PubMed] [Google Scholar]
- 46.Christians FC, Hanawalt PC. Mutat Res. 1992;274:93–101. doi: 10.1016/0921-8777(92)90056-9. [DOI] [PubMed] [Google Scholar]
- 47.Sweder KS, Hanawalt PC. Proc Natl Acad Sci U S A. 1992;89:10696 –10700. doi: 10.1073/pnas.89.22.10696. [DOI] [PMC free article] [PubMed] [Google Scholar]
- 48.Zheng Y, Pao A, Adair GM, Tang M. J Biol Chem. 2001;276:16786 –16796. doi: 10.1074/jbc.M010973200. [DOI] [PubMed] [Google Scholar]
- 49.Feng Z, Hu W, Komissarova E, Pao A, Hung MC, Adair GM, Tang MS. J Biol Chem. 2002;277:12777–12783. doi: 10.1074/jbc.M112297200. [DOI] [PubMed] [Google Scholar]
- 50.Selby CP, Sancar A. J Biol Chem. 1990;265:21330 –21336. [PubMed] [Google Scholar]
- 51.Selby CP, Sancar A. Science. 1993;260:53–58. doi: 10.1126/science.8465200. [DOI] [PubMed] [Google Scholar]
- 52.Teng Y, Waters R. Nucleic Acids Res. 2000;28:1114 –1119. doi: 10.1093/nar/28.5.1114. [DOI] [PMC free article] [PubMed] [Google Scholar]
- 53.Frit P, Kwon K, Coin F, Auriol J, Dubaele S, Salles B, Egly JM. Mol Cell. 2002;10:1391–1401. doi: 10.1016/s1097-2765(02)00732-3. [DOI] [PubMed] [Google Scholar]