Abstract
The following two factors significantly influence estimates of the maximum specific growth rate (μmax) and the lag-phase duration (λ): (i) the technique used to monitor bacterial growth and (ii) the model fitted to estimate parameters. In this study, nine strains of Listeria monocytogenes were monitored simultaneously by optical density (OD) analysis and by viable count enumeration (VCE) analysis. Four usual growth models were fitted to our data, and estimates of growth parameters were compared from one model to another and from one monitoring technique to another. Our results show that growth parameter estimates depended on the model used to fit data, whereas there were no systematic variations in the estimates of μmax and λ when the estimates were based on OD data instead of VCE data. By studying the evolution of OD and VCE simultaneously, we found that while log OD/VCE remained constant for some of our experiments, a visible linear increase occurred during the lag phase for other experiments. We developed a global model that fits both OD and VCE data. This model enabled us to detect for some of our strains an increase in OD during the lag phase. If not taken into account, this phenomenon may lead to an underestimate of λ.
The following two methods are commonly used to monitor growth of bacteria: viable count enumeration (VCE) and absorbance measurement. Monitoring bacterial growth by VCE is time-consuming and rather expensive, but it remains the method of reference. Methods based on absorbance measurements constitute a second family of methods based on the direct proportionality between the optical density (OD) of a liquid medium and the concentration of bacteria. OD techniques are rapid, convenient, and inexpensive. However, many drawbacks are inherent to these techniques. The main problem encountered is the limited range of validity since the detection threshold typically corresponds to a bacterial concentration greater than 106 bacteria/ml (8).
From these two kinds of data, characteristic growth parameters, mainly the lag-phase duration (λ) and the maximum specific growth rate (μmax), can be assessed. The use of mathematical growth models allows accurate and objective estimation of these parameters. In the field of predictive microbiology, numerous models have been developed. Mechanistic models are especially interesting as they provide both a method of estimating λ and μmax and a means of understanding bacterial growth.
In fact, the following two potential sources of bias influence estimation of growth parameters: the type of data (OD or VCE) and the model used to fit data. Because of the high detection threshold of OD techniques, the initial inoculum must be large enough to allow reliable measurements, and the question which has arisen is whether the estimates of μmax at high concentrations are not systematically lower than the actual μmax because of possible end-of-growth inhibition. Nevertheless, this phenomenon seems to have no effect on the estimates of μmax (9). Hudson and Mott (14) fitted the modified Gompertz equation to Pseudomonas fragi growth data sets and obtained significantly lower λ estimates from OD data than from VCE data. According to these authors, the discrepancy between λ values measured by OD and VCE is due to an increase in cell length during the lag phase. This problem was solved by proposing a linear calibration function. With regard to the μmax, Hudson and Mott (14) found that estimates derived from OD and VCE data were very similar, whereas Dalgaard et al. (12) showed that OD-based estimates of μmax are systematically lower than VCE-based estimates and that the discrepancy differs from one model to another. In fact, the accuracy of estimates of μmax and λ closely depends on the model chosen to fit data (11). In particular, several models proved to be limited in terms of providing precise estimates of growth parameters from absorbance data, whereas other models appeared to be quite relevant. Augustin et al. (1) pointed out that reliable estimates of μmax could be obtained by using a calibration factor constant for Listeria monocytogenes strains. On the other hand, these authors proposed an original method that combines OD and VCE measurements for estimation of λ.
Overall, many authors have emphasized the important variability of growth parameter estimates (especially λ estimates) due to the method used to acquire growth data and to the nature of the model used to fit the growth data.
The aim of the present study was to improve our knowledge concerning the lag phase by acquiring precise OD and VCE growth data simultaneously from the same bacterial culture. We focused on the first stages of growth, namely, the lag phase and the beginning of exponential growth. Various models were fitted to our data in order to obtain information on the quality of fit and on the accuracy for estimating the growth parameters. Particular attention was paid to finding out whether more precise data might help us select an optimal model more easily. In addition, a dynamic study of the evolution of the OD/VCE ratio allowed us to draw attention to an exponential increase in OD that happened during the lag phase for one-half of our strains. If this phenomenon is not taken into account by modeling, it may lead to underestimation of λ. We propose a new model that fits OD and VCE data globally, estimates a single value for μmax and λ, and, if necessary, accounts for the exponential increase in OD.
MATERIALS AND METHODS
Bacterial strains and growth experiments.
Nine strains of L. monocytogenes were studied. Table 1 provides a brief description of these strains.
TABLE 1.
Description of strains
| Strain | Descriptiona |
|---|---|
| III 10111 | L. monocytogenes, food isolate, CLIP 79252 |
| III 10126 | L. monocytogenes Scott A, serotype 4b, CIP 103575 |
| IV 136 | L. monocytogenes, blood culture isolate (CHLS) |
| IV 512 | L. monocytogenes, industry isolate |
| IV 576 | L. monocytogenes, meningitis isolate (CHLS) |
| IV 634 | L. monocytogenes, serotype 4b, clinical isolate (CHLS) |
| IV 644 | L. monocytogenes, food isolate, CLIP 79253 |
| IV 646 | L. monocytogenes, blood culture isolate (CHLS) |
| IV 656 | L. monocytogenes, serotype 1/2a, clinical isolate |
CLIP, Listeria Collection of the Pasteur Institute; CIP, Institut Pasteur Collection; CHLS, Lyon-Sud Hospital.
Stock cultures were maintained at −196°C in brain heart infusion broth (bioMérieux, Marcy l'Etoile, France) containing 10% glycerol. Prior to each experiment, the isolate was grown for 20 h at 20°C in 15 ml of Trypticase soy broth (bioMérieux). This first bacterial culture was diluted in 230 ml of Trypticase soy broth in order to obtain an initial bacterial density of approximately 107 cells/ml. The initial bacterial density was chosen carefully so that it was greater than the OD detection threshold. After inoculation, the strains were grown for 8 h at an incubation temperature of 20°C. The pre- and postincubation conditions were purposely identical in order to reduce sources of variability.
Growth was monitored by obtaining turbidimetric measurements (BioPhotometer 6131; Eppendorf) every 15 min. Concurrently, 100 μl of culture was removed, diluted, and plated in duplicate for VCE.
In addition, in order to ascertain the infrastrain reproducibility of phenomena, three randomly chosen strains (III 10126, III 10111, and IV 644) were monitored twice. Duplicates of these strains, which we designated III 10126b, III 10111b, and IV 644b, were treated in the same way as the other strains, and subsequent analyses took these duplicates into account.
Individual fit of models with OD and VCE data.
Four growth models were fitted to our OD and VCE growth data. These models allowed us to describe the lag phase independent of the rest of the growth kinetics (which is not possible when empirical models, such as the Gompertz and the Logistic models, are used). They also possess biologically interpretable parameters. Explicit equations of these models are described below.
The simplest model is the exponential model. It describes only the exponential phase and does not take into account any lag phase:
 |
(1) |
where x(t) is the bacterial density (in cells per milliliter) at time t (in hours), x0 is the initial bacterial density (in cells per milliliter), and μmax is the exponential growth rate (in hours−1).
The second model which we fitted is an exponential model with delay (ED model), which has been described with different names by various authors (2, 10, 17). Curves obtained from this model show an abrupt transition between the lag phase and the exponential phase:
 |
(2) |
The third model is the model proposed by Baranyi and Roberts (4). Within the framework of our study we used this model without the inhibition function. This model has three parameters:
 |
(3) |
The fourth equation was proposed by Hills and Wright (13). An identical equation results from another model proposed by Baranyi (2, 3). Like the two previous models, this model has three parameters:
 |
(4) |
Global model fit with OD and VCE data.
The model constructed for this study is based on the assumption that there is direct proportionality between turbidimetric measurements obtained by OD (xOD) and VCE (xVCE): xOD(t) = kxVCE(t).
As OD and VCE growth data were obtained simultaneously from the same bacterial cultures we were able to fit a global model to both types of data. By assuming that the proportional relationship described above was true, a simple global model, called the partial model, was defined:
 |
(5) |
where f is a usual growth model function (equations 1 to 4), θ is the vector of growth parameters (x0, λ, and μmax), and k is the xOD(t)/xVCE(t) ratio.
From the partial model (equation 5), we decided to construct another more complex model, which we called the full model. In this model we made the assumption that the OD may increase during the lag phase. We also made the assumption that biomass kinetics can be split into two distinct phases. The first phase occurs during the lag phase and corresponds to an exponential increase in the cell biomass of the nondividing cells. The second phase corresponds to an exponential increase in the biomass due to the successive cell divisions that happen after a delay λ.
 |
(6) |
where μ1 is the rate of increase in the cell OD during the lag phase.
The partial model (equation 5) is nested in the full model (equation 6) as it corresponds to the peculiar case in which the rate of increase in the OD during the lag phase (μ1) is zero.
Fitting procedures and statistical methods.
Stabilization of the variance of the VCE and OD data was done by using the usual logarithmic transformation. Fits of models to the log-transformed data were performed by nonlinear regression by using the least-squares criterion. Estimates for parameters were obtained by minimizing the residual sum of squares (RSS):
 |
where N is the number of data points, yi is the observed value, and ŷi is the fitted value.
Our new model was fitted globally to OD and VCE data. To do this, in each data set we added a control variable describing the type of data (1 for OD and 2 for VCE). Nonlinear regression was computed with the NonLinearRegress function of Mathematica (Wolfram Research) that uses the Levenberg-Marquardt algorithm.
The performance of the models was evaluated by using a comparison of root mean square error (RMSE) ( ) between experimental and predicted data. Additional graphic analysis of residuals and Beale's confidence regions (7) were applied. We also studied the precision of parameter estimates in terms of asymptotic marginal confidence intervals.
To decide which is the simplest nested model to fit data adequately, we used an F test (6):
 |
where n is the data set size, pf is the number of parameters of the full model, pp is the number of parameters of the partial model, RSSf is the residual sum of squares of the full model fit, and RSSp is the residual sum of squares of the partial model fit. The observed F value must be compared with a theoretical F value with ν1 = pf − pp and ν2 = n − pf degrees of freedom.
We compared the growth parameters and the RMSE obtained by fitting the different models to OD and VCE data by carrying out analysis of variance tests (α = 5%) for a randomized block design. Finally, we used a paired t test (α = 5%) to compare estimates of λ and μmax obtained from OD and VCE data.
All the statistical tests were performed by using R software routines (version 1.3.1) (15).
RESULTS
Individual fits of the exponential model and the ED model.
Fits of the exponential model and the ED model were carried out for each growth data set. As the exponential model is nested in the ED model, we were able to compare the fits of the two models and to check whether the lag phase is justified for VCE and OD data sets. For each data set, the ED model, which takes into account the lag phase systematically, fits better than the exponential model (P < 5%). Therefore, a significant lag phase exists for OD- and VCE-based data sets.
Fits of the Baranyi, Hills, and ED models.
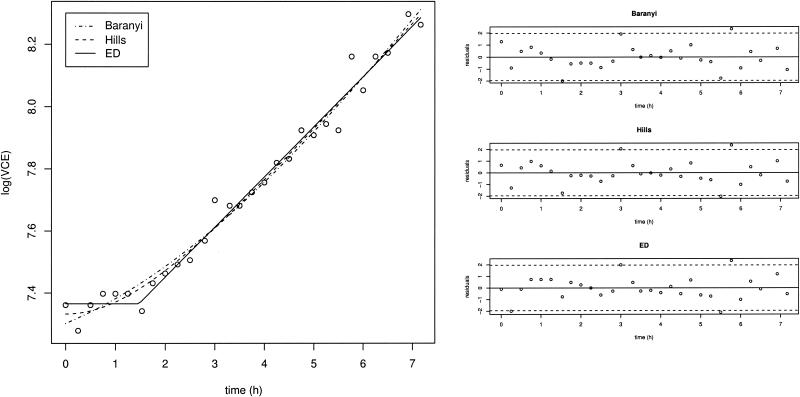
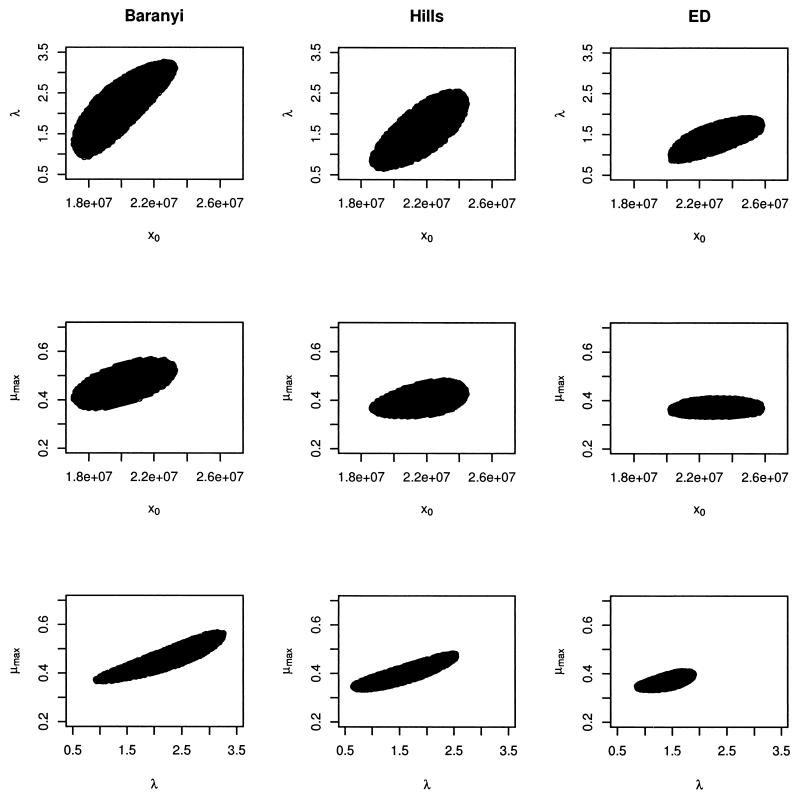
The Baranyi, Hills, and ED models were fitted to both the VCE and OD growth data sets. All of these models proved to be effective in modeling growth curves (Fig. 1 shows an example), and none of them could be invalidated. RMSEs obtained from these fits are presented in Table 2. An analysis of variance test for randomized block design was carried out with the RMSE values. This test indicated that in terms of RMSE, there were no significant differences among the fits of the three models for VCE data (P = 0.39) and for OD data (P = 0.20). Consequently, although the ED model fitted the best in 6 of the 12 cases for VCE data and in 5 of the 12 cases for OD data, none of the models consistently produced the best fit to all the growth curves. Analysis of the Beale 95% confidence regions (Fig. 2 shows an example) revealed an important autocorrelation between λ and μmax, especially for the Baranyi and Hills models. The greatest precision in the estimates of x0, λ, and μmax was obtained when the ED model was fitted.
FIG. 1.
Fit for the strain IV 512 data set with the Baranyi, Hills, and ED models. Three corresponding scatter plots of normed residuals are presented on the right.
TABLE 2.
RMSE obtained after fitting of the Baranyi, Hills, and ED models
| Strain | RMSE
|
|||||
|---|---|---|---|---|---|---|
| VCE fits
|
OD fits
|
|||||
| Baranyi | Hills | ED | Baranyi | Hills | ED | |
| III 10111 | 0.056 | 0.052 | 0.051a | 0.034 | 0.031 | 0.028a |
| III 10111b | 0.039a | 0.040 | 0.044 | 0.024a | 0.025 | 0.028 |
| III 10126 | 0.052 | 0.051a | 0.054 | 0.030 | 0.027a | 0.029 |
| III 10126b | 0.025a | 0.025 | 0.032 | 0.046 | 0.045 | 0.045a |
| IV 136 | 0.052 | 0.050a | 0.051 | 0.035 | 0.033a | 0.037 |
| IV 512 | 0.047 | 0.045 | 0.044a | 0.038 | 0.031 | 0.026a |
| IV 576 | 0.054 | 0.052 | 0.052a | 0.090 | 0.080 | 0.068a |
| IV 634 | 0.054 | 0.052 | 0.052a | 0.074 | 0.068 | 0.064a |
| IV 644 | 0.094 | 0.091 | 0.085a | 0.045a | 0.045 | 0.056 |
| IV 644b | 0.059 | 0.056 | 0.043a | 0.030 | 0.022a | 0.031 |
| IV 646 | 0.054a | 0.054 | 0.057 | 0.031 | 0.030a | 0.038 |
| IV 656 | 0.048 | 0.048a | 0.049 | 0.031 | 0.029a | 0.029 |
| Mean | 0.053 | 0.051 | 0.047 | 0.042 | 0.039 | 0.040 |
| SD | 0.016 | 0.015 | 0.013 | 0.020 | 0.018 | 0.015 |
Lower RMSE.
FIG. 2.
Plots of 95% confidence regions for estimated growth parameters obtained by fitting the Baranyi, Hills, and ED models (strain IV 512).
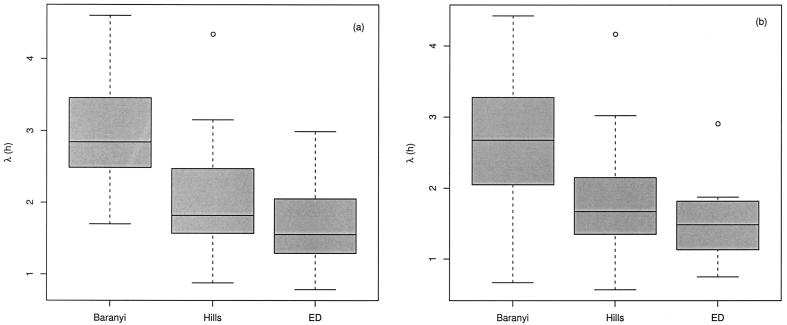
Estimates of λ were obtained by fitting the three growth models. Figure 3 shows box plots of the estimates from OD and VCE data. Furthermore, the results show that there were significant differences in the estimates of λ provided by the three models for VCE data (P = 4 × 10⁻¹¹) and for OD data (P = 3 × 10⁻⁷). As far as our data were concerned, we obtained systematically higher estimates of λ when the Baranyi model was fitted, whereas the lowest estimate of this parameter was obtained when the ED model was fitted. We presumed that the bias might be all the more important since the λ was short. In addition, there were no significant differences between λ estimates obtained from OD and VCE data for the Baranyi model (P = 0.50), the Hills model (P = 0.50), or the ED model (P = 0.51).
FIG. 3.
Box plots of the estimates of λ obtained by fitting the Baranyi, Hills, and ED models to VCE (a) and OD (b) data sets. The 25th, 50th, and 75th percentiles and extreme values are shown.
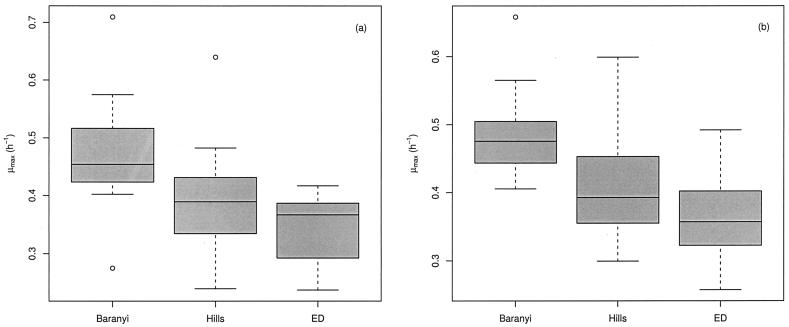
Similarly, growth rate estimates are shown in Fig. 4. The results show that there were significant differences in growth rate estimates among the three models for VCE data (P = 3 × 10⁻⁸) and for OD data (P = 4 × 10⁻⁸). While we found that compared with the other models the Baranyi model tended to systematically give higher estimates of λ, we demonstrated that it also gave higher estimates of μmax. As for the lag, there were no significant differences between the estimates obtained from the two kinds of data for the Baranyi model (P = 0.69), the Hills model (P = 0.66), and the ED model (P = 0.35).
FIG. 4.
Box plots of the estimates of μmax obtained by fitting the Baranyi, Hills, and ED models to VCE (a) and OD (b) data sets. The 25th, 50th, and 75th percentiles and extreme values are shown.
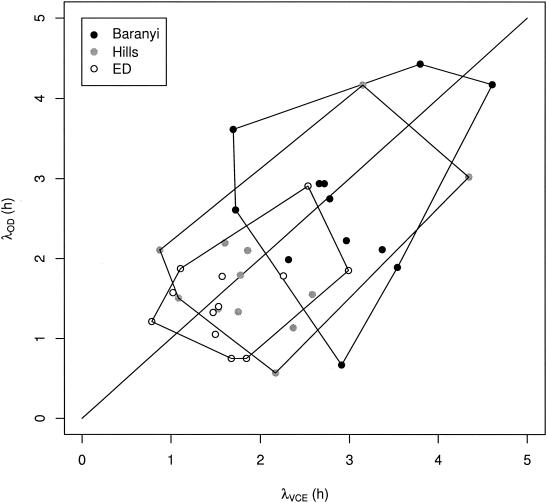
When we compared globally the estimates of λ based on OD and VCE data, we found no significant differences. However, individual comparisons sometimes revealed discrepancies between the estimates of λ based on OD and VCE data. Hudson and Mott (14) found that λ estimates based on OD data were systematically smaller than λ estimates based on VCE data. These authors explained their results by the existence of cell inflation during the lag phase. In our study, we showed that there was no systematic one-sided bias in estimates of λ (Fig. 5).
FIG. 5.
Deviation in the estimates of λ based on OD and VCE data obtained by fitting the Baranyi, Hills, and ED models. The λ estimates obtained from each model are circumscribed.
Evolution of the OD/VCE ratio over time.
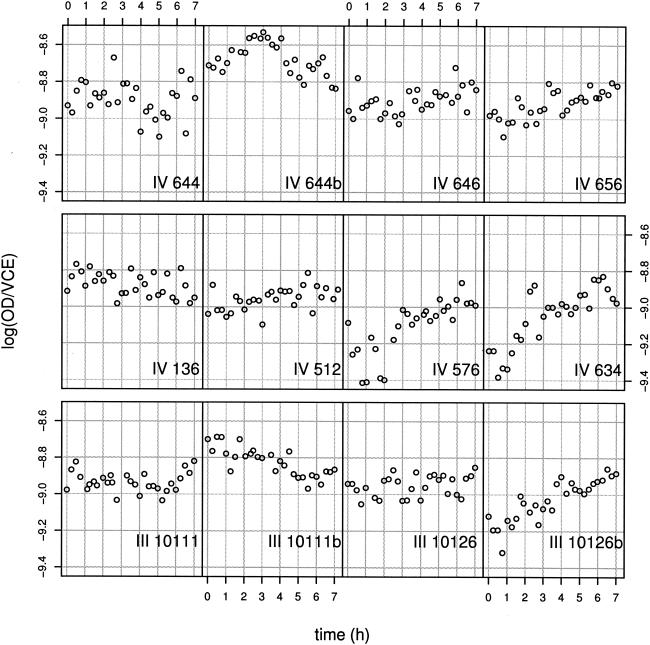
The next step in our study consisted of trying to understand why the variations in the λ estimates occur. We studied the evolution of the logarithm of the OD/VCE ratio for the first phases of growth (Fig. 6). We managed to get information concerning the variation in the OD per cell unit.
FIG. 6.
Plot of log OD/VCE against time for the 12 strains.
Our results show that the log OD/VCE values are particularly constant around −8.9. However, in a few cases, we detected a slight linear increase in log OD/VCE from a lower value to roughly −8.9 (e.g., for strain IV 576, IV 634, or III 10126b). As the VCE value remained constant during the lag phase, this increase in the ratio was substantially due to an increase in the OD. Indeed, the cells for which we observed a visible increase had a lower absorbance around zero time. The increase in OD could be explained either by an increase in the cell biovolume or by an increase in the cell refraction.
Global modeling of the increase in OD/VCE during the lag phase.
We fitted a global model (equations 5 and 6) for each pair of OD and VCE data sets. The full model accounts for an increase in the OD during the lag phase, whereas no increase in the OD is modeled in the partial model. As previously demonstrated, the ED model proved to have particularly good statistical properties. As a result, we chose to model xVCE by using the ED model (f function in equations 5 and 6). The log-transformed global models used to fit our log-transformed data can be expressed as described below.
The equations for the partial model are as follows:
 |
(7) |
where y0 and α are the decimal logarithms of x0 (initial VCE) and k (the xOD/xVCE ratio), respectively.
The equations for the full model are as follows:
 |
(8) |
We fitted the partial model and the full model to our experimental data and compared the fits of the two nested models by using an F test. The results showed that for 6 of 12 data sets the full model fitted significantly better than the partial model (Table 3).
TABLE 3.
Parameter estimates obtained by fitting the global model to the experimental data (simultaneously obtained OD and VCE data) and P values obtained with the nested model F test
| Strain | y0 | λ (h) | μI (h−1) | μmax (h−1) | α | RMSE | F test P |
|---|---|---|---|---|---|---|---|
| III 10111 | 7.21 | 1.29 | 0 | 0.25 | −8.93 | 0.039 | 0.248 |
| III 10111b | 7.31 | 1.06 | 0 | 0.34 | −8.82 | 0.046 | 0.053 |
| III 10126 | 7.32 | 1.4 | 0 | 0.33 | −8.95 | 0.041 | 0.299 |
| III 10126b | 7.44 | 2.45 | 0.29 | 0.35 | −8.97 | 0.045a | 1 × 10⁻⁸ |
| IV 136 | 7.46 | 1.63 | 0 | 0.36 | −8.88 | 0.044 | 0.863 |
| IV 512 | 7.36 | 1.53 | 0.11 | 0.39 | −8.95 | 0.036a | 0.034 |
| IV 576 | 7.44 | 2.46 | 0.27 | 0.43 | −9.06 | 0.072a | 3 × 10⁻⁴ |
| IV 634 | 7.45 | 2.14 | 0.48 | 0.44 | −8.98 | 0.064a | 4 × 10⁻⁸ |
| IV 644 | 7.38 | 2.69 | 0 | 0.4 | −8.9 | 0.069 | 0.716 |
| IV 644b | 7.25 | 2.64 | 0 | 0.34 | −8.68 | 0.049 | 0.444 |
| IV 646 | 7.33 | 1.88 | 0.12 | 0.34 | −8.89 | 0.049a | 0.044 |
| IV 656 | 7.37 | 1.75 | 0.2 | 0.32 | −8.9 | 0.043a | 8 × 10⁻⁴ |
The full model was used to fit data.
By constructing and fitting our global model, we found that the evolution of OD exhibits different patterns (Fig. 7). In some cases, there is no increase in OD during the lag phase. In other cases, one can detect an exponential increase in OD, whose intensity varies according to the strain and according to the experiment.
FIG. 7.
Fit of the global model for three pairs of data sets, the data sets for strains IV 644 (a), IV 646 (b) and III 10126b (c). For reasons of clarity, the two plots were superimposed by subtracting α from the log OD data. Parameter estimates for the global model are also shown.
DISCUSSION
The aim of this study was to compare the estimates of λ obtained by fitting different classical growth models (Baranyi, Hills, and ED models) to different kinds of data (OD and VCE data). In terms of RMSE, we could not invalidate any model. Indeed, none of the models fitted systematically better than the others. However, our results show that there are rather important differences among the estimates of λ when different models are used to fit data. In particular, the Baranyi model gives high estimates of λ (on average 46% higher for OD data and 49% higher for VCE data than the Hills model and 80% higher for OD and VCE data than the ED model). As a result, the choice of the model fitted to estimate λ appears to be crucial. The technique used to monitor bacterial growth seems to be less influential. Nevertheless, by analyzing strain growth curves one by one with OD and VCE data, we found that sometimes there is a large difference between λ estimates based on the two kinds of data. By simultaneously monitoring the evolution of VCE and OD, we managed to find an increase in OD due not to an increase in cell number but rather to an increase in mean cell volume or to an increase in a mean cell refraction.
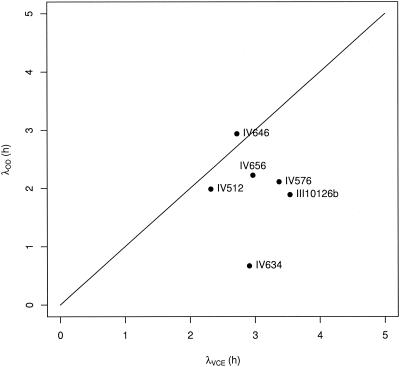
We showed that the increase was not systematic and that this phenomenon occurred in only 50% of our experiments. It is also worth noting that this phenomenon is not strain dependent. Indeed, the same strain used twice in experiments may not have the same growth pattern. Consequently, this growth behavior seems not to be due to interstrain variability but rather to an important population sensibility to growth and pregrowth conditions. With regard to L. monocytogenes, we found that the mean log OD/VCE value measured at the end of the lag phase and during the exponential phase is constant, whereas the first values measured at the beginning of the lag phase tend to be lower for strains that show an increase in the OD during the lag phase. Thus, by determining the initial values of the OD/VCE ratio, one could predict whether an increase in OD is likely. Additional data are necessary to confirm these assumptions. However, we assume that predicting this phenomenon is essential. When this phenomenon is not taken into account, lower estimates of λ may be obtained with OD data than with VCE data, as we observed, for example, with the Baranyi model (Fig. 8).
FIG. 8.
λ estimates obtained by fitting the Baranyi model individually to OD and VCE data for the six strains for which significant increases in OD were detected.
The increase in OD reflects what happens at the cell level. If it is due to an increase in mean cell volume, the data may suggest that cells need to reach an appropriate volume prior to initiating their first division (14). On the other hand, if the increase in OD is due to an increase in mean cell refraction, the data may suggest that cells need to accumulate intracellular substances necessary for growth (5) and tend to absorb light more intensively. In the latter case, dynamic study of the evolution of the OD/VCE ratio can be related to a method which allows us to monitor the evolution of the main internal molecules (essentially DNA, RNA, and proteins). As previously mentioned by authors working on the stochastic aspects of the lag phase (3, 16), new approaches based on analysis of individual cells (microscopy, flow cytometry, etc.) should help us explain the phenomenon observed and, more generally, improve our understanding of the lag phase.
Acknowledgments
We thank G. Fardel for technical assistance. We are also very grateful to M. McInnes and N. Harris, who checked the manuscript for correct use of English.
REFERENCES
- 1.Augustin, J. C., L. Rosso, and V. Carlier. 1999. Estimation of temperature dependent growth rate and lag time of Listeria monocytogenes by optical density measurements. J. Microbiol. Methods 38:137-146. [DOI] [PubMed] [Google Scholar]
- 2.Baranyi, J. 1998. Comparison of stochastic and deterministic concepts of bacterial lag. J. Theor. Biol. 192:403-408. [DOI] [PubMed] [Google Scholar]
- 3.Baranyi, J. 2002. Stochastic modelling of bacterial lag phase. Int. J. Food Microbiol. 73:203-205. [DOI] [PubMed] [Google Scholar]
- 4.Baranyi, J., and T. A. Roberts. 1994. A dynamic approach to predicting bacterial growth in food. Int. J. Food Microbiol. 23:277-294. [DOI] [PubMed] [Google Scholar]
- 5.Baranyi, J., T. A. Roberts, and P. J. McClure. 1993. A non-autonomous differential equation to model bacterial growth. Food Microbiol. 10:43-59. [Google Scholar]
- 6.Bates, D. M., and D. G. Watts. 1988. Nonlinear regression analysis and its applications. John Wiley & Sons, Chichester, United Kingdom.
- 7.Beale, E. M. L. 1960. Confidence regions in non-linear estimations. J. R. Stat. Soc. 22B:41-88. [Google Scholar]
- 8.Begot, C., I. Desnier, J. D. Daudin, J. C. Labadie, and A. Lebert. 1996. Recommendations for calculating growth parameters by optical density measurements. J. Microbiol. Methods 25:225-232. [Google Scholar]
- 9.Buchanan, R. L., and J. G. Phillips. 1990. Response surface model for predicting the effects of temperature, pH, sodium chloride content, sodium nitrite concentration and atmosphere on the growth of Listeria monocytogenes. J. Food Prot. 53:370-381. [DOI] [PubMed] [Google Scholar]
- 10.Buchanan, R. L., R. C. Whiting, and W. C. Damert. 1997. When is simple good enough: a comparison of Gompertz, Baranyi, and three-phase linear models for fitting bacterial growth curves. Food Microbiol. 14:313-326. [Google Scholar]
- 11.Dalgaard, P., and K. Koutsoumanis. 2001. Comparison of maximum specific growth rates and lag times estimated from absorbance and viable count data by different mathematical models. J. Microbiol. Methods 43:183-196. [DOI] [PubMed] [Google Scholar]
- 12.Dalgaard, P., T. Ross, L. Kamperman, K. Neumeyer, and T. A. McMeekin. 1994. Estimation of bacterial growth rates from turbidimetric and viable count data. Int. J. Food Microbiol. 23:391-404. [DOI] [PubMed] [Google Scholar]
- 13.Hills, B. P., and K. M. Wright. 1994. A new model for bacterial growth in heterogeneous systems. J. Theor. Biol. 168:31-41. [DOI] [PubMed] [Google Scholar]
- 14.Hudson, J. A., and S. J. Mott. 1994. Comparison of lag times obtained from optical density and viable count data for a strain of Pseudomonas fragi. J. Food Safety 14:329-339. [Google Scholar]
- 15.Ihaka, R., and R. Gentleman. 1996. R: a language for data analysis and graphics. J. Comput. Graph. Stat. 5:299-314. [Google Scholar]
- 16.McKellar, R. C., and K. Knight. 2000. A combined discrete-continuous model describing the lag phase of Listeria monocytogenes. Int. J. Food Microbiol. 54:171-180. [DOI] [PubMed] [Google Scholar]
- 17.VanGerwen, S., and M. H. Zwietering. 1998. Growth and inactivation models to be used in quantitative risk assessments. J. Food Prot. 61:1541-1549. [DOI] [PubMed] [Google Scholar]


