Abstract
In this work, we report on studies of the nature of the dynamics and hydrophobic binding in cyclodextrins and human serum albumin protein complexes with orange II. With femtosecond time resolution, we examined the proton-transfer and trans-cis isomerization reactions of the ligand in these nanocavities and in pure solvents. Because of confinement at the ground state, the orientational motion in the formed phototautomer is restricted, leading to a rich dynamics. Therefore, the emission lifetimes span a large window of tens to hundreds of picoseconds in the cavities. Possible H-bond interactions between the guest and cyclodextrin do not affect the caged dynamics. For the protein–ligand complexes, slow diffusional motion (≈630 ps) observed in the anisotropy decay indicates that the binding structure is not completely rigid, and the embedded guest is not frozen with the hydrophobic pocket. The ultrafast isomerization and decays are explained in terms of coupling motions between N–N and C–N stretching modes of the formed tautomer. We discuss the role of confinement on the trans-cis isomerization with the cavities and its relationships to frequency and time domains of nanostructure emission.
Keywords: cyclodextrins, protein, H-bond, twisting, anisotropy
Femtosecond (fs) studies of caged molecules in nanocavities provide direct information on the relationship between time and space domains of molecular relaxation (1). Therefore, simple and complex (in concept) molecular systems have been studied using cyclodextrins (CDs), proteins, micelles, pores, and zeolites as nanohosts, demonstrating the confinement effect of the hydrophobic nanocavities on the spectroscopy and dynamics of the guests (2–13). Relevant information on the ultrafast dynamics of caged wavepackets involving breaking/making chemical bonds, and solvation has been acquired.
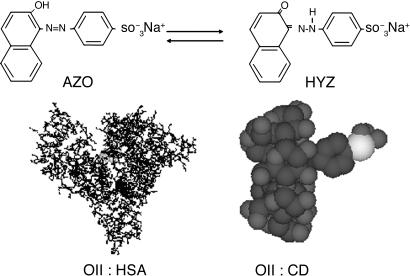
Orange II (OII) (Fig. 1), also called acid orange 7, is a molecule that has O–H... N and N N bonds and may show photoinduced intramolecular proton-transfer (IPT) and transcis isomerization reactions. It is widely used in the dyeing of textiles, food, and cosmetics and thus is found in the wastewaters of the related industries (14). It has been reported that it exists under azoenol (AZO) and ketohydrazone (HYZ) forms (Fig. 1) (15–20). In a water solution, for example, the H-atom within the O–H... N intramolecular H-bond is shifted to the nitrogen site, making HYZ structure the most stable one (≈95%) (20). In DMSO, the HYZ population decreases to 70%, and in solid state it becomes the only populated structure (20). Recent x-ray studies of phenyl substituted 1-(arylazo)-2-naphthols showed that this kind of molecules displaying HYZ–AZO tautomerism can form intramolecular resonance-assisted H-bonds from pure N–H... O to pure N... H–O structures, depending on the phenyl derivative (21, 22). Furthermore, a recent photophysical study of similar molecules in solution has shown the occurrence of a photoinduced proton-transfer reaction in AZO to give HYZ structure with a very low emission quantum yield (10–7) (23). The inclusion complexes of OII and CDs have been studied by several groups showing the formation of a 1:1 entity (24–35). So far, the CD inclusion complex studies have considered that OII in water solutions exists under AZO tautomer, contrary to many studies in solutions where OII coexists under AZO and HYZ forms (5–20). Recently, ultrafast transient lens technique with a response function of ≈300 fs has been used to study the dynamics of OII in CD (36). The slowing of the longest component in CD (13 ps in water, 28 ps in β-CD, and 140 ps in γ-CD solutions) observed in the ultrafast transient lens signal was explained in terms of restriction to trans-cis isomerization of AZO tautomer due to H-bond formation between CD and the guest (36). The used ultrafast transient lens technique is sensitive to the molecular configuration changes induced by light and reflected in the refractive index of the solution-thermal lens effect at both ground and excited states (36, 37).
Fig. 1.
Molecular structure of OII in its AZO and hydrazoketo (HYZ) tautomers. Possible nanostructures of 1:1 entity complexes between OII in its AZO form and β-CD (Right) and HSA protein (Left).
In this work, we report on the picosecond (ps) and fs emission studies of trans-OII in the following media: water, few organic solvents, CD, and human serum albumin (HSA) protein (Fig. 1). We believe that the present work shines more light on the photodynamics of OII, and the results might be used for a better understanding of other systems undergoing isomerization reactions like retinal rhodopsin (38–44).
Materials and Methods
Materials. OII, the used solvents, CDs, and HSA protein (spectroscopy grade, Sigma-Aldrich) were used as received. For HSA solutions, a phosphate buffer solution (pH ≈7) was used.
Methods. UV-visible absorption and emission spectra were recorded on Varian (Carry E1) and PerkinElmer (LS-50B) spectrophotometers, respectively. ps time-resolved emission measurements at magic-angle were done by using a time-correlated single-photon counting ps spectrophotometer (FluoTime 200, Picoquant, Berlin) exciting at 393 nm (instrument response function: IRF ≈ 65 ps at 20 MHz) (45).
fs time-resolved emission transients were recorded by using the fluorescence upconversion technique. Briefly, a 60-fs pump pulse (0.25 nJ, 86 MHz) was set at 390 nm to excite the sample found in a 0.4-mm quartz rotating cell, and the remaining fundamental at 780 nm gated the emission collected and focused by reflective optics on 0.3-mm β-barium borate (BBO) crystal (46). Details for experiments and data analysis are given in Supporting Text, which is published as supporting information on the PNAS web site. All experiments were done at 293 ± 1 K.
Results and Discussion
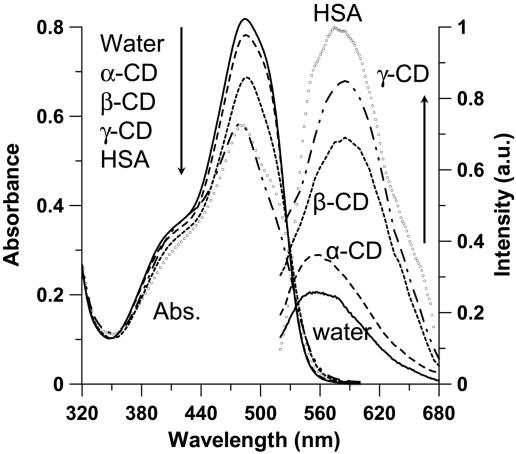
Fig. 2 shows the UV-visible absorption and emission spectra in water and in the presence of 15 mM CD and of 20 μM HSA. Upon addition of β- and γ-CD (interior diameter, d ≈ 8.5 and 9.5 Å, respectively), the decrease in absorption intensity at ≈485 nm is clear, whereas for α-CD, a smaller cavity (d ≈ 5.7 Å), the change is weaker. According to previous reports, we explain these changes in terms of inclusion complex formation (1:1 stoichiometry) between OII and CD (Fig. 1) (24–35). The inclusion equilibrium constants in α-, β-, and γ-CD water solutions (buffer at pH 3.6) are ≈470, 5 × 10³, and 5 × 10⁴ M–1, respectively (35). The ordering of these values accords with the change in the absorption intensity at 485 nm and shows the cavity size importance on trapping OII. Upon encapsulation, the hydrophobic nature of the interior of CD cage (in many studies compared with tetrahydrofuran (THF) polarity and hydrophobicity) converts trans-HYZ (485 nm) to trans-AZO (400 nm) caged tautomer. The change in the absorption intensity at the 390- to 400-nm region is weak and not like that at 485 nm because of a decrease of the contribution of HYZ absorption in this region and may be due to a lower molar absorption coefficient (ε) of trans-AZO or comparable ε for both tautomers in this region (total ε = 7,000 and 18,500 M–1·cm–1 at 400 and 485 nm, respectively. The inclusion of OII under its trans-AZO form into CD proceeds through the naphthol unit (Fig. 1) (24, 25), and the degree of penetration depends on the size of the cavity, being higher in a larger one (24, 27, 28).
Fig. 2.
UV-visible absorption (Left) and emission (Right) spectra of OII in water (solid line) and in presence of 15 mM α-CD (dashed line), β-CD (dotted line), γ-CD (dash-dot line), and 20 μM HSA protein (open circles). For clarity, the HSA emission spectrum was multiplied by 0.05. The excitation wavelength was 390 nm.
For emission, in absence of CD and upon excitation at 390 nm (or 500 nm) the intensity is very weak, peaking at 550 nm (Fig. 2). Addition of 15 mM β- and γ-CD induces a twofold change: (i) an increase in emission intensity and (ii) an ≈900 cm–1 red shift of the maximum (from 560 to 590 nm). Excitation spectra (data not shown) recorded at different wavelengths of observation show that the emitting structure originates from encapsulated trans-AZO. At 485 nm, where trans-HYZ absorbs, a very weak absorption band is recorded in agreement with a previous report on phenyl-substituted 1-(arylazo)-2-naphthols in solution (23). The large Stokes shift (≈8,700 cm–1) of the emission relatively to the absorption of the encapsulated trans-AZO suggests the production of an excited-state IPT in the caged trans-AZO to produce an encapsulated trans-HYZ. The increase in emission intensity in the presence of CDs is explained in terms of increase of trans-AZO population upon encapsulation and restriction in motion of caged and photoproduced HYZ structure. However, 13C-T1 measurements have shown that for some populations of OII:β-CD complexes, the guest molecule still can move within the cavity (26, 27).
For HSA solutions, the trends are similar to those of CDs (Fig. 2). Compared with CD solutions, the position of the maxima of absorption bands does not show a significant change suggesting comparable ground-state interactions (hydrophobic) of the guest with these hosts. The large decrease in absorbance intensity of trans-HYZ (485 nm) is due to its conversion to trans-AZO upon encapsulation as it happens for CD solutions. From the decrease at 485 nm upon addition of HSA, the deduced apparent association complex (1:1 entity) is (1 ± 0.2) × 106 M–1 at 294 K (see Fig. 8, which is published as supporting information on the PNAS web site). For emission, in the presence of 20 μM HSA the intensity of HYZ is almost 20 times that observed in water.
Ps Observation. Therefore, to get information on the ps relaxation, we recorded ps emission decays at different wavelengths. Excitation at 393 nm mainly pumps the trans-AZO structure to S1, and a small fraction of trans-HYZ to highly vibrational states of its S1. Fig. 9 and Table 1, which are published as supporting information on the PNAS web site, show the decays and data of their fitting. For THF, ethylene glycol, and triacetin solutions, we only observed fast decays (data not shown), which could not be resolved by the used ps-apparatus. This result suggests that the time constants of the emission decays are <10 ps, the shortest time that we can have after fitting a deconvoluted decay. For water solution, a time of ≈12 ps was measured. Adding 15 mM β-CD to water solution, the decay becomes longer. At 560 nm, a multiexponential fit gives time constants of 25 ps (89%), 150 ps (10%), and 0.9 ns (1%). At 630 nm, the fit gives 45 ps (66%), 175 ps (33%), and 0.7 ns (1%). Therefore, at red region, although the very small contribution of the 0.7- to 0.9-ns component does not change, those of the 25–45 and 150–175 ps show clear decrease and increase, respectively. The longest component is absent in the used neat solvents. As described in the introduction, a previous report using fs-ultrafast transient lens technique gave times of 13, 28, and 140 ps for water, β-, and γ-CD solutions, respectively (36). Therefore, the shortest ps-times observed with our ps-setup are reliable. Both ps times in CD solutions increase at the red region. This result indicates the presence of different confined geometries in the inclusion complexes of CD having different degrees of penetration/confinement of the naphthol part and thus different locations of the N N bond of AZO into the cavity. We observed no ps-rising component at longer wavelengths, suggesting the absence of a common ps-channel connecting the structures leading to these emissions. By using γ-CD, a wider nanocavity, we observed the same trend (Table 1). The contribution of the 135–175 ps components in the signal increases at longer wavelengths of observation (Table 1), indicating a red emission of these species assigned to encapsulated cis-HYZ tautomers. In these nanostructures, nonradiative processes are still efficient and most probably due to crossing between (n, π *) and (π, π *) states enhanced by twisting motion. Because the contribution of the 25- to 45-ps component is larger at the blue side of the emission band, we assigned these times to emission lifetimes of no-relaxed encapsulated trans-HYZ. At the microscopic scale, the heterogeneity in the complexed population leads to a large distribution at S0 leading to different routes for ultrafast relaxation from S1 or to produce different twisted and encapsulated cis-HYZ rotamers. Recently, Diau and coworkers (47) reported that the trajectories for rotation-free and rotation-restricted trans-cis photoisomerization of an azobenzene derivative are different, giving different relaxed states through different mechanisms.
For HSA solution, the emission decay (Fig. 9 and Table 1) gives time constants of 35–45 and 185–205 ps. The small 0.7- to 0.9-ns component observed in CD is also absent in HSA as in neat solvents, suggesting that its presence in CD complexes might be due to a possible specific interactions (H-bonding) between the sulfonate group of the guest found outside of CD cavity and water molecules located at the largest CD gate. Within the protein, the guest is more embedded and therefore protected from the specific interactions of the biological water molecules (Fig. 1). The ps decaying components in HSA have time constants slightly longer than the corresponding ones in CD (135–175 ps), reflecting a larger docking of OII within the hydrophobic pocket of the protein.
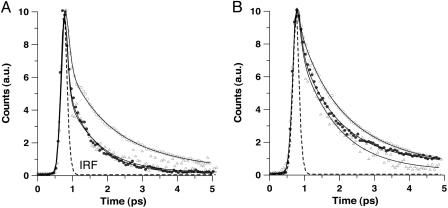
Femtochemistry in Solution. To get information on the first events after excitation at 390 nm, we gated the fs-emission transients at different wavelengths of observation. The related data are posted in Table 2, which is published as supporting information on the PNAS web site. Fig. 3 shows the fs-transients in neutral water, THF, and DMSO gated at 530 and 620 nm. The 530-nm transients for water and THF solutions show ultrafast (<50 fs) and fast (≈1 ps) decaying components. At 620 nm, a slower ps component appears, giving a time constant of 4.1–4.4 ps. In DMSO, this component also observed at 530 nm gives a shorter time, 2.5 ps. The transients in water and in THF are very similar suggesting that they reflect a similar dynamics. The 530-nm transients are indicative of an ultrafast relaxation of the formed (hot) trans-HYZ tautomers after an ultrafast proton transfer in trans-AZO, whereas the 620-nm transients in water may involve solvent relaxation/cooling, N–N and/or C–N twisting/rotation in HYZ isomers. The similar trends observed in solvents of different polarity and H-bonding ability (water, THF, and DMSO; see Table 2) suggest that these characteristics of the medium do not play a key role in the ultrafast dynamics of trans-OII.
Fig. 3.
Fs-emission transients of OII at 530 nm (A) and 620 nm (B) in water (•), THF (▵), and DMSO (□). The dashed line corresponds to the cross-correlation signal (IRF, 170 fs), and the solid lines are from the best fits giving times shown in Table 2.
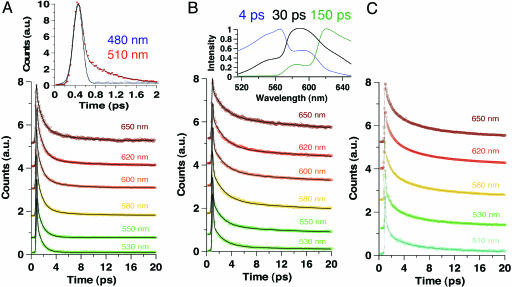
Therefore, we studied the confinement effect on this dynamics. Fig. 4 shows the transients in water and in presence of β-CD and HSA. The emission signals of the samples show an ultrafast decaying component (≈50–85 fs) followed by the slowest ones. Fig. 4A Inset shows the transients at the bluest region (480 and 510 nm), giving times of ≈30 fs and ≈0.9 ps. At 480 nm, the transient was fitted by using a single-exponential function with a time constant of 30 fs. Because the trans-AZO structure should emit in this interrogated spectral, this ultrafast time might be considered as a limit for the excited-state IPT reaction time in trans-AZO to give trans-HYZ. The 0.9-ps component observed in water and in THF solutions can be considered as an emission lifetime of trans-HYZ, whereas the 2.5–4.4 ps recorded at longer wavelengths reflects the lifetime of twisted HYZ. The formation of twisted (or cis) HYZ should occur in <1 ps. The very short emission lifetimes of both trans- and cis-HYZ reflect the involvement of very efficient nonradiative channels, probably due to a crossing between (π, π *) and (n, π *) potential-energy surfaces enhanced by twisting/torsional motion. In presence of β-CD, the slowest component is now longer than tens of ps as observed in the ps experiment. In the fs experiments (20 ps gating window), the fits give times of 50–85 fs, 1.6–2.5 ps, and 15–45 ps. The contribution of the shortest ps-component becomes larger, and its time increases at the red region: 11% at 530 nm and 25% at 620 nm.
Fig. 4.
Fs-emission transients of OII in water (A) and in the presence of 15 mM β-CD (B) and 20 μM HSA protein (C). The solid lines are from the best fits giving times posted in Table 2. A Inset shows the fs-transients at 480 and 510 nm. B Inset displays time-resolved emission spectra at three gating times as indicated.
To get information on the spectral evolution with time, Fig. 4B Insets shows normalized time-resolved emission spectra of OII in presence of β-CD. Clearly, the shape and wavelength of the maximum of the spectra depend on the gating time. At 4 ps, the spectrum is large, and its maximum is at 560 nm. At 30 ps, the maximum shifts to 590 nm, and at 150 ps the shift is to 620 nm. These spectra reflect the emission of the main involved structures in β-CD solution, and the heterogeneity in the population of the complexes. The steady-state emission spectrum (Fig. 2) depends on their contribution and quantum yield. At 4 ps, the spectrum is mainly due to the fastest components governed by free (trans- and cis-HYZ in water) and nonrelaxed caged trans-HYZ structures. At 30 ps, for which the maximum is at 590 nm and similar to that of steady-state observation, the emission is mainly due to caged trans-HYZ tautomers for which twisting is restricted. Finally, at longer times, the spectrum is centered at 620 nm and is due to fully relaxed caged cis-HYZ structures.
To compare the effects of viscosity and cavity restriction on the fs-dynamics of OII, we recorded transients at short (530 nm) and long (620 nm) wavelengths of observation in water, ethylene glycol, and in presence of 15 mM β-CD. In viscous media, triacetin and ethylene glycol (viscosity, η (20°C) ≈ 20 cP; (1 P = 0.1 Pa·s), the fits of the transients (data not shown) give times of ≈40 fs, 1.1–1.6 ps, and 4.5–7.5 ps. Compared with water, the slowest component is observed at green and red regions but with a smaller contribution at the green side (Table 2). Clearly, the isomerization processes and relaxation of trans- and cis-HYZ depend on the viscosity of the medium. However, the transients recorded for CD solutions show the longest components. This result reflects a large effect of CD confinement when compared with a 20-cP viscous solvent, and the involvement of different nanostructure having different degree and way of encapsulation by CDs.
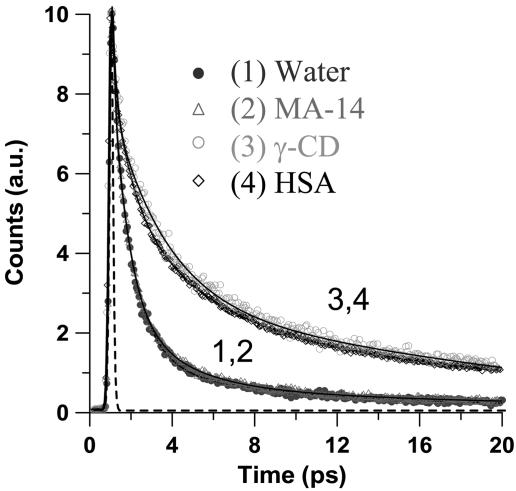
Femtochemistry in Different CD Cavity Sizes. To examine the effect of cavity size and nature, and its ability to form H-bonds with the guest, we also studied the fs-dynamics of OII in presence of γ-CD, maltodextrins having 7 or 14 maltose units (7- or 14-MA), and of HSA. The 7- or 14-MA molecule lacks the torus shape of CD and therefore cannot encapsulate guests as CD does. Fig. 5 shows the 620-nm transients, and Table 2 contains the related data. For γ-CD solutions, the trend is similar to that found in β-CD. Therefore, because the fs-relaxation dynamics of OII is not different in time domain when we change the cavity size (β-CD vs. γ-CD), we anticipate that the fs-caged dynamics also would be similar in space domain. Secondly, because the presence of 15 mM 7- or 14-MA does not alter the fs and ps transients of OII in water, we explain the effect of CD in terms of restriction in motion of the –N–N-phenyl part of trans-HYZ tautomer. The restriction is due to the cavity size of the host and not the involvement of H-bonding interactions between the guest and the host, as suggested by a previous report (36). Indeed, in that work, the full dynamics was explained in terms of trans-cis isomerization in the AZO structure, and the possibility of proton transfer reaction was not examined.
Fig. 5.
Fs-emission transients of OII at 620 nm in water (•), in presence of 15 mM 14-maltodextrin (▵) and γ-CD (□) and 20 μM HSA (⋄). The dashed line corresponds to the cross-correlation signal, and the solid lines are from the best fits giving times shown in Table 2.
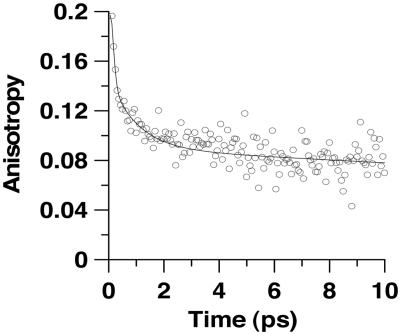
Femtochemistry in HSA Cavity. For HSA solution (Fig. 4), the observed times (40–85 fs, 1.7–2.6 ps, and 15–45 ps) are similar to those of CD transients (Table 2). Therefore, comparable dynamics occur in both chemical and biological nanocavities. To get more information on the confinement of the biological nanostructure, we recorded ps- and fs-resolved emission anisotropy, r(t). To begin with the ps observation, the decay (see Fig. 10, which is published as supporting information on the PNAS web site) of r(t) at 620 nm starts at 0.25 ± 0.08, and it was fitted by using a single-exponential function having a time constant of 630 (±50) ps. At 620 nm, the emitting structure is the twisted or cis-HYZ form, whereas the absorbing one is the trans-AZO tautomer. Therefore, the 630-ps component is due a rotational time of cis-HYZ inside HSA protein pocket. The long time indicates that the guest is not frozen inside the host. A previous x-ray crystal study of structures of salts composed of amino acids (like those of HSA) and sulfonated AZO dyes (like OII) has shown that short (<3 Å) intermolecular H-bonds between the dye sulfonate groups and neighboring amino acids (48). For OII:HSA complexes, we cannot provide in this work an x-ray structure; however, if such kinds of interactions between the SO–3 group of OII and the amino acids of the protein happen as it does in comparable systems (48), it makes robust the complex avoiding its dissociation. In a previous study, using a smaller molecular probe, we found a very large docking of the guest within the HSA protein (4). For the fs-anisotropy decay (Fig. 6), taking into account the presence of a long-time component in the transient, the fit gives 100 ± 50 fs (66%), 1 ± 0.2 ps (8%), and 600 ± 80 ps (26%). The time of the ultrafast and fast components are comparable with those of the emission transients suggesting that the relative depolarization is related to the relaxation of the formed trans-HYZ tautomer at S1 and twisting motion of cis-HYZ. Such behavior was observed in the anisotropy decay of trans-azobenzene photoisomerization in a nonviscous solvent (49). Note also that the change of the electronic part of the wavefunctions induces a change in the transition dipole moments of both trans- and cis-HYZ forms.
Fig. 6.
fs-anisotropy decays of OII in water containing 20 μM HSA. Excitation and observation wavelengths were 390 and 620 nm. The fit gives 100 ± 50 fs (66%), 1 ± 0.2 ps (8%), and 600 ± 80 ps (26%).
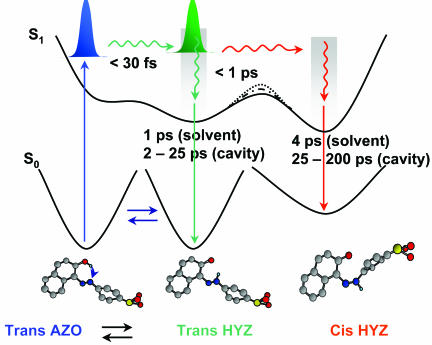
Mechanism of trans-OII Isomerization. Fig. 7 is a schematic illustration for the proton transfer and trans-cis isomerization photoreactions of OII in solution, CDs, and in HSA nanocavities. The photo-induced IPT takes place in AZO to give trans-HYZ in <30 fs (the O–H vibration period is ≈12 fs), putting it in nonequilibrated configurations at the same level of energy of the directly excited trans-HYZ forms. The subsequent dynamics then might be similar. Intramolecular vibrational-energy redistribution (IVR) and inertial solvent response occur in 50–150 fs, a time window that includes the fs-contribution observed here. Furthermore, comparable times have been observed in the dynamics of rotation-free and rotation-restricted AB derivatives when pumped to the S2 state (47). Therefore, we believe that a direct trans-cis photoisomerization of the AZO form in the media used is unfavorable. After an IPT reaction, IVR, and solvent response, the system becomes more flexible because of a loosening of the N N double-bond character and change in bond orders. It is promoted to enter into a region for an electronic relaxation to give the cis-HYZ at S1 or to relax to ground-state structure of trans-HYZ isomer. Most likely, this photoisomerization reaction proceeds by a rotational/twisting mechanism in solution and through an inversion mechanism in CDs and HSA nanocavities, as was suggested to happen in flexible and rigid azobenzene derivatives to explain the observed dynamics (47). Taking into account the ultrafast photoisomerization process, and regardless of the nature of the working mechanism, the barrier to cross to the cis isomer region should be very small. The overlap between the emission spectra of both isomers precludes the observation of a fs-rising component at the red side of emission. In water and THF, nonviscous and noncaging media, the emission lifetime of trans- and cis-HYZ isomers are ≈1 and 4 ps, respectively. In ethylene glycol and triacetin, viscous and noncaging media, these times become slightly longer, 5–7 ps. However, in CDs and HSA, these times are clearly longer, reaching 25–45 and 140–200 ps, respectively. Confined nanostructures with a stronger docking have lower probability to rotation (around N–N and C–N bonds) inside the cavity, and probably the inversion mechanism should be the operative one.
Fig. 7.
A schematic representation of the potential-energy curves at S0 and S1 states of OII in solutions and in CD and HSA nanocavities. The involved structures are shown with the corresponding relaxation time dynamics and (under S1 potential-energy surfaces) emission lifetimes in the used media. The dashed barriers between the wells of trans- and cis-HYZ rotamers at S1 are for CDs and HSA solutions where a small energy barrier should be present because of restriction in isomerization reaction. For clarity, the involved energies and the size of the molecules are not in scale.
The initially excited photoproduced trans-HYZ is found at S1 with ≈4,000 cm–1 as an excess energy due to the ultrafast proton-transfer reaction in trans-AZO. As described above, strong dynamics modes coupling between N–N and C–N stretching modes will happen in trans-HYZ to promote the formation of cis-HYZ isomer. Such coupling was observed to happen in ≈30 fs in the photoisomerization of trans-4-(dimethyl amino)azobenzene using sub-10-fs pulses (50). Other modulation periods of 400 and 500 fs due to lower-frequency motions also were recorded. Because of CD and HSA confinement, the time scale for the C–N and C–C coupling may change when compared with that in free OII; the space restriction makes the twisting/rotation channel less favorable, and, therefore, the trans isomer may take longer time to enter the isomerization region, and thus the phenyl inversion occurs. This kind of delay in reactivity due to nanocavity restriction of nuclear rearrangement has been observed in a molecule showing IPT and twisting motion at S1 (4, 8, 9).
Our mechanism for OII photodynamics in solution and the nanocavities is different from that previously proposed (36). It involves the coexistence of three structures: two tautomers and one rotamer. Because of different degrees and angles of penetration of the guest into the cavity, the confined structures in the cavities have different topologies of the potential-energy surfaces and therefore exhibit a rich dynamics. The ultrafast dynamics of the present systems is reminiscent of that of many biological molecules for which the isomerization routes are mainly governed by conformation distribution of caged guest and for which several mechanisms have been proposed. For example, the observed two decay processes of excited 11-cis-retinal in rhodopsin were suggested because of excitation of two different ground-state rotamers of the retinal chromophor that fit within the binding cavity (44), shown by x-ray crystal structure (38, 39). A few years ago, Kandori et al. (40) proposed a model for the photodynamics of rhodopsin involving two different fluorescent species. The bond selectivity, which depends on the environment (protein vs. solvent) leading to the photoproducts (e.g., 13-cis and 11-cis), was attributed to the shape (topology) of the potential-energy surfaces (at S0 and S1 states) in the vicinity associated with the torsion of the involved double bonds in the isomerization (42).
Supplementary Material
Acknowledgments
This work was supported by the Ministerio de Educación y Ciencia and the Junta de Comunidades de Castilla–La Mancha (Spain) through projects BQU-2001/4972-E, MAT-2002/001829, and PAI-02/004.
Author contributions: A.D. designed research; A.D., M.S., and L.T. performed research and analyzed data; and A.D. wrote the paper and is head of the laboratory.
Conflict of interest statement: No conflicts declared.
This paper was submitted directly (Track II) to the PNAS office.
Abbreviations: OII, orange II, CD, cyclodextrin; HSA, human serum albumin; IPT, intramolecular proton transfer; AZO, azoenol; HYZ, ketohydrazone; fs, femtosecond; ps, picosecond; THF, tetrahydrofuran.
References
- 1.Zewail, A. (2000) J. Phys. Chem. A 104, 5660–5694. [Google Scholar]
- 2.Chachisvilis, M., Garcia-Ochoa, I., Douhal, A. & Zewail, A. H. (1998) Chem. Phys. Lett. 293, 153–159. [Google Scholar]
- 3.Douhal, A., Fiebig, T., Chachisvilis, M. & Zewail, A. H. (1998) J. Phys. Chem. A 102, 1657–1660. [Google Scholar]
- 4.Zhong, D.-P., Douhal, A. & Zewail, A. H. (2000) Proc. Natl. Acad. Sci. USA 97, 14056–14061. [DOI] [PMC free article] [PubMed] [Google Scholar]
- 5.Vajda, S., Jimenez, R., Rosenthal, S.-J., Fidler, V., Fleming, G.-R. & Castner, E.-W., Jr. (1995) J. Chem. Soc. Faraday Trans. 91, 867–873. [Google Scholar]
- 6.Takei, M., Yui, H., Hirose, Y. & Sawada, T. (2001) J. Phys. Chem. A 105, 11395–11399. [Google Scholar]
- 7.Nandi, N., Bhattacharyya, K. & Bagchi, B. (2000) Chem. Rev. 100, 2013–2045. [DOI] [PubMed] [Google Scholar]
- 8.Douhal, A. (2004) Chem. Rev. 104, 1955–1976. [DOI] [PubMed] [Google Scholar]
- 9.Douhal, A. (2004) Acc. Chem. Res. 37, 349–355. [DOI] [PubMed] [Google Scholar]
- 10.Douhal, A., ed. (2005) J. Photochem. Photobiol. A. 173, special issue, 229–398. [Google Scholar]
- 11.Kamal, J. K. A., Zhao, L. & Zewail, A.-H. (2004) Proc. Natl. Acad. Sci. USA 101, 13411–13416. [DOI] [PMC free article] [PubMed] [Google Scholar]
- 12.Zhong, D.-P., Pal, S. K. & Zewail, A. H. (2001) Chemphyschem. 2, 219–227. [DOI] [PubMed] [Google Scholar]
- 13.Flachenecker, G. & Materny, A. (2004) J. Chem. Phys. 120, 5674–5690. [DOI] [PubMed] [Google Scholar]
- 14.Méndez-Paz, D., Omil, F. & Lema, J. M. (2005) Water Res. 39, 771–778. [DOI] [PubMed] [Google Scholar]
- 15.Kelemen, J. (1981) Dyes Pigments 3, 5–26. [Google Scholar]
- 16.Oakes, J. & Gratton, P. (1998) J. Chem. Soc. Perkin Trans. 2 9, 1857–1864. [Google Scholar]
- 17.Antonov, L., Fabian, W. M. F., Nedeltcheva, D. & Kamounah, F. S. (2000) J. Chem. Soc. Perkin Trans. 2 6, 1173–1179. [Google Scholar]
- 18.Fabian, M. F., Antonov, L., Nedeltcheva, D., Kamounah, F. S. & Taylor, P. J. (2004) J. Phys. Chem. A 108, 7603–7612. [Google Scholar]
- 19.Alarcón, S. H., Olivieri, A. C., Sanz, D., Claramunt, R. M. & Elguero, J. (2004) J. Mol. Struct. 705, 1–9. [Google Scholar]
- 20.Abbott, L. C., Batchelor, S. N., Oakes, J., Gilbert, B. C., Whitwood, A. C., Lindsay Smith, J. R. & Moore, J. N. (2005) J. Phys. Chem. A 109, 2894–2905. [DOI] [PubMed] [Google Scholar]
- 21.Gilli, P., Bertolasi, V., Pretto, L., Lyèka, A. & Gilli, G. (2002) J. Am. Chem. Soc. 124, 13554–13567. [DOI] [PubMed] [Google Scholar]
- 22.Gilli, P., Bertolasi, V., Pretto, L., Antonov, L. & Gilli, G. (2005) J. Am. Chem. Soc. 127, 4943–4953. [DOI] [PubMed] [Google Scholar]
- 23.Joshi, H., Kamounah, F. S., Gooijer, C., van der Zwan, G. & Antonov, L. (2002) J. Photochem. Photobiol. A 152, 183–191. [Google Scholar]
- 24.Suzuki, M. & Sasaki, Y. (1979) Chem. Pharm. Bull. 27, 1343–1351. [Google Scholar]
- 25.Suzuki, M., Sasaki, Y. & Sugiura, M. (1979) Chem. Pharm. Bull. 28, 1797–1805. [Google Scholar]
- 26.Suzuki, M., Ohmori, H., Kajtar, M., Szejtli, J. & Vikmon, M.-J. (1994) Inclusion Phenom. 18, 255–264. [Google Scholar]
- 27.Suzuki, M. & Sasaki, Y. (1991) Chem. Pharm. Bull. 29, 585–587. [Google Scholar]
- 28.Suzuki, M. & Sasaki, Y. (1984) Chem. Pharm. Bull. 32, 832–838. [Google Scholar]
- 29.Suzuki, M., Tsutsui, M. & Ohmori, H. (1994) Carbohydr. Res. 261, 223–230. [Google Scholar]
- 30.Haskard, C.-A., May B.-L., Kurucsev T. & Lincoln, S.-F. (1997) J. Chem. Soc. Faraday Trans. 93, 279–282. [Google Scholar]
- 31.Buschmann, H.-J. & Schollmeyer, E.-J. (1997) Inclusion Phenom. Mol. Recognit. Chem. 92, 167–174. [Google Scholar]
- 32.Iijima, T. & Karube, Y. (1998) Dyes Pigments 36, 305–311. [Google Scholar]
- 33.Isaacs, N.-S. & Young, D.-J. (1999) Tetrahed. Lett. 40, 3953–3956. [Google Scholar]
- 34.Zheng, P., Li, Z., Tong, L. & Lu, R. (2002) J. Inclusion Phenom. Macromol. Chem. 43, 183–186. [Google Scholar]
- 35.Guo, Y.-J., Pan, J.-H & Jing, W.-J. (2004) Dyes Pigments 63, 65–70. [Google Scholar]
- 36.Yui, H., Takei, M., Hirose, Y. & Sawada, T. (2003) Rev. Sci. Instrum. 74, 907–909. [Google Scholar]
- 37.Ito, K., Tsuyumoto, I., Harata, A. & Swada, T. (2000) Chem. Phys. Lett. 318, 1–6. [Google Scholar]
- 38.Palczewski, K., Kumasaha, T., Hori, T., Benhke, C. A., Motoshima, H., Fox, B. A., Le Trong, I., Teller, D. C., Okada, T., Stemkamp, R. E., et al. (2000) Science 289, 739–745. [DOI] [PubMed] [Google Scholar]
- 39.Fujimoto, Y., Fishkin, N., Pescitelli, G. & Decatur, J., Berova, N. & Nakanishi, K. (2002) J. Am. Chem. Soc. 124, 7294–7302. [DOI] [PubMed] [Google Scholar]
- 40.Kandori, H., Furutani, Y., Nishimura, S., Shichida, Y., Chosrowjan, H., Shibata, Y. & Mataga, N. (2001) Chem. Phys. Lett. 334, 271–276. [Google Scholar]
- 41.Logunov, S. L., Volkov, V. V., Braun, M. & El-Sayed, M. A. (2001) Proc. Natl. Acad. Sci. USA 98, 8475–8479. [DOI] [PMC free article] [PubMed] [Google Scholar]
- 42.Ben-Nun, M., Molnar, F., Schulten, K. & Martínez, T. J. (2002) Proc. Natl. Acad. Sci. USA 99, 1769–1773. [DOI] [PMC free article] [PubMed] [Google Scholar]
- 43.Andruniów, T., Ferré, N. & Olivucci, M. (2004) Proc. Natl. Acad. Sci. USA 101, 17908–17913. [DOI] [PMC free article] [PubMed] [Google Scholar]
- 44.Liu, R. S. H., Hammond, G. S. & Mirzadegan, T. (2005) Proc. Natl. Acad. Sci. USA 102, 10783–10787. [DOI] [PMC free article] [PubMed] [Google Scholar]
- 45.Organero, J.-A., Tormo, L. & Douhal, A. (2002) Chem. Phys. Lett. 363, 409–414. [Google Scholar]
- 46.Douhal, A., Sanz, M., Carranza, M.-A., Organero, J.-A. & Santos, L. (2004) Chem. Phys. Lett. 394, 54–60. [Google Scholar]
- 47.Lu, Y.-C., Diau, E.-W.-G. & Rau, H. (2005) J. Phys. Chem. A 109, 2090–2099. [DOI] [PubMed] [Google Scholar]
- 48.Ojala, W. H., Sudbeck, E. A., Lu, L. K., Richardson, T. I., Lovrien, R. E. & Gleason, W. B. (1996) J. Am. Chem. Soc. 118, 2131–2142. [Google Scholar]
- 49.Chang, C.-W., Lu, Y.-C., Wang, T.-T. & Diau, E.-W.-G. (2004) J. Am. Chem. Soc. 126, 10109–10118. [DOI] [PubMed] [Google Scholar]
- 50.Saito, T. & Kobayashi, T. (2002) J. Phys. Chem. A 106, 9436–9441. [Google Scholar]
Associated Data
This section collects any data citations, data availability statements, or supplementary materials included in this article.


