Abstract
Biological molecular assemblies are excellent models for the development of nanoengineered systems with desirable biomedical properties. Here we report an approach for fabrication of spontaneous, biologically active molecular networks consisting of bacteriophage (phage) directly assembled with gold (Au) nanoparticles (termed Au–phage). We show that when the phage are engineered so that each phage particle displays a peptide, such networks preserve the cell surface receptor binding and internalization attributes of the displayed peptide. The spontaneous organization of these targeted networks can be manipulated further by incorporation of imidazole (Au–phage–imid), which induces changes in fractal structure and near-infrared optical properties. The networks can be used as labels for enhanced fluorescence and dark-field microscopy, surface-enhanced Raman scattering detection, and near-infrared photon-to-heat conversion. Together, the physical and biological features within these targeted networks offer convenient multifunctional integration within a single entity with potential for nanotechnology-based biomedical applications.
Keywords: target, fractal, hydrogel, stem cell, assembly
In nature, the assembly of molecules and particles is often directed by hydrophobic, van der Walls, and/or electrostatic interactions (1, 2). Biological systems in particular are driven toward energetically favorable structures that have molecular selectivity and recognition and thus serve as models for nanoscale engineering-based molecular assembly. Given that filamentous bacteriophage (phage) (3–6) are resistant to harsh conditions such as high salt concentration, acidic pH, chaotropic agents, and prolonged storage (6), they are suitable candidate building blocks to meet the challenges of bottom-up nanofabrication (1, 2). Moreover, the pIII minor capsid protein of the phage can be easily engineered genetically to display ligand peptides that will bind to and modify the behavior of target cells in selected tissues (3, 4, 6–8). Thus, the tactic of integrating phage display technology with tailored nanoparticle assembly processes offers opportunities for reaching specific nanoengineering and biomedical goals (1–4, 6, 8–10).
In this work, we show that such networks are biocompatible and preserve the cell-targeting and internalization attributes mediated by a displayed peptide and that spontaneous organization (without genetic manipulation of the pVIII major capsid protein), and optical properties can be manipulated by changing assembly conditions. By taking advantage of gold (Au) optical properties (11–16), we generated Au–phage networks that, in addition to targeting cells, can function as signal reporters for fluorescence and dark-field microscopy and near-infrared (NIR) surface-enhanced Raman scattering (SERS) spectroscopy. Notably, this strategy maintains the low-cost, high-yield production of complex polymer units (phage) in host bacteria and bypasses many of the challenges in developing cell/peptide detection tools, such as complex synthesis and coupling chemistry, poor solubility of peptides, the presence of organic solvents, and weak detection signals. We also show that, despite the evident structural contrast between the Au–phage fractal networks and the usual geometrically symmetrical nanostructures (17, 18), these networks can effectively integrate the unique signal reporting properties of Au nanoparticles while preserving the biological properties of phage.
Results and Discussion
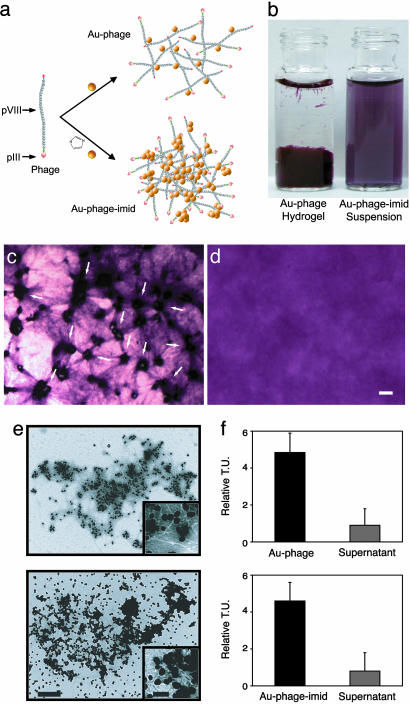
Design, Synthesis, and Characterization of Au–Phage Networks. We hypothesized that spontaneous assembly of Au nanoparticles onto phage occurs without genetic modification of the pVIII major capsid proteins or complex conjugation chemistry (Fig. 1a). To test that hypothesis, we generated biologically active networks of directly assembled Au–phage complexes by optimizing the phage concentration required to convert Au colloidal solutions into hydrogels, which is the precursor for generating network suspension (Fig. 1b). We first tested the biocompatibility and cytotoxicity of these networks by showing that C17.2 murine neural stem cells widely infiltrate the Au–phage hydrogel network structure indicated by the stretched Au–phage fibers (Fig. 1 c and d) and continue to proliferate (data not shown). Next, we found that the surface plasmon absorption wavelengths of the Au–phage complexes can be modulated by changes in phage input and the presence of imidazole (imid). TEM, elastic light scattering, visible/NIR absorption and NIR SERS confirmed Au–phage assembly. Data on these findings are presented in the following paragraphs.
Fig. 1.
Concept and biological/structural characterization of Au–phage and Au–phage–imid networks. (a) Strategy for Au assembly onto phage nanoparticles. Imid and the yellow spheres [Au nanoparticles (not drawn to scale); the Au particles have a diameter of 44 ± 9 nm, and the pVIII capsid peptide has a thickness of ≈6 nm]. (b) Vials of nanoparticle solutions: Au–phage hydrogel (Left) and suspension of purified Au–phage–imid (Right; suspended from hydrogels precursor). (c and d) Hydrogel formed with RGD-4C-displaying phage. (Scale bar, 20 μm.) (c) C17.2 murine neural stem cells cultured within hydrogel for 24 h. Cell accumulation followed by cell-induced network displacement is shown (arrows point to cells within the network). (d) Control hydrogel (no cells). (e) TEM of purified networks: Au–phage (Upper) and Au–phage–imid (Lower). (Scale bar, 500 nm; inset scale bar, 100 nm.) (f) Bacterial infection with purified Au–phage (Upper) and Au–phage–imid (Lower) networks; TU are shown for purified and functional Au–phage and Au–phage–imid solution and for unbound phage present in the supernatant from centrifuged network solutions.
We used two strategies to generate biologically active networks: with or without the metal-binding molecule imid (Fig. 1a) (11, 19). The different assemblies yielded distinct network organizations, as revealed by transmission electron microscopy (TEM) (Fig. 1e). Au nanoparticles appear as black dots connecting long, white, filamentous phage structures. Once assembled, the phage in these networks still maintained their ability to infect bacteria (Fig. 1f) and showed distinctive physical characteristics such as fractal structure and NIR optical properties. Because fractal patterns are often observed in naturally occurring assembly processes (19, 20), we evaluated whether the spontaneously assembled structures would show fractal traits and whether this feature could distinguish the structural differences between the networks. The fractal dimension (Df) analysis of the two-dimensional TEM images (Au–phage, 1.32 ± 0.12; Au–phage–imid, 1.78 ± 0.14; t test, P < 0.0001) correlated with the apparent aggregation of Au nanoparticles within each network. The lower Df for Au–phage indicated looser, more dispersed structures observed by TEM (Fig. 1e Upper); in comparison, the higher Df for the Au–phage–imid reflected the denser networks as a result of imidazole-induced aggregation (Au–imid) of Au nanoparticles (Fig. 1e Lower). Consistently, angle-dependent elastic light-scattering Df analysis (based on Rayleigh–Debye–Gans scattering theory) (21, 22) revealed the same Df trend for the networks in solution (data not shown) as that obtained from the TEM image analysis. The characteristic high-surface area of fractal networks (23) can improve accessibility to binding sites, which is a central feature for fabricating cell-targeting systems.
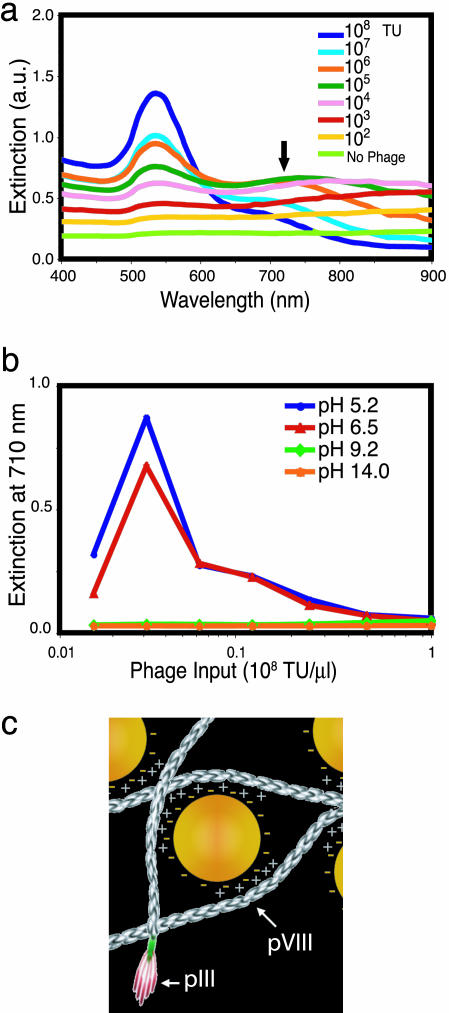
Next, we evaluated network formation by monitoring the shift in surface plasmon absorption into the NIR spectral region when phage concentration was increased [Fig. 2 a (spectra red shift indicated with an arrow) and b]. The red shift, which generally occurs when the distance between Au nanoparticles (dAu) is less than the average particle diameter (2rAu; dAu < 2rAu), is usually a good diagnostic for Au–Au interactions because of particle agglomeration (14–16).
Fig. 2.
Mechanism of assembly for Au–phage networks. (a) Light-absorption spectrum at various phage input (indicated in the legend) in the presence of 0.25 M NaCl (no phage, bottom curve). (b) Light extinction at 710 nm for Au–phage solutions as a function of phage input at various pH levels (10 mM boric acid, pH 5.2; 10 mM sodium borate buffer, pH 6.5; 10 mM sodium borate, pH 9.2; or 10 mM NaOH, pH 14.0). (c) Cartoon illustrating electrostatic interaction of Au (yellow spheres) with phage [elongated structures (not drawn to scale)]. Arrows point to pVIII major capsid protein and pIII minor capsid protein.
It is our hypothesis that the native pVIII major capsid proteins function as the binding sites for the Au–phage network assembly (Fig. 1a). Given the absence of typical metal-binding amino acid residues (such as Cys and His) on the pVIII protein, the direct assembly of Au nanoparticles onto phage should be largely directed by electrostatic interactions (14–16, 24–29). It is well known that Au nanoparticles can be made to agglomerate by varying solution ionic conditions (specifically, agglomeration shows a dependence on ionic strength). In solution, Au nanoparticles are coated with a layer of adsorbed citrate anions (citrate from Au nanoparticle synthesis procedure) (14–16, 30). Attraction between like-charged particles can occur because of correlated fluctuations in the surrounding ion clouds. Thus, the presence of ions can be used to mediate the agglomeration. For example, Au nanoparticles agglomerate in the presence of salt as indicated by a broadening and shift to longer wavelength in the surface plasmon absorption peak (Fig. 2a, no phage, green spectrum). It has been reported that phage particles (both fd and M13) also act as polyanionic particles in solution with several negative surface charges associated with each of the ≈2,700 copies of the major capsid protein (fd is more anionic than M13 because of the replacement of Asn-12 with Asp-12) (26–29). In addition, bundles of phage form from like-charge attraction (26–29), and analogous to the mediation of Au nanoparticle agglomeration, solubilization of such bundles depends on solution ionic strength. We found that Au agglomeration induced by 0.25 M NaCl (Fig. 2a, no phage, green spectrum) could be minimized by Au–phage interactions (indicated by the small red shift) when phage input increased, which suggests a similar physical interpretation for binding in the mixed phage/Au systems as that found in the Au–Au and phage–phage binding. These findings indicate a greater stability of the Au–phage networks in the presence of salt.
To explore further the role of electrostatics in the assembly mechanism, we monitored network formation at a series of solution pH levels (Fig. 2b). Under all tested conditions, phage have an overall negative charge, but we observed formation of the Au–phage networks only at a pH level well below the calculated pI (9.4) of the individual pVIII proteins (31). For solutions in which networks did form (as indicated by the extinction at 710 nm attributable to Au aggregation), lower pH levels led to increased extinction. These results imply that the pVIII positive charge at pH≤7 mediates the mechanism of assembly through opposite-charge interaction (Fig. 2c) between the citrate-adsorbed Au nanoparticles and the thin and long phage surface (6 × 1,000 nm) (26–29). Finally, the data in Fig. 2b show that at a low phage input level, the aggregation falls off because of titration of phage-binding sites in the solution.
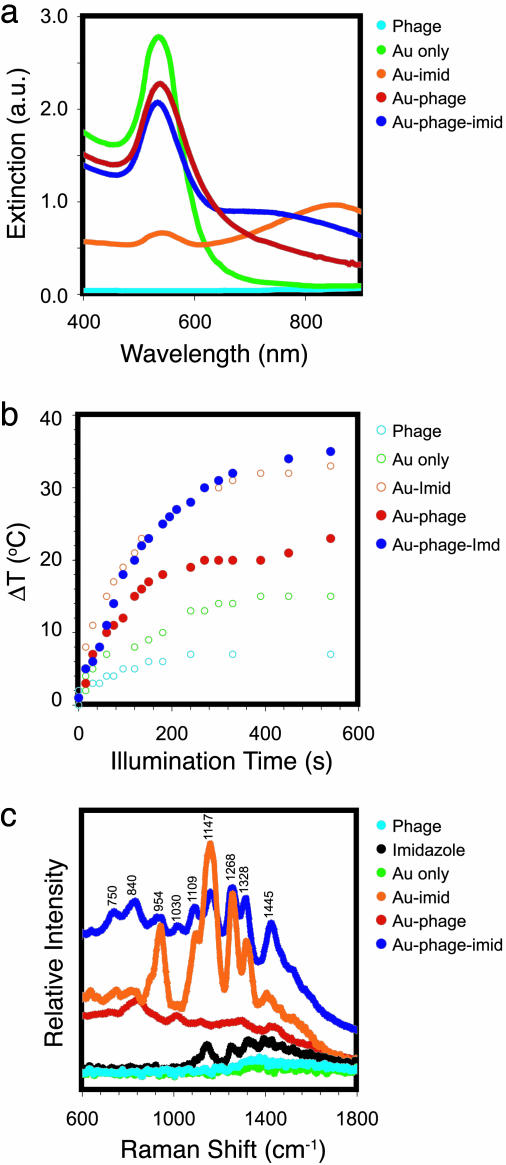
Next, we compared the optical properties of the purified Au–phage and Au–phage–imid network solutions. The more compact Au–phage–imid complexes had a relatively larger red shift in the extinction spectrum with increased absorptivity in the NIR wavelength region (700–900 nm; Fig. 3a) (16, 32). To support the assertion that NIR photons were also being absorbed instead of only scattered by the larger agglomerates, we measured the temperature change for the two network solutions as a direct function of illumination time by using NIR incident laser light (785 nm; Fig. 3b). There was a substantial temperature change for both the Au–phage and Au–phage–imid networks from the efficient photon-to-heat conversion, which demonstrates that the NIR photons are being absorbed as a result of the surface plasmon absorption red shift.
Fig. 3.
Optical and physical characterization of Au–phage networks. (a) Light-absorption spectrum of purified and suspended Au–phage–imid (dark blue) and Au–phage (red). (b) Temperature as a function of illumination (785-nm laser light) time of Au–phage–imid (blue) and Au–phage (red) solutions; the controls (○) are the solutions of Au (green), Au–imid (orange), and phage (cyan). The concentrations of all solutions carrying Au were normalized according to the area under the absorption region of the spectra (>475 nm). The solution temperature was measured with a digital temperature probe (Teflon-coated cables of type-K beaded sensor coupled to a Fisher traceable double thermometer with computer output from Fisher Scientific) immersed in 300 μl of solution and 5 mm away from the laser focal point. (c) SERS of Au–phage–imid (blue) and Au–phage (red) measured in water.
Finally, we used NIR SERS spectroscopy to characterize the interactions among Au, phage, and imid (Fig. 3c and Table 1). Differences between the spectra of Au–phage and Au–phage–imid seem to arise from the distinct chemical environments in the vicinity of the Au nanoparticles. Signature bands for phage and Au interaction emerged by identifying common attributes when comparing NIR SERS spectra intrinsic with each of the networks (33, 34) and controls. First, from an analysis of control experiments without phage (Au–imid, Fig. 3c, orange curve), the 1,030-cm–1 band is a SERS feature that is detected only in the networks spectra (33–35) and could be assigned to Tyr, Phe, and/or Met (pVIII major capsid protein). Second, the mode at 1,445 cm–1 is likely attributed to Trp and/or Met (33–35). A third peak was seen only in the Au–phage spectrum (the broad and low intensity peak centered at 840 cm–1), which has been assigned to Tyr residues present within the pVIII (33, 34). Several other peaks (750, 840, 954, 1,109, 1,169, and 1,268 cm–1) present in the Au–phage–imid spectrum have been observed in systems in which imidazole is adsorbed onto Au (36) or silver (37) electrodes. Additional peaks in the Au–phage spectrum might be attributable to exposed residues on the major capsid. For example, strong SERS signals near 1,147 and 1,301 cm–1 have been observed in systems of both Lys and Met with Au nanoparticles (the last three amino acids of the exposed N-terminal end of the pVIII capsid are Lys-Lys-Met) (35).
Table 1.
Assignment of Raman bands and amino acids in the SERS spectra shown in Fig. 3c
| Au—phage, cm-1 | Au—phage—imid, cm-1 | Au—imid, cm-1 | Imid, cm-1 | Side chain or imid designation | Vibrational assignment* | Ref(s). |
|---|---|---|---|---|---|---|
| 670 | 650 | Imid | γring (628 cm-1, Raman) | 36 and 37 | ||
| 750 | 764 | Imid | γring (743 cm-1, SERS) | 36 | ||
| 840 | 838 | Imid | γring (832 cm-1, SERS) | 37 | ||
| 854 | Tyr, Ile, and/or Met | γring (853 cm-1, Raman), γ(CC) (874 cm-1, Raman and SERS) | 34 and 35 | |||
| 954 | 954 | 931 | Imid | γ(NH) + δring (950 cm-1, SERS) | 36 and 37 | |
| 1,030 | 1,030 | Tyr, Phe, and/or Met | γ(CH) (1,033 cm-1, SERS), ν(CC, CN, CO) (1,031 cm-1, Raman) | 33 | ||
| 1,109 | 1,109 | Imid | δ(CH) + νring (1,097 cm-1, SERS) | 36 and 37 | ||
| 1,147 | Met and Lys | ν(CC) (1,158 cm-1, Raman) | 33 | |||
| 1,169 | 1,169 | 1,160 | Imid | δring (1,164 cm-1, SERS) | 36 and 37 | |
| 1,268 | 1,268 | 1,263 | Imid | δ(CH) (1,265 cm-1, SERS) | 36 and 37 | |
| 1,301 | Amide III, Tyr, Ala, Lys, Ile, Val, Ser, Gly, Trp, and pVIII main chain | δ(CH) and ν(CC) (1,300 cm-1, Raman) | 33-35 | |||
| 1,328 | 1,328 | Imid | νring (1,329 cm-1, SERS) | 36 and 37 | ||
| 1,445 | 1,436 | 1,415 | 1,436 | Trp and Imid | νring (1,449 cm-1, Raman) | 36 and 37 |
δ, in-plane bending; γ, out-of-plane bending; ν, stretching.
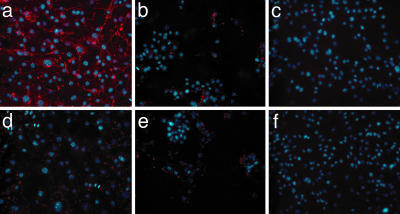
Targeted and Fluorescence-Enhanced Cell Detection. To evaluate whether Au–phage-based networks could be efficiently used to study peptide ligand binding to receptors on the cell surface as well as receptor-mediated properties such as phage internalization, we performed immunofluorescence-staining assays with antibodies directed to the phage capsid. Melanoma cells were chosen because they express high levels of αv integrins (38), the cell surface receptor for a well characterized phage displaying the peptide CDCRGDCFC (termed RGD-4C) (39). Here we show that the targeting and receptor-mediated internalization capabilities of the RGD-4C peptide remained intact within the Au–RGD-4C networks (Fig. 4a). Accordingly, internalization was inhibited (40) in a dose-dependent manner when cells were preincubated with the RGD-4C synthetic peptide before incubation with Au–RGD-4C networks (Fig. 4b). The likely synergy between the receptor-mediated phage internalization and electromagnetically induced surface enhancement of the Au nanoparticles (41) resulted in an increase in the enhanced fluorescence for the targeted Au–RGD-4C networks (Fig. 4a) relative to those observed for the RGD-4C phage alone (Fig. 4c). Negative controls show only background signal (Fig. 4 d–f).
Fig. 4.
Immunofluorescence-based phage binding and internalization assay with cultured melanoma cells. The red color represents fluorescence related to the RGD-4C peptide, and the blue color shows fluorescence of DAPI-stained cell nuclei. Cells were incubated with different phage preparations, all carrying a phage input of 1.0 × 10⁷ TU. (a) Au–RGD-4C-displaying phage. (b) Cells preincubated with the RGD-4C synthetic peptide (1.0 × 10⁻³ nM for 30 min) followed by addition of Au–RGD-4C. (c) RGD-4C phage (no Au). (d) Au–fd-tet (negative control). (e) Cells preincubated with the RGD-4C synthetic peptide (1.0 × 10⁻³ nM) followed by addition of Au–fd-tet (negative control). (f) fd-tet phage (negative control).
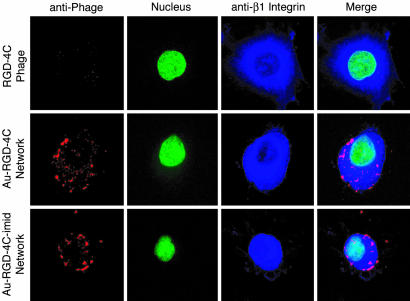
Confocal Fluorescence Image Analysis. We reasoned that, when examined by confocal microscopy, Au–phage networks could serve as sensitive reporters to localize and evaluate ligand binding and receptor-mediated internalization events (Fig. 5). It seems that differences in the structure of the targeting networks result in distinct kinetics of the internalization event that follows ligand–receptor binding. By incorporating imid into the nanoarchitecture of the networks, we were able to influence the localization of the Au–phage networks to either the cell surface or cytoplasm. More compact networks with a higher Df (Au–RGD-4C-imid) preferentially localized at the cell surface, whereas those with a lower Df (Au–RGD-4C) were internalized (Fig. 5). Dynamic examination of confocal image stacks from different cell planes is consistent with this interpretation (data not shown). These results lead us to hypothesize the existence of an aggregate morphology dependence (as measured by Df) for receptor-mediated internalization, in which network changes from more to less compact structures might favor cell internalization over surface binding. These findings suggest that the control of network morphology through titration with a nanoparticle complexing agent such as imid may be used to modulate their ligand-directed cell-targeting ability to match a desired application.
Fig. 5.
Confocal fluorescence. Shown are KS1767 cells incubated with phage preparations (input of 1.0 × 10⁷ TU) and labeled with anti-fd bacteriophage antibody (red, first column), SYTOX green nucleic acid stain (green, second column), and an anti-β1 integrin antibody demarking the cell surface (blue, third column). The fourth column shows merged images: RGD-4C phage, Au–RGD-4C networks, and Au–RGD-4C-imid networks (controls for each of the respective RGD-4C phage preparations are shown in Fig. 8, which is published as supporting information on the PNAS web site). (Scale bar, 10 μm.)
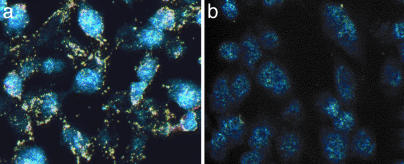
Elastic Light Scattering and SERS Detection of Cells with Targeted Networks. To extend the light-scattering attributes of the networks into analytical applications, we used dark-field microscopy to generate a single-step, fast, sensitive imaging system that does not require staining (Fig. 6). Dark-field microscopy detects scattered light, and the large scattering cross section of the Au nanoparticles (11–13) makes them ideal contrast agents. The Au–RGD-4C-targeted networks (Fig. 6a) when compared with RGD-4C phage without Au (data not shown) or networks formed by untargeted nanoparticles (Fig. 6b) showed markedly increased signal.
Fig. 6.
Dark-field images (real color) of cell-bound Au–phage networks using light from a microscope mercury lamp. Confluent KS1767 cells incubated with phage preparations (input of 1.0 × 10⁷ TU): Au–RGD-4C (gold color) (a) and Au–fd-tet (control insertless phage) networks (b). The blue color shows residual fluorescence from DAPI-stained cell nuclei.
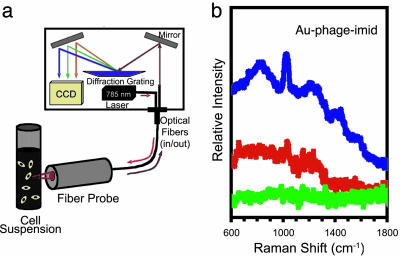
We next evaluated the potential of Au–phage–imid networks as cell nanosensors by integrating their unique Raman spectrum to their biological activity (Fig. 7). We measured the SERS spectra of suspended cells incubated with Au–phage–imid by using a fiber-optic probe to deliver 785-nm laser light and to collect the Raman signal into a spectrometer (Fig. 7a). We obtained the NIR-SERS spectra of mammalian cells incubated with Au–phage–imid networks (Fig. 7b). The high signal intensity (blue spectrum, Au–RGD-4C–imid) directly correlated with the level of cell binding and internalization by the networks carrying phage directed at αv integrin receptors on the surface of target cells. Cells treated with RGD-4C phage alone could not be differentiated from untreated cells. The sensitive detection and distinct SERS spectra for the cells treated with Au–phage–imid showed that phage, Au nanoparticles, and imid (or imid-like molecules) can be combined to form distinct Raman signal signatures as reporters for receptor-mediated targeting in cells or tissues. Peak-intensity differences in SERS spectra between the cell-free (Fig. 3c) and bound Au–RGD-4C–imid (Fig. 7b) are likely the result of cell binding and internalization events.
Fig. 7.
Targeted cell detection by using SERS. (a) Cell-suspension scheme for SERS detection. Light from a laser diode (785 nm) was delivered through a fiber-optic probe to a suspension of KS1767 cells; the same fiber-optic probe collected and delivered the Raman signal. (b) SERS and spectra of cells incubated with Au–phage: Au–RGD-4C-imid (blue line), Au–fd-tet-imid (red line), and RGD-4C phage (green line; control, no Au) in suspension.
Because of the very high chemical selectivity and sensitivity of NIR SERS spectroscopy (42), the Raman labeling strategy described here can provide SERS-based labels for high-throughput molecular and biological detection schemes.
Materials and Methods
Au–Phage Synthesis and Quantitation. Insertless phage (fd-tet) and phage displaying the targeting peptide RGD-4C on the surface of its pIII protein were amplified in host bacteria and purified (6). The 44±9-nm Au nanoparticle solution, verified by TEM image analysis, was prepared following the common citrate-reduction (30) procedure [mass ratio of 0.8 sodium citrate: 1 Au(III) chloride]. Au(III) chloride (≥99.99%) was purchased from Sigma-Aldrich. Assembly of Au–phage complexes began with eight serial dilutions of 107 transducing units (TU) of phage in 200 μl of nanopure water (>18.0 MΩ). An equal volume of Au solution (200 μl), first normalized to 4.2 a.u. (extinction measured at 530 nm), was added to each dilution without mixing and allowed to stand for 12 h at room temperature (here, hydrogel formation takes place). Preparations then were mixed together in sequential order beginning with the least concentrated. Au–phage–imid networks were produced by mixing equal volumes of 109 TU/μl of phage and 1.0 M imid, followed by the addition of an equal volume of Au solution (4.2 a.u., extinction measured at 530 nm). Finally, the networks were purified by three consecutive centrifugation cycles (20,800 × g, relative centrifugal force for 30 min) in glass sterile tubes (Becton Dickinson). Extinction of the Au–phage was measured at 530 nm and adjusted to between 1.2 and 1.5 a.u. by either diluting with water or concentrating by centrifugation. The fd-tet phage was used as a negative control to evaluate background under all of the experimental conditions. Standard bacterial infection was used to determine phage titers as described in ref. 19.
Hydrogel Biocompatibility and Cytotoxicity. Assembly of Au–phage hydrogel was achieved by adding 150 μl of Au nanoparticles (1.2 a.u for extinction at 530 nm) to 150 μl of aqueous solution of RGD-4C-displaying phage (0.14 a.u. for extinction at 270 nm) under sterile conditions in a 96-microwell plate. Hydrogels were allowed to form overnight at 4°C. After hydrogel formation, solution was exchanged by removing the supernatant, while avoiding disturbing the hydrogel structure, and then adding an equal volume of medium (10% FCS in DMEM high glucose with sodium pyruvate/2 mM glutamine/penicillin and streptomycin). C17.2 murine neural stem cells (1.0 × 10⁴ cells per well) (43) were added and allowed to grow for several days at 37°C. Photomicrographs were taken 12 h after cell addition.
TEM Imaging. Nickel mesh grids previously coated with Formvar and evaporated with carbon were floated on drops of 0.1% poly-l-lysine (Sigma Diagnostics) on parafilm for 5 min. Excess solution was removed from the grid by carefully touching the edge of the grid onto filter paper. The grids were not allowed to dry completely in any of the following steps. The grids were floated on drops of sample on parafilm for 1 h. Excess fluid was removed as described above, and the grids then were floated on drops of 1% ammonium molybdate in 0.02% BSA in distilled water (pH 7.0) for 60 sec. Excess fluid was removed, and the grids were allowed to dry overnight. TEM images were captured by a transmission electron microscope (JEM-1010, JEOL) fitted with an AMT Advantage (Deben UK Limited, Suffolk, U.K.) digital charge-coupled device camera system. Au nanoparticle size (44 ± 9 nm) was determined by averaging particle sizes within representative TEM fields. Df analysis of the two-dimensional TEM images was performed with the box-counting method (imagej 1.33 software). Df measurements were averaged from 10 separate TEM images of three different samples.
Cell-Targeting and Peptide-Inhibition Assay. B-16 malignant melanoma cells were seeded on 16-chamber culture slides (BD Falcon, Bedford, MA) at a density of 5 × 10⁴ cells per well and grown overnight at 37°C in RPMI (GIBCO/BRL) containing 10% FBS, antibiotics, and 1% l-glutamine. The next day, each well was blocked with RPMI 30% FBS for 1 h at 37°C and incubated with different concentrations of RGD-4C synthetic peptide (from 10–3 to 10–10 nM) for 30 min. Suspended and purified Au–phage (107 TU) solutions then were added to the wells. After 12 h, fluorescence phage staining was performed as described in Fluorescence Imaging.
Fluorescence Imaging. After the cell-targeting assay, cells were washed and fixed with PBS containing 4% paraformaldehyde. The cells then were permeabilized with 0.2% Triton X-100, washed, and blocked with PBS containing 1% BSA, and the cells were incubated with rabbit anti-fd bacteriophage antibody (Sigma) for 2 h at room temperature followed by a 1-h incubation with Cy3-labeled anti-rabbit IgG antibody (Jackson ImmunoResearch). Finally, cells again were fixed with PBS containing 4% paraformaldehyde and mounted in the presence of DAPI (nuclear staining dye, Vectashield, Vector Laboratories). Images were acquired with an Olympus fluorescence microscope equipped with an Hg lamp and a band-pass excitation filter (530–555 nm) in the fluorescence excitation path and a long-pass dichroic filter (570 nm) and long-pass filter (590 nm) in the emission path.
Confocal Fluorescence Imaging. After the cell-targeting assay, cells were incubated with rabbit anti-fd bacteriophage antibody and mouse anti-β1 integrin antibody in PBS/1% BSA for 2 h at room temperature followed by a 1-h incubation with Cy3-labeled anti-rabbit IgG antibody and Cy5-labeled anti-mouse IgG antibody diluted in PBS containing 1% BSA (Jackson ImmunoResearch). SYTOX green nucleic acid stain (Molecular Probes) was then incubated with the cells for 10 min. Confocal images were acquired with a Zeiss LSM510 laser scanning confocal microscope by using krypton-argon and helium-neon lasers. Image analysis and stack projections were created with the Zeiss lsm 3.2 software package.
Dark-Field Imaging. Dark-field images were acquired before the permeabilization step and antibody incubations described in the cell-targeting assay procedure with an Olympus fluorescence microscope equipped with a dark-field condenser.
SERS Detection of Cells. KS1767 cells (2 × 10⁵) were incubated in 1.0 ml of Eagle's minimal essential medium (MEM) containing 2% FBS with phage (109 TU) or Au–phage–imid (106 TU) for 18 h at 37°C. Negative controls included cells alone and fd-tet phage, Au–fd-tet, Au–fd-tet–imid, and Au only. Each tube was washed with a glycine buffer (50 mM glycine/150 mM NaCl, pH 2.8) followed by several PBS washes. Cells then were counted and normalized to the lowest cell count. SERS measurements of suspended cells were gathered by using an R2001 Raman spectrometer (Ocean Optics, Dunedin, FL) equipped with a fiber-optic probe to deliver 785-nm laser light and to collect the Raman-scattered light.
Supplementary Material
Acknowledgments
We thank Dr. Corazon D. Bucana and Kenneth Dunner, Jr. for assistance with confocal and electron microscopy. This work was supported by awards from the Gillson–Longenbaugh Foundation, the Department of Defense, and the National Institutes of Health (to R.P. and W.A.).
Author contributions: G.R.S., D.R.C., F.I.S., M.G.O., R.L.S., J.H.M., W.A., and R.P. designed research; G.R.S., D.R.C., F.I.S., and M.G.O. performed research; E.Y.S., R.L.S., J.H.M., W.A., and R.P. contributed new reagents/analytic tools; G.R.S., D.R.C., F.I.S., M.G.O., J.H.M., W.A., and R.P. analyzed data; and G.R.S., D.R.C., F.I.S., M.G.O., R.L.S., J.H.M., W.A., and R.P. wrote the paper.
Conflict of interest statement: No conflicts declared.
Abbreviations: imid, imidazole; NIR, near infrared; SERS, surface-enhanced Raman scattering; TEM, transmission electron microscopy; TU, transducing units; Df, fractal dimension.
References
- 1.Dutta, J. & Hofmann, H. (2003) in Encyclopedia of Nanoscience and Nanotechnology, ed. Nalwa, H. S. (American Scientific Publishers, Stevenson Ranch, CA), Vol. 10, pp. 1–23. [Google Scholar]
- 2.Leite, E. R. (2004) in Encyclopedia of Nanoscience and Nanotechnology, ed. Nalwa, H. S. (American Scientific Publishers, Stevenson Ranch, CA), Vol. 6, pp. 537–554. [Google Scholar]
- 3.Giordano, R. J., Cardo-Vila, M., Lahdenranta, J., Pasqualini, R. & Arap, W. (2001) Nat. Med. 7, 1249–1253. [DOI] [PubMed] [Google Scholar]
- 4.Trepel, M., Arap, W. & Pasqualini, R. (2002) Curr. Opin. Chem. Biol. 6, 399–404. [DOI] [PubMed] [Google Scholar]
- 5.Pasqualini, R. & Arap, W. (2002) in Encyclopedia of Cancer, ed. Bertino, J. R. (Academic, San Diego), Vol. 4, pp. 501–507. [Google Scholar]
- 6.Barbas, C. F., III, Burton, D. R., Scott, J. K. & Silverman, G. J. (2001) Phage Display, A Laboratory Manual (Cold Spring Harbor Lab. Press, Woodbury, NY).
- 7.Kolonin, M. G., Saha, P. K., Chan, L., Pasqualini, R. & Arap, W. (2004) Nat. Med. 10, 625–632. [DOI] [PubMed] [Google Scholar]
- 8.Arap, W., Kolonin, M. G., Trepel, M., Lahdenranta, J., Cardó-Vila, M., Giordano, R. J., Mintz, P. J., Ardelt, P. U., Yao, V. J., Vidal, C. I., et al. (2002) Nat. Med. 8, 121–127. [DOI] [PubMed] [Google Scholar]
- 9.Langer, R. & Tirrell, D. A. (2004) Nature 428, 487–492. [DOI] [PubMed] [Google Scholar]
- 10.LaVan, D. A., Lynn, D. M. & Langer, R. (2002) Nat. Rev. Drug. Discov. 1, 77–84. [DOI] [PubMed] [Google Scholar]
- 11.Souza, G. R. & Miller, J. H. (2001) J. Am. Chem. Soc. 123, 6734–6735. [DOI] [PubMed] [Google Scholar]
- 12.Yguerabide, J. & Yguerabide, E. E. (1998) Anal. Biochem. 262, 137–156. [DOI] [PubMed] [Google Scholar]
- 13.Yguerabide, J. & Yguerabide, E. E. (1998) Anal. Biochem. 262, 157–176. [DOI] [PubMed] [Google Scholar]
- 14.Mirkin, C. A., Letsinger, R. L., Mucic, R. C. & Storhoff, J. J. (1996) Nature 382, 607–609. [DOI] [PubMed] [Google Scholar]
- 15.Shipway, A. N., Lahav, M., Gabai, R. & Willner, I. (2000) Langmuir 16, 8789–8795. [Google Scholar]
- 16.Weisbecker, C. S., Merritt, M. V. & Whitesides, G. M. (1996) Langmuir 12, 3763–3772. [Google Scholar]
- 17.Bai, J., Virovets Alexander, V. & Scheer, M. (2003) Science 300, 781–783. [DOI] [PubMed] [Google Scholar]
- 18.Pham, T., Jackson, J., Halas, N. & Lee, T. R. (2002) Langmuir 18, 4915–4920. [Google Scholar]
- 19.Dewey, T. G. (1997) Fractals in Molecular Biophysics (Oxford Univ. Press, New York).
- 20.Mandelbrot, B. B. (1982) The Fractal Geometry of Nature (Freeman, San Francisco).
- 21.Avnir, D., Farin, D. & Pfeifer, P. (1984) Nature 308, 261–263. [Google Scholar]
- 22.Farias, T. L., Koylu, U. O. & Carvalho, M. G. (1996) Appl. Opt. 35, 6560–6567. [DOI] [PubMed] [Google Scholar]
- 23.West, G. B., Brown, J. H. & Enquist, B. J. (1999) Science 284, 1677–1679. [DOI] [PubMed] [Google Scholar]
- 24.Reches, M. & Gazit, E. (2003) Science 300, 625–627. [DOI] [PubMed] [Google Scholar]
- 25.Dujardin, E., Peet, C., Stubbs, G., Culver, J. N. & Mann, S. (2003) Nano Lett. 3, 413–417. [Google Scholar]
- 26.Purdy, K. R. & Fraden, S. (2004) Phys. Rev. E Stat. Phys. Plasmas Fluids Relat. Interdiscip. Top. 70, 161703-1–161703-8. [Google Scholar]
- 27.Marvin, D. A. (1998) Curr. Opin. Chem. Biol. 8, 150–158. [Google Scholar]
- 28.Tang, J. X., Janmey, P. A., Lyubartsev, A. & Nordenskio, L. (2002) Biophys. J. 83, 566–581. [DOI] [PMC free article] [PubMed] [Google Scholar]
- 29.Zimmermann, K., Hagedorn, H., Heuck, C. C., Hinrichsen, M. & Ludwig, H. (1986) J. Biol. Chem. 261, 1653–1655. [PubMed] [Google Scholar]
- 30.Handley, D. A. (1989) in Colloidal Gold: Principles, Methods, and Applications, ed. Hayat, M. A. (Academic, San Diego), Vol. 1, pp. 23–27. [Google Scholar]
- 31.Gasteiger, E., Hoogland, C., Gattiker, A., Duvaud, S., Wilkins, M. R., Appel, R. D. & Bairoch, A. (2005) in The Proteomics Protocols Handbook, ed. Walker, J. M. (Humana, Totowa, NJ), pp. 571–608.
- 32.Elghanian, R., Storhoff, J. J., Mucic, R. C., Letsinger, R. L. & Mirkin, C. A. (1997) Science 277, 1078–1081. [DOI] [PubMed] [Google Scholar]
- 33.Aubrey, K. L. & Thomas, G. J., Jr. (1991) Biophys. J. 60, 1337–1349. [DOI] [PMC free article] [PubMed] [Google Scholar]
- 34.Overman, S. A. & Thomas, G. J., Jr. (1999) Biochemistry 38, 4018–4027. [DOI] [PubMed] [Google Scholar]
- 35.Schwartzberg, A. M., Grant, C. D., Wolcott, A., Talley, C. E., Huser, T. R., Bogomolni, R. & Zhang, J. Z. (2004) J. Phys. Chem. B 108, 19191–19197. [Google Scholar]
- 36.Holze, R. (1993) Electrochim. Acta 38, 947–956. [Google Scholar]
- 37.Cao, P., Gu, R. & Tian, Z. (2003) J. Phys. Chem. B 107, 769–777. [Google Scholar]
- 38.Albelda, S. M., Mette, S. A., Elder, D. E., Stewart, R., Damjanovich, L., Herlyn, M. & Buck, C. A. (1990) Cancer Res. 50, 6757–6764. [PubMed] [Google Scholar]
- 39.Arap, W., Pasqualini, R. & Ruoslahti, E. (1998) Science 279, 377–380. [DOI] [PubMed] [Google Scholar]
- 40.Chen, L., Zurita, A. J., Ardelt, P. U., Giordano, R. J., Arap, W. & Pasqualini, R. (2004) Chem. Biol. 11, 1081–1091. [DOI] [PubMed] [Google Scholar]
- 41.Kneipp, K., Kneipp, H., Itzkan, I., Dasari, R. R. & Feld, M. S. (1999) Chem. Rev. 99, 2957–2976. [DOI] [PubMed] [Google Scholar]
- 42.Cao, Y. C., Jin, R. & Mirkin, C. A. (2002) Science 297, 1536–1540. [DOI] [PubMed] [Google Scholar]
- 43.Snyder, E. Y., Deitcher, D. L., Walsh, C., Arnold-Aldea, S., Hartweig, E. A. & Cepko, C. L. (1992) Cell 68, 33–51. [DOI] [PubMed] [Google Scholar]
Associated Data
This section collects any data citations, data availability statements, or supplementary materials included in this article.


