Abstract
Polyadenylation of B19 pre-mRNAs at the major internal site, (pA)p1, is programmed by the nonconsensus core cleavage and polyadenylation specificity factor-binding hexanucleotide AUUAAA. Efficient use of this element requires both downstream and upstream cis-acting elements and is further influenced by an adjacent AAUAAC motif. The primary hexanucleotide element must be nonconsensus to allow efficient readthrough of P6-generated pre-mRNAs into the capsid-coding region. An additional cleavage and polyadenylation site, (pA)p2, 296 nucleotides downstream of (pA)p1 was shown to be used following both B19 infection and transfection of a genomic clone. RNAs polyadenylated at (pA)p2 comprise approximately 10% of B19 RNAs that are polyadenylated internally.
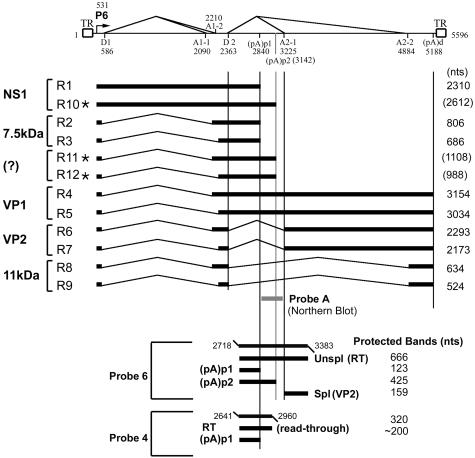
Parvovirus B19, the only parvovirus known to be pathogenic in humans, causes a variety of diseases in both children and adults (15). The transcription map of B19 (8), while similar to that of the closely related simian parvovirus (4, 14), is quite different from those of other known parvoviruses (11). Only a single promoter (P6) has been identified for B19, and the pre-mRNA it produces is alternatively spliced and polyadenylated to generate nine mRNAs (Fig. 1) (4, 8).
FIG. 1.
Transcription map of B19. The transcription map of B19 is shown, indicating the RNA initiation site, splice junctions (donors D1 and D2 and acceptors A1-1-A1-2 and A2-1-A2-2), and cleavage and polyadenylation sites [(pA)p1, (pA)p2, and (pA)d)], as well as the predicted protein products, for all B19 RNAs so far identified. The protein products for RNAs designated by (?) have not been characterized. The asterisks label RNAs using the second internal polyadenylation site (pA)p2, first described in this paper (see text). The positions of probes 4 (nt 2641 to 2960) and 6 (nt 2718 to 3383), used for RNase protection assays, are shown in relation to the map, and the predicted protected bands are displayed. The position of probe A (nt 2843 to 3200), used for the Northern blot analysis shown in Fig. 4, is also shown. RT, readthrough.
Notably, a subset of B19 RNAs are polyadenylated at a site in the center of the genome (Fig. 1) [here termed (pA)p]. Although B19 was the first parvovirus to be shown to use an internal polyadenylation site in its expression profile, this feature has subsequently been identified in a number of other parvoviruses (1, 4, 9, 10, 14).
The B19 transcription map predicts that polyadenylation at (pA)p prevents B19 P6-generated mRNAs from including the capsid-coding open reading frame. Polyadenylation at (pA)p must therefore be incomplete, and it has been suggested that this RNA-processing event plays a role in the tissue-specific replication of B19 (3). At the least, alternative polyadenylation and alternative splicing of B19 pre-mRNAs must be tightly interconnected to generate appropriate amounts of all B19 mRNAs. The cis-acting signals that govern cleavage and polyadenylation at (pA)p have not yet been characterized.
The parent plasmid used for most experiments in this study was based on the nearly full-length B19 genomic clone (GenBank accession no. AY386330) described by Zhi et al. (17). B19 sequences (position 194 to 5409) from this plasmid were cloned into the C1 plasmid backbone (derived from the pEGFP-C1 plasmid [Clontech], which contains the simian virus [40 origin of replication] to make manipulation more convenient. Nucleotides 751 and 752 within the NS1 gene were then deleted to prevent any effects that might be due to replication. This parent plasmid was termed pC1NS(−). Many of the experiments described were also performed with a plasmid in which the B19 NS1 region remained wild type, and no differences due to NS1 were detected (data not shown). A map showing the probes used and the predicted products expected for the RNase protection assays described below is presented in Fig. 1 in relation to the current transcription map for B19.
Identification of the core cleavage and polyadenylation specificity factor (CPSF) hexanucleotide-binding site used for internal polyadenylation.
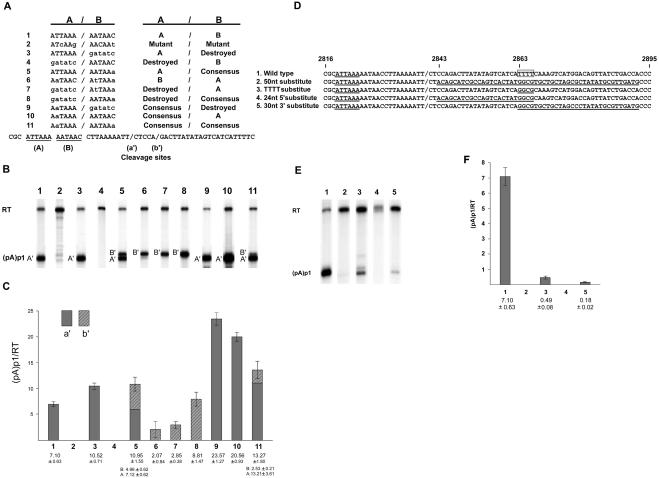
Using anchored reverse transcription-PCR (RT-PCR) as performed previously (10), we first mapped the RNA cleavage site of the major internal polyadenylation site, termed (pA)p1 (labeled a′ in Fig. 2A), to B19 nucleotide (nt) 2842 (see also Fig. 4B). There is no canonical core AAUAAA CPSF-binding site in the region of (pA)p1; however, there is an extended motif, AUUAAA/AAUAAC, shortly upstream of the RNA cleavage site that could perform this function. Analysis of core element usage in the mammalian genome has shown that AUUAAA is the second most common CPSF-binding site; however, it is used in fewer than 15% of transcription units (16). Mutation together of both the first and second hexanucleotide components of this motif (termed A and B, respectively) (Fig. 2A) in pC1NS(−) to the sequences shown prevented polyadenylation at (pA)p1 (Fig. 2B and C, lane and bar 2). Mutation of the B hexanucleotide to the non-CPSF-binding sequence shown resulted in a small but reproducible increase in the percentage of B19 RNAs polyadenylated at (pA)p1 (Fig. 2B and C, lane and bar 3); however, mutation of the A hexanucleotide reduced polyadenylation at (pA)p1 dramatically (Fig. 2B and C, lane and bar 4). This suggested that the A hexanucleotide, AUUAAA, was the primary core CPSF-binding element responsible for polyadenylation of B19 RNA at (pA)p1. In addition, because disruption of the B motif resulted in an increase in relative polyadenylation at (pA)p1, the B motif also influences the activity of the A motif.
FIG. 2.
Characterization of the core hexanucleotide and downstream element required for polyadenylation at (pA)p1. (A) The (pA)p1 extended core polyadenylation motif, indicating the A and B components (line 1), as well as all mutations of these components (lines 2 to 11), as described in the text. The two cleavage sites (designated a′ and b′), as determined by anchored RT-PCR as previously described (10), are indicated in the sequence at the bottom. (B) RNase protection assays, performed as previously described (7, 12) using probe 4 (see Fig. 1), of RNA generated in COS7 cells following transfection of wild-type or mutant plasmids as characterized in panel A. Bands representing RNAs that either read through (RT) or are polyadenylated at (pA)p1 are designated to the left of the gel. (C) Quantification, using a Molecular Imager FX and Quantity One version 4.2.2 image software (Bio-Rad, Hercules, CA), of the RNase protections shown in panel B. Data from at least three experiments are presented as the ratio of transcripts terminated at (pA)p1 relative to those reading through. The filled and hatched portions of the bars represent (pA)p1 polyadenylated RNAs that are cleaved at sites a′ and b′, respectively. Error bars indicate standard deviations. (D) Nucleotide sequence of B19 from nt 2816 to 2895, which encompasses the downstream element required for polyadenylation at (pA)p1, for the wild type and the mutants described in the text. The essential ATTAAA hexanucleotide starting at nt 2819 for each is underlined, the a′ cleavage site is indicated by a slash, and mutated sequences downstream of the cleavage site that have been changed are also underlined. The 4-nt poly(T) motif is indicated within an open square. (E) RNase protection assays, performed as previously described (7, 12) using probe 4 (see Fig. 1), of RNA generated in COS7 cells following transfection of wild-type or mutant plasmids. Bands representing RNAs that either read through or are polyadenylated at (pA)p1 are designated to the left of the gel. (F) Quantification, as in panel C, of RNase protection assays as shown in panel E. Data from at least three experiments are presented as the ratio of transcripts terminated at (pA)p1 relative to those reading through. All RNAs generated by these mutants were cleaved at site a′.
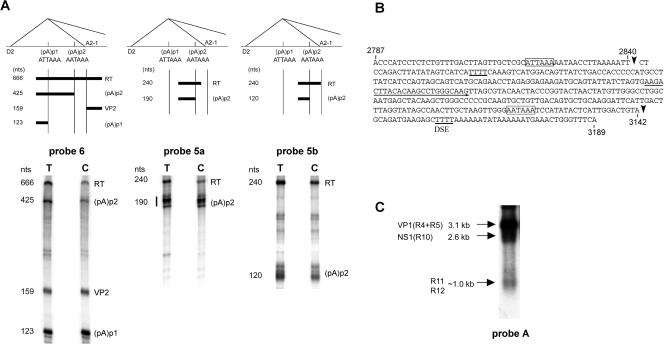
FIG. 4.
Approximately 10% of B19 P6-generated RNA polyadenylated in the center of the genome uses a second site, (pA)p2. (A) RNase protection assays showing the usage of (pA)p2. The top shows the locations of the probes used for protection assays (probes 6, 5a, and 5b, left to right) in relation to (pA)p1 and (pAp)2, the intron donor D2 and acceptor A2-1, and the bands predicted to be protected by RNAs polyadenylated at the two sites. RNase protection assays, performed as previously described (7, 12), of RNA generated in COS7 cells following transfection of pC1NS(−), using the three probes, are shown underneath each relevant diagram. The identities of the bands are labeled and correlate to the diagram above. RT, readthrough. (B) Nucleotide sequence of B19 from nt 2787 to 3189, showing the locations of the main (pA)p1 cleavage site (a′) at nt 2840 and of the cleavage site for (pA)p2 at nt 3142 (arrows). The (pA)p1 hexanucleotide motif identified in Fig. 2 and the putative consensus AATAAA signal of (pA)p2 are indicated by open boxes. Note that there are four T residues 36 nt downstream of this site, which could function as a downstream element (DSE). The (pA)p2 cleavage site was identified from RNA generated following both pC1NS(−) transfection of COS7 cells and B19 infection of erythropoietin-treated UT-7/EpoS1 cells (6), by anchored RT-PCR as previously described (10), using a forward primer which is indicated by an underline and was the same for both cell types. (C). Northern analysis, using probe A, of RNA generated following pC1NS(−) transfection of COS7 cells. The identities of the RNA transcripts are shown on the left. The probe, which lies downstream of (pA)p1, hybridizes with VP1-encoding R4 and R5; RNA R10, which could encode NS1; R11, which encodes the 7.5-kDa protein; and R12, from which no other protein product has been described.
Improvement to consensus (to AAUAAA) of the B motif also modestly increased the total percentage of steady-state RNA that was found to be polyadenylated at (pA)p1; however, in this case, oligoadenylate residues were added, at an approximately equal frequency, to an additional cleavage site at nt 2840 (labeled b′ in Fig. 2A) 5 nucleotides downstream of the wild-type site (Fig. 2B and C, lane and bar 5). This suggested that in this mutant, cleavage was directed by both core sequences at approximately equal levels. Switching the core hexanucleotide motifs resulted in a net reduced efficiency of (pA)p1 usage, and in this situation, all RNA polyadenylated at (pA)p utilized the downstream cleavage site b′ (Fig. 2B and C, lane and bar 6). These results suggested that the downstream position itself was less efficient (perhaps due to its position relative to the downstream element discussed below), and indeed, the efficiency of cleavage and polyadenylation (at the b′ site) directed by the A hexanucleotide alone in the downstream position was similarly reduced (Fig. 2B and C, lane and bar 7). Polyadenylation directed by a consensus core hexanucleotide (AAUAAA) alone in the downstream position restored polyadenylation (at the b′ site) to wild-type levels (Fig. 2B and C, lane and bar 8); however, this level was lower than levels directed by a single consensus core hexanucleotide in the upstream position (Fig. 2B and C, lane and bar 9). Interestingly, polyadenylation directed by a consensus core sequence in the upstream position was reduced when the wild-type B hexanucleotide, which itself could not direct cleavage and polyadenylation, was present in the downstream position (Fig. 2B and C, compare lanes and bars 9 and 10) and was reduced even more when a consensus core sequence was placed in the downstream position (Fig. 2B and C, lane and bar 11). These results suggested that a nonconsensus core element must be present to allow wild-type levels of readthrough of (pA)p1 and further, consistent with results shown in lane and bar 3 of Fig. 2B and C, that the downstream site acts competitively with the upstream site.
Identification of the downstream element required for efficient polyadenylation at (pA)p.
Most polyadenylation sites have essential G/U-rich downstream elements that serve as binding sites for CstF (16). Replacement of 50 nucleotides downstream of the B19 (pA)p cleavage site with heterologous sequence (between nt 2843 and 2892 [Fig. 2D, line 2]) essentially abolished polyadenylation at that site (Fig. 2E and F, lane and bar 2), suggesting that this region, which has a stretch of four U residues between nt 2863 and 2866 (Fig. 2D, line 1), contained a downstream element required for efficient polyadenylation at the nonconsensus (pA)p1. Replacement of 24 nt in the 5′ half of the 50-nt region (nt 2843 to 2865 [Fig. 2D, line 4]), including the four-U stretch, reduced polyadenylation at (pA)p1 to below detectable levels, similar to replacement of the complete 50-nt region (Fig. 2E and F, compare lanes 2 and 4). Replacement of the four-U stretch and an additional 26 nt downstream (Fig. 2D, line 5) reduced polyadenylation at (pA)p1 significantly; however, low levels were still detected (Fig. 2E and F, lane and bar 5). Mutation of the four-U motif (Fig. 2D, line 3) reduced polyadenylation at (pA)p by about 14-fold (Fig. 2E and F, lane and bar 3), demonstrating that this motif was the major component of the essential downstream element, although the region upstream of the four-U stretch may also play a role in efficient usage of (pA)p (Fig. 2E and F, lane and bar 5).
Identification of an upstream element required for efficient polyadenylation at (pA)p.
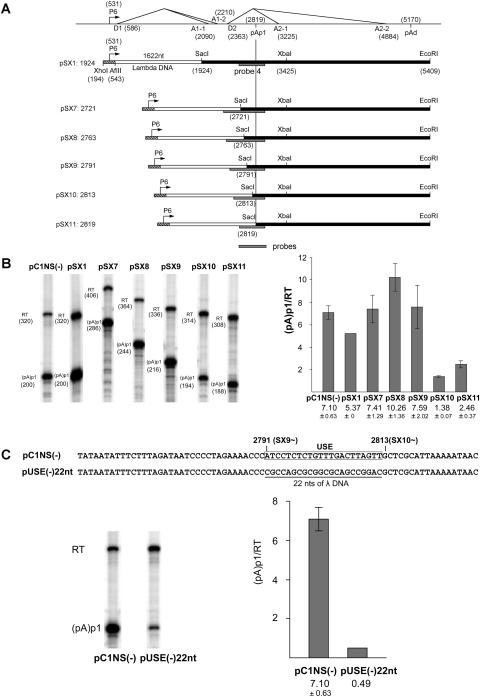
Replacement of B19 sequences upstream of nt 2791 with heterologous sequence from bacteriophage lambda (pSX1, pSX7, pSX8, and pSX9 [Fig. 3A ]) had no deleterious effect on the efficiency of polyadenylation at (pA)p1 (Fig. 3B); however, when the region downstream of nt 2791 was replaced (e.g., pSX10 [Fig. 3A]), polyadenylation at (pA)p1 was reduced approximately sevenfold (Fig. 3B). This suggested that the region between nt 2791 and 2813 contained an upstream region required for efficient polyadenylation at (pA)p1. Replacement, specifically, of this 22-nt region with a different heterologous sequence from a different region of the lambda genome [pUSE(−)22nt (Fig. 3C, top)] had a similar effect [in this case a reduction of greater than 15-fold; compare pUSE(−)22nt to pC1NS(−) in Fig. 3C], suggesting that the region from nt 2791 to 2813 of wild-type B19 contained an upstream element required for efficient polyadenylation at (pA)p1.
FIG. 3.
Characterization of an upstream element required for efficient polyadenylation at (pA)p1. (A) Constructs (pSX1 and pSX7 to -pSX11) used to identify potential upstream elements required for polyadenylation at (pA)p1 are shown relative to the transcription map of B19 (which is labeled as in Fig. 1). The borders of the B19 sequence in each case are identified. The lambda DNA sequence was a 1,622-nt fragment taken from the region from nt 3521 to 5142 of the lambda genome. The B19 region surrounding the P6 promoter does not contain the D1 donor. The locations of the probes used for RNase protection assays described below are indicated. Homologous probes were used in each case. The 3′ end of each probe was at B19 nt 2960, and the 5′ end was at lambda nt 4983; however, since the amount of B19 sequence between these points was different in each construct, as shown, the individual probe sizes and the fragments they protected were different. (B) Left panel, RNase protection assays, performed as previously described (7, 12) using probe 4 (see Fig. 1), of RNA generated in COS7 cells following transfection of wild-type or mutant plasmids as characterized in panel A. Bands representing RNAs that either read through (RT) or are polyadenylated at (pA)p1 are designated to the left of each lane. Right panel, quantification (as in Fig. 2) of the RNase protections shown in the left panel. Data from at least three experiments is presented as the ratio of transcripts terminated at (pA)p1 relative to those reading through. Error bars indicate standard deviations. (C) The nucleotide sequences of pC1NS1(−) and pUSE(−)22nt, including the 22-nt putative upstream element (USE) region between nt 2791 and 2813, is shown at the top. Also shown are RNase protection assays, performed as previously described (7, 12) using probe 4 (see Fig. 1), of RNA generated in COS7 cells following transfection of pC1NS(−) or pUSE(−)22nt. Bands representing RNAs that either read through or are polyadenylated at (pA)p1 are designated to the left of the gel. Quantification, performed as described for Fig. 2, of the RNase protections shown is also presented. Data from at least three experiments are presented as the ratio of transcripts terminated at (pA)p1 relative to those reading through.
A second polyadenylation site can be used in the center of the B19 genome.
Analysis of RNA from B19-infected COS7 cells by using RNase protection probe 6 from the center of the genome revealed that a significant amount of both total and cytoplasmic B19 RNA was polyadenylated at a second site, termed (pA)p2, downstream of the previously characterized (pA)p1 site (Fig. 4A, left panel). The use of this site was confirmed using two probes that spanned (pA)p2 but which would be predicted to protect bands of different sizes. Probes 5a and 5b each protected a 240-nt band derived from complete protection by a readthrough RNA, while probe 5a protected an additional band of approximately 190 nt and probe 5b protected as additional band of approximately 120 nt, consistent with protection of RNA cleaved and polyadenylated at (pA)p2 (Fig. 4A, middle and right panels).
The (pA)p2 cleavage site of RNAs generated following transfection of COS-7 cells, as well as viral infection of erythropoietin-treated (6) permissive UT-7/Epo-S1 cells, was mapped by anchored RT-PCR to nt 3142 (Fig. 4B, top). This was approximately 22 nt downstream of a consensus hexanucleotide and is followed, similar to the case for (pA)p1, by a U-rich sequence downstream (Fig. 4B). RNAs polyadenylated at (pA)p2 accumulate to levels that are approximately 10-fold lower than those of RNAs polyadenylated at (pA)p, as detected both in RNase protection assays (Fig. 4A) and by Northern analysis (R11 and R12 in Fig. 4C) using probe A, which extends from a point downstream of (pA)p1 nt 2843 to 3200.
Polyadenylation at (pA)p2 would be predicted to extend the open reading frames of a subset of NS1 proteins (from RNA R10 [Fig. 1]) and introduce an open reading frame in RNA R12, which has no other predicted protein product (Fig. 1). (pA)p2 is used at a relatively high frequency, and ongoing experiments are designed to identify additional protein products generated from RNAs polyadenylated at this site. Additionally, it will be interesting to understand why the more consensus (pA)p2 signal is not favored over (pA)p1.
The relative rates of alternative polyadenylation and alternative splicing are key features that determine the relative amounts of the B19 NS and capsid proteins. It has been previously suggested that this balance influences the tissue-specific replication of B19 (2, 3, 5, 13), and we have noted differences in the processing of B19 RNA in permissive versus nonpermissive cells (data not shown), which is the subject of continuing experimentation. For B19, the RNAs encoding the capsid protein VP1 retain the internal polyadenylation signal, and so these RNAs must be recalcitrant to cleavage and polyadenylation directed by these signals. Whether this alternative polyadenylation is a stochastic phenomenon, reflecting a poor efficiency of polyadenylation, or whether other factors are involved is not yet known.
Acknowledgments
We thank Lisa Burger and Fang Cheng for excellent technical assistance and Greg Tullis for critical reading of the manuscript. We are grateful to Kevin Brown and Ning Zhi (NIH) for providing reagents, advice, and information prior to publication.
This work was supported by Public Health Service grants RO1 AI56310 and RO1 AI21302 from the NIAID to D.J.P.
REFERENCES
- 1.Alexandersen, S., M. E. Bloom, and S. Perryman. 1988. Detailed transcription map of Aleutian mink disease parvovirus. J. Virol. 62:3684-3694. [DOI] [PMC free article] [PubMed] [Google Scholar]
- 2.Beard, C., J. St. Amand, and C. R. Astell. 1989. Transient expression of B19 parvovirus gene products in COS-7 cells transfected with B19-SV40 hybrid vectors. Virology 172:659-664. [DOI] [PubMed] [Google Scholar]
- 3.Liu, J. M., S. W. Green, T. Shimada, and N. S. Young. 1992. A block in full-length transcript maturation in cells nonpermissive for B19 parvovirus. J. Virol. 66:4686-4692. [DOI] [PMC free article] [PubMed] [Google Scholar]
- 4.Liu, Z., J. Qiu, F. Cheng, Y. Chu, Y. Yoto, M. G. O'Sullivan, K. E. Brown, and D. J. Pintel. 2004. Comparison of the transcription profile of simian parvovirus with that of the human erythrovirus B19 reveals a number of unique features. J. Virol. 78:12929-12939. [DOI] [PMC free article] [PubMed] [Google Scholar]
- 5.Luo, W., and C. R. Astell. 1993. A novel protein encoded by small RNAs of parvovirus B19. Virology 195:448-455. [DOI] [PubMed] [Google Scholar]
- 6.Morita, E., K. Tada, H. Chisaka, H. Asao, H. Sato, N. Yaegashi, and K. Sugamura. 2001. Human parvovirus B19 induces cell cycle arrest at G2 phase with accumulation of mitotic cyclins. J. Virol. 75:7555-7563. [DOI] [PMC free article] [PubMed] [Google Scholar]
- 7.Naeger, L. K., R. V. Schoborg, Q. Zhao, G. E. Tullis, and D. J. Pintel. 1992. Nonsense mutations inhibit splicing of MVM RNA in cis when they interrupt the reading frame of either exon of the final spliced product. Genes Dev. 6:1107-1119. [DOI] [PubMed] [Google Scholar]
- 8.Ozawa, K., J. Ayub, Y. S. Hao, G. Kurtzman, T. Shimada, and N. Young. 1987. Novel transcription map for the B19 (human) pathogenic parvovirus. J. Virol. 61:2395-2406. [DOI] [PMC free article] [PubMed] [Google Scholar]
- 9.Qiu, J., F. Cheng, Y. Yoto, Z. Zadori, and D. Pintel. 2005. The expression strategy of goose parvovirus exhibits features of both the Dependovirus and Parvovirus genera. J. Virol. 79:11035-11044. [DOI] [PMC free article] [PubMed] [Google Scholar]
- 10.Qiu, J., R. Nayak, G. E. Tullis, and D. J. Pintel. 2002. Characterization of the transcription profile of adeno-associated virus type 5 reveals a number of unique features compared to previously characterized adeno-associated viruses. J. Virol. 76:12435-12447. [DOI] [PMC free article] [PubMed] [Google Scholar]
- 11.Qiu, J., Y. Yoto, G. Tullis, and D. J. Pintel. Parvovirus RNA processing strategies. In J. R. Kerr, S. F. Cotmore, M. E. Bloom, R. M. Linden, and C. R. Parrish (ed.), Parvoviruses, in press. Hodder Arnold, Ltd., London, United Kindgom.
- 12.Schoborg, R. V., and D. J. Pintel. 1991. Accumulation of MVM gene products is differentially regulated by transcription initiation, RNA processing and protein stability. Virology 181:22-34. [DOI] [PubMed] [Google Scholar]
- 13.St. Amand, J., C. Beard, K. Humphries, and C. R. Astell. 1991. Analysis of splice junctions and in vitro and in vivo translation potential of the small, abundant B19 parvovirus RNAs. Virology 183:133-142. [DOI] [PubMed] [Google Scholar]
- 14.Vashisht, K., K. S. Faaberg, A. L. Aber, K. E. Brown, and M. G. O'Sullivan. 2004. Splice junction map of simian parvovirus transcripts. J. Virol. 78:10911-10919. [DOI] [PMC free article] [PubMed] [Google Scholar]
- 15.Young, N. S., and K. E. Brown. 2004. Parvovirus B19. N. Engl. J. Med. 350:586-597. [DOI] [PubMed] [Google Scholar]
- 16.Zhao, J., L. Hyman, and C. Moore. 1999. Formation of mRNA 3′ ends in eukaryotes: mechanism, regulation, and interrelationships with other steps in mRNA synthesis. Microbiol. Mol. Biol. Rev. 63:405-445. [DOI] [PMC free article] [PubMed] [Google Scholar]
- 17.Zhi, N., Z. Zadori, K. E. Brown, and P. Tijssen. 2004. Construction and sequencing of an infectious clone of the human parvovirus B19. Virology 318:142-152. [DOI] [PubMed] [Google Scholar]


