


Abstract
Operon structures play an important role in co-regulation in prokaryotes. Although over 200 complete genome sequences are now available, databases providing genome-wide operon information have been limited to certain specific genomes. Thus, we have developed an ODB (Operon DataBase), which provides a data retrieval system of known operons among the many complete genomes. Additionally, putative operons that are conserved in terms of known operons are also provided. The current version of our database contains about 2000 known operon information in more than 50 genomes and about 13 000 putative operons in more than 200 genomes. This system integrates four types of associations: genome context, gene co-expression obtained from microarray data, functional links in biological pathways and the conservation of gene order across the genomes. These associations are indicators of the genes that organize an operon, and the combination of these indicators allows us to predict more reliable operons. Furthermore, our system validates these predictions using known operon information obtained from the literature. This database integrates known literature-based information and genomic data. In addition, it provides an operon prediction tool, which make the system useful for both bioinformatics researchers and experimental biologists. Our database is accessible at http://odb.kuicr.kyoto-u.ac.jp/.
INTRODUCTION
With the increasing availability of completely sequenced genomes, comparative genomic approaches are becoming more important to decipher the functions of genes. Methods, which are powerful, using the conservation of gene proximity on genomes (i.e. determining potential operons) can understand functional associations between genes (1–3). Genes in an operon are functionally associated with each other in prokaryotes; thus, various kinds of operon prediction methods have been developed to understand the functional relationships and to annotate genes (4–13). Databases that accumulate the experimentally verified operon information should be useful to validate such prediction methods and also to understand the functional association between genes. However, databases providing genome-wide operon information have been limited to certain specific genomes (14,15). Although the STRING database was developed to identify functional associations between genes for multiple genomes, it uses gene neighborhood based on genome context methods (16). Here, we introduce the database called ODB (Operon DataBase), which provides operon data documented in the literature and putative operons that are conserved in terms of known operons. Furthermore, to characterize operons, it integrates genome context, gene co-expression obtained from microarray data, functional links in biological pathways and data on the conservation of gene order across genomes. ODB also provides operon prediction based on these various types of data as an application of our database. These datasets are fully pre-computed so that all information can be quickly accessed. The ODB database integrates known literature-based information and genomic data. In addition, it provides an operon prediction tool, which makes the system useful for both bioinformatics researchers and experimental biologists.
OPERON DATA SOURCES
We have collected information of known operons of multiple genomes from the literature. We note that the experimentally verified operons, which we have collected, have been verified by a variety of means, from direct measurements such as primer extension and northern blots to less direct methods such as gene knock-out experiments. Our database represents an ongoing effort to increase the coverage of operons. The current version of our database contains about 2000 known operon information in more than 50 genomes obtained from a total of 825 literatures (Table 1). Note that although some of these operons overlap, we use the term ‘operon’ to refer to a ‘transcriptional unit’ individually as opposed to the generally understood usage of the term that may include multiple overlapping transcriptional units. These data also include the operons of Caenorhabditis elegans. Operon structures are often observed in prokaryotes, but nematodes also have similar transcriptional systems (17,18). Thus, we added the eukaryotic operons into our database. Note that the operons from Bacillus subtilis contain operons obtained from transcriptional maps stored in BSORF (http://bacillus.genome.jp/). Because these maps were derived from the results of northern blotting experiments, we added these operons into our database. Note that these entries can be distinguished from the operons obtained from the literature, as the origin of the source (BSORF) is annotated in the database.
Table 1.
Statistics of operons in major genomes
| Species | No. of operons | No. of putative operons |
|---|---|---|
| Eukaryotes: 7 species | ||
| Caenorhabditis elegans | 628 | 149 |
| Saccharomyces cerevisiae | – | 7 |
| Prokaryotes: 177 species | ||
| Bacillus subtilis | 711 | 60 |
| Escherichia coli | 389 | 61 |
| Pseudomonas aeruginosa | 33 | 156 |
| Agrobacterium tumefaciens | 15 | 172 |
| Synechocystis sp. PCC6803 | 12 | 26 |
| Bradyrhizobium japonicum | 10 | 190 |
| Archaea: 19 species | ||
| Methanosarcina acetivorans | – | 44 |
| Pyrococcus furiosus | 2 | 13 |
| Total: 203 species | 1957 | 13 258 |
Table 1 also shows putative operons that are conserved in terms of known operons. When we calculated these conservations, we used KEGG OC as the ortholog gene set (19), which is ortholog gene clustering based on Smith–Waterman sequence similarity scores. If genes in a known operon have ortholog genes in another genome and these ortholog genes are consecutively located on the same strand of the genome, we regarded them as a putative but highly reliable operon. Note that this is not applied to known mono-cistronic genes. Furthermore, the putative operons were also explored from the viewpoint of paralog genes. These putative operons are also explored in eukaryotes. Usually, we do not use the term ‘operon’ for the eukaryotic gene clusters, but we use this term operationally in our database. As a result, over 13 000 putative operons were observed in over 200 genomes.
OVERVIEW OF THE DATABASE
ODB uses a relational database management system (MySQL, http://www.mysql.com/) to store and manage all information including not only known and putative operons but also primary data, such as gene location and definition, and associations between genes. This system contains four types of associations between genes that determine an operon: (i) intergenic distances, (ii) functional links in biological pathways, (iii) gene co-expression obtained from microarray data and (iv) the conservation of gene order across multiple genomes. These four types of associations are considered indicators and that the genes linked by them can organize an operon. Therefore, we pre-calculated these associations among all genes in all available genomes to characterize operons. Genes in an operon are often closely located on the genome compared with those between non-operons. Therefore, this is one of the indicators to characterize operons. Intergenic distances are defined as the number of bases between the end position of a gene and the start position of the next gene on the genome.
In addition, genes in an operon are often functionally related. For example genes appearing in a metabolic pathway are often clustered on the genome to be co-transcribed (20). Such functional links were obtained from KEGG pathway (19). We calculated the number of steps between genes in the pathway maps. The number of steps indicates that when two genes are linked across a compound, the number of steps is one. In this way, we calculated the number of steps not only in the same pathway map but also across different pathway maps.
The KEGG EXPRESSION database contains the gene expression data derived from microarrays of four organisms, B.subtilis, Escherichia coli K-12 W3110, Synechocystis sp. PCC6803 and Saccharomyces cerevisiae (19). We used the information of co-expressed genes from the database. We calculated the Pearson's correlation coefficients between gene expression profiles obtained from these microarray data. Because it is considered that microarray data reflect actual gene transcription and that they are powerful tools to predict operons, co-expressed gene clusters on the genome are possible operons. However, the limitation of experimental conditions and quality of the experiments still leave the issue that certain operons are not transcribed and that the level of gene co-expression is not homogeneous. Therefore, there are cases where genes are not co-expressed even if they are genes in a known operon.
Gene order in an operon is often shuffled and collapsed in evolutionary history (21,22). Therefore, conservation of gene order across genomes is rather rare, especially in distantly related genomes. If such conservation is observed, they are probably related to a physical interaction such as a molecular complex (23). Therefore, this feature is also important in characterizing operons. We calculated the step number between gene pairs. That is, given a gene pair, we took each of their ortholog genes from all genomes, calling this ‘ortholog gene pair’. Then we calculated the step number between these two ortholog genes. When the gene pair is adjacently located on the genome, the step number is regarded as one. Here, we ignore the genomes included in the same taxonomic group, which are defined in KEGG (http://www.genome.jp/kegg/catalog/org_list.html).
All-against-all runs of these associations between genes were performed. Pre-computed results are stored in a table, allowing quick retrieval against the query specified by users. Each table in our system corresponds to a particular genome to facilitate efficient access and retrieval of the information.
When users search a gene or an operon of interest, the gene cluster including it can be identified by its name and identifier. Then, the user is presented with a summary of genes and associations between genes in the region on the genome (Figure 1). Primary data such as gene names, gene IDs, definitions, KO IDs as functional classes, KEGG pathway IDs and EC numbers are presented. These are linked to the KEGG database if available. Additionally, the genomic view of the region of interest is also presented. This view includes graphical symbols of operons, genes, pathways and EC numbers and each symbol is also linked to the KEGG database. The user can also scroll and zoom the region of interest on the genome. Finally, the four types of associations are shown as separate tables. For the biological pathway table, the shortest step numbers between genes are presented. For the ortholog gene table, the shortest step numbers between the ortholog gene pairs are shown. In these tables, additional pages are accessible which show the detail of the information. For the gene expression table, the correlation coefficients between gene expression profiles are shown, and the strength of co-expression is illustrated by a color gradient ranging from blue to red.
Figure 1.
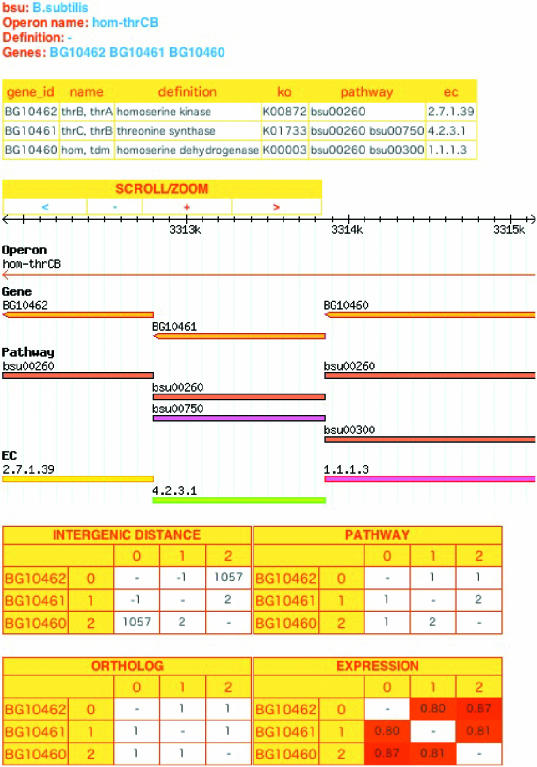
An example view of an operon.
OPERON PREDICTION
Because the conditions to determine putative operons are very strict and are not genome-wide, ODB also provides a system to predict operons, using the four associations. Given a specific species, predicted operons that may exist within that species are returned. There are two options that are available: simple and advanced prediction mode. For a simple mode, users can obtain prediction results based on default parameter values that have been validated by known operons. However, in advanced prediction mode, users can freely change these parameter values, which are based on the four types of associations described above. When genes linked by these associations are clustered on the genome, they are likely to be an operon. Thus, we benchmarked the accuracy of the predictions based on combinations of various values of intergenic distances, step numbers between ortholog genes and the number of the genomes having conserved ortholog genes that are linked within a specific range of step numbers. Therefore, the optimal values that predict the largest number of operons while keeping the accuracy high is provided as default values in simple prediction mode (Supplementary data). When there is little or no known operon information in a genome, the default values of another genome in the same taxonomic group and having sufficient operon information is used as an alternative to the genome. If such genomes are also unavailable, we used the values of B.subtilis (see Supplementary Data for details).
CONCLUDING REMARKS
ODB provides a platform for searching known operons and consequent putative operons and for predicting operons with high accuracy validated by literature-based operon data. It includes about 2000 literature-based operons in over 50 genomes and about 13 000 putative operons in over 200 genomes. In addition, the data from KEGG pathway and related resources that are provided allow analyses not only based on a specific genomic context but also across genomes. Thus, it is the first of its kind to integrate operon data from a variety of genomes, providing a wide-ranging coverage of operons. This integrated system of both known literature-based and genomic data is a useful system for bioinformatics researchers and experimental biologists.
SUPPLEMENTARY DATA
Supplementary Data are available at NAR Online.
Supplementary Material
Acknowledgments
We thank Kiyoko F. Aoki-Kinoshita for critical reading of our manuscript. This work was supported by grants from the Ministry of Education, Culture, Sports, Science and Technology, the Japan Society for the Promotion of Science, and the Japan Science and Technology Agency. The computational resources were provided by the Bioinformatics Center, Institute for Chemical Research, Kyoto University and the Super Computer System, Human Genome Center, Institute of Medical Science, the University of Tokyo. Funding to pay the Open Access publication charges for this article was provided by the grant-in-aid for scientific research from the Ministry of Education.
Conflict of interest statement. None declared.
REFERENCES
- 1.Tamames J., Casari G., Ouzounis C., Valencia A. Conserved clusters of functionally related genes in two bacterial genomes. J. Mol. Evol. 1997;44:66–73. doi: 10.1007/pl00006122. [DOI] [PubMed] [Google Scholar]
- 2.Overbeek R., Fonstein M., D'Souza M., Pusch G.D., Maltsev N. The use of gene clusters to infer functional coupling. Proc. Natl Acad. Sci. USA. 1999;96:2896–2901. doi: 10.1073/pnas.96.6.2896. [DOI] [PMC free article] [PubMed] [Google Scholar]
- 3.Huynen M., Snel B., Lathe W., III, Bork P. Predicting protein function by genomic context: quantitative evaluation and qualitative inferences. Genome Res. 2000;10:1204–1210. doi: 10.1101/gr.10.8.1204. [DOI] [PMC free article] [PubMed] [Google Scholar]
- 4.Bockhorst J., Craven M., Page D., Shavlik J., Glasner J. A Bayesian network approach to operon prediction. Bioinformatics. 2003;19:1227–1235. doi: 10.1093/bioinformatics/btg147. [DOI] [PubMed] [Google Scholar]
- 5.Bockhorst J., Qiu Y., Glasner J., Liu M., Blattner F., Craven M. Predicting bacterial transcription units using sequence and expression data. Bioinformatics. 2003;19(Suppl. 1):i34–i43. doi: 10.1093/bioinformatics/btg1003. [DOI] [PubMed] [Google Scholar]
- 6.Craven M., Page D., Shavlik J., Bockhorst J., Glasner J. A probabilistic learning approach to whole-genome operon prediction. Proc. Int. Conf. Intell. Syst. Mol. Biol. 2000;8:116–127. [PubMed] [Google Scholar]
- 7.Ermolaeva M.D., White O., Salzberg S.L. Prediction of operons in microbial genomes. Nucleic Acids Res. 2001;29:1216–1221. doi: 10.1093/nar/29.5.1216. [DOI] [PMC free article] [PubMed] [Google Scholar]
- 8.Sabatti C., Rohlin L., Oh M.K., Liao J.C. Co-expression pattern from DNA microarray experiments as a tool for operon prediction. Nucleic Acids Res. 2002;30:2886–2893. doi: 10.1093/nar/gkf388. [DOI] [PMC free article] [PubMed] [Google Scholar]
- 9.Yada T., Nakao M., Totoki Y., Nakai K. Modeling and predicting transcriptional units of Escherichia coli genes using hidden Markov models. Bioinformatics. 1999;15:987–993. doi: 10.1093/bioinformatics/15.12.987. [DOI] [PubMed] [Google Scholar]
- 10.Zheng Y., Szustakowski J.D., Fortnow L., Roberts R.J., Kasif S. Computational identification of operons in microbial genomes. Genome Res. 2002;12:1221–1230. doi: 10.1101/gr.200602. [DOI] [PMC free article] [PubMed] [Google Scholar]
- 11.De Hoon M.J., Imoto S., Kobayashi K., Ogasawara N., Miyano S. Predicting the operon structure of Bacillus subtilis using operon length, intergene distance, and gene expression information. Pac. Symp. Biocomput. 2004:276–287. doi: 10.1142/9789812704856_0027. [DOI] [PubMed] [Google Scholar]
- 12.de Hoon M.J., Imoto S., Kobayashi K., Ogasawara N., Miyano S. Inferring gene regulatory networks from time-ordered gene expression data of Bacillus subtilis using differential equations. Pac. Symp. Biocomput. 2003:17–28. [PubMed] [Google Scholar]
- 13.Price M.N., Huang K.H., Alm E.J., Arkin A.P. A novel method for accurate operon predictions in all sequenced prokaryotes. Nucleic Acids Res. 2005;33:880–892. doi: 10.1093/nar/gki232. [DOI] [PMC free article] [PubMed] [Google Scholar]
- 14.Makita Y., Nakao M., Ogasawara N., Nakai K. DBTBS: database of transcriptional regulation in Bacillus subtilis and its contribution to comparative genomics. Nucleic Acids Res. 2004;32:D75–D77. doi: 10.1093/nar/gkh074. [DOI] [PMC free article] [PubMed] [Google Scholar]
- 15.Salgado H., Gama-Castro S., Martinez-Antonio A., Diaz-Peredo E., Sanchez-Solano F., Peralta-Gil M., Garcia-Alonso D., Jimenez-Jacinto V., Santos-Zavaleta A., Bonavides-Martinez C., et al. RegulonDB (version 4.0): transcriptional regulation, operon organization and growth conditions in Escherichia coli K-12. Nucleic Acids Res. 2004;32:D303–D306. doi: 10.1093/nar/gkh140. [DOI] [PMC free article] [PubMed] [Google Scholar]
- 16.von Mering C., Jensen L.J., Snel B., Hooper S.D., Krupp M., Foglierini M., Jouffre N., Huynen M.A., Bork P. STRING: known and predicted protein–protein associations, integrated and transferred across organisms. Nucleic Acids Res. 2005;33:D433–D437. doi: 10.1093/nar/gki005. [DOI] [PMC free article] [PubMed] [Google Scholar]
- 17.Blumenthal T., Evans D., Link C.D., Guffanti A., Lawson D., Thierry-Mieg J., Thierry-Mieg D., Chiu W.L., Duke K., Kiraly M., et al. A global analysis of Caenorhabditis elegans operons. Nature. 2002;417:851–854. doi: 10.1038/nature00831. [DOI] [PubMed] [Google Scholar]
- 18.Lercher M.J., Blumenthal T., Hurst L.D. Coexpression of neighboring genes in Caenorhabditis elegans is mostly due to operons and duplicate genes. Genome Res. 2003;13:238–243. doi: 10.1101/gr.553803. [DOI] [PMC free article] [PubMed] [Google Scholar]
- 19.Kanehisa M., Goto S., Kawashima S., Okuno Y., Hattori M. The KEGG resource for deciphering the genome. Nucleic Acids Res. 2004;32:D277–D280. doi: 10.1093/nar/gkh063. [DOI] [PMC free article] [PubMed] [Google Scholar]
- 20.Ogata H., Fujibuchi W., Goto S., Kanehisa M. A heuristic graph comparison algorithm and its application to detect functionally related enzyme clusters. Nucleic Acids Res. 2000;28:4021–4028. doi: 10.1093/nar/28.20.4021. [DOI] [PMC free article] [PubMed] [Google Scholar]
- 21.Teichmann S.A., Babu M.M. Conservation of gene co-regulation in prokaryotes and eukaryotes. Trends Biotechnol. 2002;20:407–410. doi: 10.1016/s0167-7799(02)02032-2. Discussion 410. [DOI] [PubMed] [Google Scholar]
- 22.Itoh T., Takemoto K., Mori H., Gojobori T. Evolutionary instability of operon structures disclosed by sequence comparisons of complete microbial genomes. Mol. Biol. Evol. 1999;16:332–346. doi: 10.1093/oxfordjournals.molbev.a026114. [DOI] [PubMed] [Google Scholar]
- 23.Dandekar T., Snel B., Huynen M., Bork P. Conservation of gene order: a fingerprint of proteins that physically interact. Trends Biochem. Sci. 1998;23:324–328. doi: 10.1016/s0968-0004(98)01274-2. [DOI] [PubMed] [Google Scholar]
Associated Data
This section collects any data citations, data availability statements, or supplementary materials included in this article.