Abstract
The Tomato Expression Database (TED) includes three integrated components. The Tomato Microarray Data Warehouse serves as a central repository for raw gene expression data derived from the public tomato cDNA microarray. In addition to expression data, TED stores experimental design and array information in compliance with the MIAME guidelines and provides web interfaces for researchers to retrieve data for their own analysis and use. The Tomato Microarray Expression Database contains normalized and processed microarray data for ten time points with nine pair-wise comparisons during fruit development and ripening in a normal tomato variety and nearly isogenic single gene mutants impacting fruit development and ripening. Finally, the Tomato Digital Expression Database contains raw and normalized digital expression (EST abundance) data derived from analysis of the complete public tomato EST collection containing >150 000 ESTs derived from 27 different non-normalized EST libraries. This last component also includes tools for the comparison of tomato and Arabidopsis digital expression data. A set of query interfaces and analysis, and visualization tools have been developed and incorporated into TED, which aid users in identifying and deciphering biologically important information from our datasets. TED can be accessed at http://ted.bti.cornell.edu.
INTRODUCTION
Solanaceae, the nightshade family, as a group represents the third most valuable crop family in the US, exceeded only by the grasses and legumes, and the most valuable family in terms of vegetable crops providing important dietary contributions to human health and nutrition. Tomato (Solanum lycopersicum—until recently termed Lycopersicon esculentum) is the centerpiece system for genetic and molecular research in this family, and has recently been targeted for genome sequencing by an international consortium currently funded and supported by ten contributing countries (1). Tomato has long served as an important model system for fleshy fruit development and ripening, more general plant genetics, disease response and numerous aspects of physiology, resulting in the accumulation of substantial information regarding the biology of this economically important organism.
Recently, a large tomato EST collection has been created which contains >150 000 individual EST sequences representing ∼30 000 unigenes from 27 different tissues/treatments (2). A public cDNA microarray with ∼12 000 elements representing 8700 unigenes has been developed based on this EST collection and is widely used by the Solanaceae research community (http://bti.cornell.edu/CGEP/CGEP.html). Large amounts of gene expression data are being generated using the public array, and it is important to have a systematic approach to archive this information and make it publicly available to derive maximum benefit from the numerous research efforts employing this tool. Our groups have also generated extensive time-course expression profiling data during fruit development and ripening in a normal tomato cultivar and well-defined ripening-related mutants (3). In addition, digital expression (EST abundance) data from the analysis of the full tomato EST collection has been created and is most effectively utilized through an interactive web-based data server (2). In order to (i) provide a central repository for all gene expression data derived from the tomato microarray, (ii) disseminate public expression profiling data during normal and mutant fruit development and ripening, and (iii) present digital expression data for all available tissues and treatments represented in public EST collections, we have generated display, query and analysis tools to assist in development and testing of biological hypotheses based on tomato gene expression data. To this end, we have built an interactive online database—Tomato Expression Database (TED) which can be accessed at http://ted.bti.cornell.edu.
DATABASE IMPLEMENTATION
TED is implemented as a 3-tier software architecture consisting of a web interface, a CGI middle tier which dynamically constructs and executes queries, and a relational database. It operates on a Red Hat Linux system under an Apache web server, and uses MySQL as the database management system. CGI scripts connecting user queries to the database are implemented in Perl, in conjunction with the DBI module that allows the scripts to connect to the back-end database. Basic statistical calculations are implemented as R or in-house Perl scripts, while some time-consuming calculations, such as clustering algorithms, are implemented in C or by wrapping existing third-party tools. Graphical visualization is implemented using a Perl/GD module.
DATABASE COMPONENTS AND FEATURES
TED includes the following three integrated components: the Tomato Microarray Data Warehouse, the Tomato Microarray Expression Database and the Tomato Digital Expression Database. These three components serve different purposes, however they are tightly linked to each other through key gene identifiers [e.g. clone identifier, TIGR Tentative Consensus (TC) number] and allow fluid passage among databases as required by the user. For example, a user querying the Tomato Microarray Expression Database for genes displaying a requested fruit development expression profile, can readily view digital expression data from a broader collection of tissues for any genes resulting from the initial query.
Tomato microarray data warehouse
Similar to many other species-specific microarray databases, such as NASCArrays (4), SGMD (5) and BarleyBase (6), the primary purpose of the tomato microarray data warehouse is to provide public storage/retrieval of raw microarray data and associated experiment information resulting from use of the publicly available tomato microarrays. The database follows MIAME (Minimum Information About Microarray Experiment) guidelines thus facilitating the interpretation of results of a given experiment unambiguously and further allows independent verification and reproduction of the experimental findings (7).
To allow researchers to completely re-analyze published results and to facilitate further discovery, raw images and data files associated with each experiment are readily accessible in zipped format. However, some datasets are password protected prior to publication or upon authors' request. In addition to the data retrieval interface, a simple user-friendly, forms-based online data submission system was developed to facilitate the submission process. Once the data is submitted, instead of uploading it directly into the database, our staff will examine its compliance with MIAME standards and obtain from the authors any missing or improperly formatted information prior to uploading it to the database.
Tomato microarray expression database
Fruit is a major component of human nutrition contributing a significant portion of vitamins, minerals and fiber in a healthy diet. The ripening of fleshy fruit is a coordinated regulatory process involving genetic, hormonal and environmentally controlled interactions leading to complex gene expression patterns (8). In order to gain insights into the molecular basis of fruit development and dissect the regulatory network governing fruit ripening, we performed global expression profiling analysis during fruit development and ripening of tomato and various single mutant gene lines (3). Currently, normalized and processed microarray data for ten time points with nine pair-wise comparisons during wild-type fruit development and ripening, and during development of an ethylene-insensitive, ripening impaired mutant (Never-ripe; Nr) (9), is included in this database. In addition, DNA sequence information of each EST element on the tomato array is included as is corresponding annotation information that was developed for each array unigene sequence.
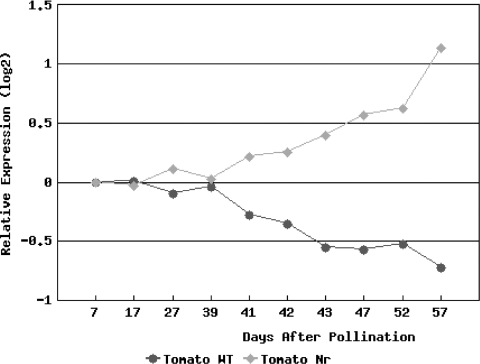
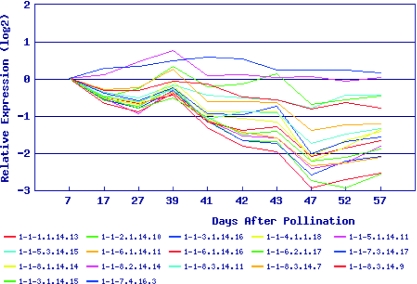
A number of useful query interfaces and data mining, analysis and visualization tools have been developed. The annotation and sequence information in addition to the expression data can be retrieved for any specific EST through the conventional gene identifier query or in batch using the corresponding data mining tools. Sequence similarity searches against all EST sequences on the tomato array are also available through the BLAST (10) search interface. In addition, data for a group of genes can be retrieved by using key word(s) to query EST functional annotations. The said annotations are based on the annotations of SGN (http://www.sgn.cornell.edu) (11) unigenes to which corresponding ESTs belong. ESTs that display simple or complex query patterns of interest can also be retrieved and the normalized ratios and p-values of each hybridization can be sorted. Tools to find genes with similar or inverse expression patterns to a given EST and to compare expression profiles during fruit development for genes of interest in normal and mutant genotypes were also developed (Figure 1). Both tools employ the Pearson correlation coefficient to measure similarity of expression profiles. Since the tomato microarray has occurrences of different ESTs corresponding to the same gene (i.e. pseudo-replicates), we developed a tool to display expression profiles of all the pseudo-replicates representing one particular gene (Figure 2). While the majority of pseudo-replicates yield similar results and serve as a form of validation of the expression profiling results, infrequent instances where they do not yield the same expression profiles do occur and are discussed in Alba et al. (12).
Figure 1.
Cross Genotype Comparison Tool. Comparison of expression profiles of 1-1-3.4.10.21, a Pto-like serine/threonine kinase, during normal tomato and Nr mutant fruit development. The Pearson correlation coefficient (r) of the two profiles is −0.9254.
Figure 2.
Pseudo-replica Expression. Expression profiles of pseudo-replicates from unigene SGN-U212746, a putative peptidyl-prolyl cis–trans isomerase, during normal tomato fruit development and ripening.
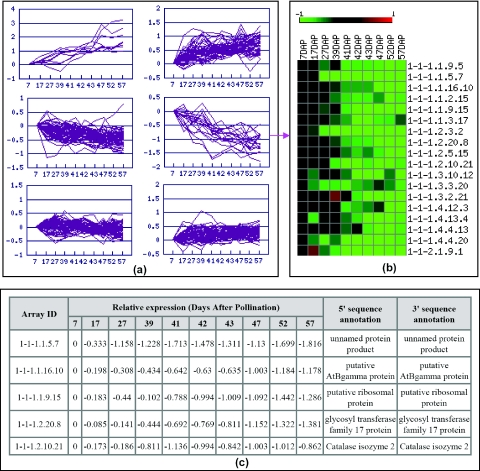
In order to identify functionally related genes based on their expression profiles, we adapted several commonly used clustering programs. Linux version of cluster 3.0 (13) was wrapped for our hierarchical clustering algorithm. The applet version of Java Treeview (14) and slcview (http://slcview.stanford.edu/) were used to visualize the hierarchical clustering results in interactive and static mode, respectively. Perl module Algorithm::Cluster was used to implement k-means and SOM (Self-Organizing Maps) clustering algorithms, and in-house CGI scripts were developed to visualize k-means and SOM results. Figure 3a shows an example of the k-means clustering result. Genes within each cluster generated from k-means and SOM can be further viewed in a heatmap (Figure 3b) which is generated using Matrix2png program (15) or in a table (Figure 3c).
Figure 3.
k-means clustering in TED. (a) Visualization of a k-means clustering result. (b) Heatmap view of expression profiles of genes in one cluster from (a); (c) Table view of expression profiles of genes in one cluster from (a).
Tomato digital expression database
It has been shown previously that EST databases are a valid and reliable source of gene expression data (16). We analyzed a large tomato EST dataset including >150 000 ESTs derived from 27 different non-normalized cDNA libraries to gain insights into differential expression among diverse plant tissues representing a range of developmental programs and biological responses (2). The resulting raw digital expression data for >15 000 unigenes (TIGR TCs) and normalized digital expression data for >6000 TCs were included in this database (2).
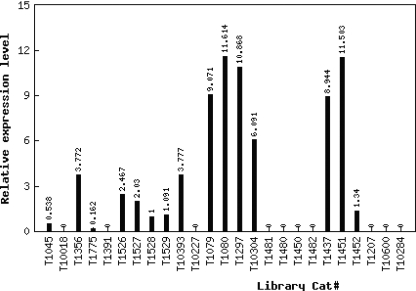
The raw and normalized digital expression data can be retrieved and visualized through gene identifier (TC number) queries. An example of the visualization of normalized digital expression data is shown in Figure 4. The returned page provides a link to the expression profile data during fruit development and ripening for the queried TC so that the digital expression profile and microarray expression profile of the same gene can be compared. Similar tools as those found in the Tomato Microarray Expression Database for BLAST searching against the whole unigene collection are included as are key word(s) search functions. In addition, we implemented online tools to (i) identify differentially expression genes between any two query tissues for which data is available (17), (ii) identify highly abundant genes in a specific tissue, and (iii) compare digital gene expression among tomato and Arabidopsis homologues. Furthermore, the raw and normalized digital gene expression data and corresponding analysis results (e.g. tables of differentially expressed and tissue-specific genes) from Fei et al. (2) are publicly available through the database to all researchers for independent analysis.
Figure 4.
Visualization of digital expression in TED. Normalized digital expression profile of tomato TC115712, a putative plastidic aldolase.
FUTURE DIRECTIONS
We plan to add query interfaces (e.g. capability to search experiments according to authors) to the microarray data warehouse as more experiments are archived. We will also add support to output experimental data sets in MAGE-ML format (MicroArray Gene Expression-Markup Language) (18). We will continue to implement additional clustering and classification tools (e.g. Principle Component Analysis—PCA). Additional analysis tools for expression profile comparison among multiple genotypes will be developed as more datasets are added to TED.
Acknowledgments
We are grateful to Dr Paxton Payton for advice on database design and implementation. This work is supported by grants from the National Science Foundation (DBI-9872617, DBI-0116076, DBI-0211875, DBI-0501778). Funding to pay the Open Access publication charges for this article was provided by National Science Foundation.
Conflict of interest statement. None declared.
REFERENCES
- 1.Mueller L.A., Tanksley S.D., Giovannoni J.J., van Eck J., Stack S., Choi D., Kim B.D., Chen M.S., Cheng Z.K., Li C.Y., et al. The Tomato Sequencing Project, the first cornerstone of the International Solanaceae Project (SOL) Comp. Funct. Genom. 2005;6:153–158. doi: 10.1002/cfg.468. [DOI] [PMC free article] [PubMed] [Google Scholar]
- 2.Fei Z.J., Tang X., Alba R.M., White J.A., Ronning C.M., Martin G.B., Tanksley S.D., Giovannoni J.J. Comprehensive EST analysis of tomato and comparative genomics of fruit ripening. Plant J. 2004;40:47–59. doi: 10.1111/j.1365-313X.2004.02188.x. [DOI] [PubMed] [Google Scholar]
- 3.Alba R., Payton P., Fei Z.J., McQuinn R., Debbie P., Martin G.B., Tanksley S.D., Giovannoni J.J. Transcriptome and Selected Metabolite Analysis Reveal Multiple Points of Ethylene Control during Tomato Fruit Development. Plant Cell. 2005;17:2954–2965. doi: 10.1105/tpc.105.036053. [DOI] [PMC free article] [PubMed] [Google Scholar]
- 4.Craigon D.J., James N., Okyere J., Higgins J., Jotham J., May S. NASCArrays: a repository for microarray data generated by NASC's transcriptomics service. Nucleic Acids Res. 2004;32:D575–D577. doi: 10.1093/nar/gkh133. [DOI] [PMC free article] [PubMed] [Google Scholar]
- 5.Alkharouf N.W., Matthews B.F. SGMD: the soybean Genomics and Microarray database. Nucleic Acids Res. 2004;32:D398–D400. doi: 10.1093/nar/gkh126. [DOI] [PMC free article] [PubMed] [Google Scholar]
- 6.Shen L.H., Gong J., Caldo R.A., Nettleton D., Cook D., Wise R.P., Dickerson J.A. BarleyBase—an expression profiling database for plant genornics. Nucleic Acids Res. 2005;33:D614–D618. doi: 10.1093/nar/gki123. [DOI] [PMC free article] [PubMed] [Google Scholar]
- 7.Brazma A., Hingamp P., Quackenbush J., Sherlock G., Spellman P., Stoeckert C., Aach J., Ansorge W., Ball C.A., Causton H.C., et al. Minimum information about a microarray experiment (MIAME)—toward standards for microarray data. Nature Genet. 2001;29:365–371. doi: 10.1038/ng1201-365. [DOI] [PubMed] [Google Scholar]
- 8.Giovannoni J.J. Genetic regulation of fruit development and ripening. Plant Cell. 2004;16:S170–S180. doi: 10.1105/tpc.019158. [DOI] [PMC free article] [PubMed] [Google Scholar]
- 9.Lanahan M.B., Yen H.C., Giovannoni J.J., Klee H.J. The never ripe mutation blocks ethylene perception in tomato. Plant Cell. 1994;6:521–530. doi: 10.1105/tpc.6.4.521. [DOI] [PMC free article] [PubMed] [Google Scholar]
- 10.Altschul S.F., Gish W., Miller W., Myers E.W., Lipman D.J. Basic local alignment search tool. J. Mol. Biol. 1990;215:403–410. doi: 10.1016/S0022-2836(05)80360-2. [DOI] [PubMed] [Google Scholar]
- 11.Mueller L.A., Solow T.H., Taylor N., Skwarecki B., Buels R., Binns J., Lin C.W., Wright M.H., Ahrens R., Wang Y., et al. The SOL Genomics Network. A comparative resource for Solanaceae biology and beyond. Plant Physiol. 2005;138:1310–1317. doi: 10.1104/pp.105.060707. [DOI] [PMC free article] [PubMed] [Google Scholar]
- 12.Alba R., Fei Z.J., Payton P., Liu Y., Moore S.L., Debbie P., Cohn J., D'Ascenzo M., Gordon J.S., Rose J.K.C., et al. ESTs, cDNA microarrays, and gene expression profiling: tools for dissecting plant physiology and development. Plant J. 2004;39:697–714. doi: 10.1111/j.1365-313X.2004.02178.x. [DOI] [PubMed] [Google Scholar]
- 13.de Hoon M.J., Imoto S., Nolan J., Miyano S. Open source clustering software. Bioinformatics. 2004;20:1453–1454. doi: 10.1093/bioinformatics/bth078. [DOI] [PubMed] [Google Scholar]
- 14.Saldanha A.J. Java Treeview—extensible visualization of microarray data. Bioinformatics. 2004;20:3246–3248. doi: 10.1093/bioinformatics/bth349. [DOI] [PubMed] [Google Scholar]
- 15.Pavlidis P., Noble W.S. Matrix2png: a utility for visualizing matrix data. Bioinformatics. 2003;19:295–296. doi: 10.1093/bioinformatics/19.2.295. [DOI] [PubMed] [Google Scholar]
- 16.Ewing R.M., Ben Kahla A., Poirot O., Lopez F., Audic S., Claverie J.M. Large-scale statistical analyses of rice ESTs reveal correlated patterns of gene expression. Genome Res. 1999;9:950–959. doi: 10.1101/gr.9.10.950. [DOI] [PMC free article] [PubMed] [Google Scholar]
- 17.Audic S., Claverie J.M. The significance of digital gene expression profiles. Genome Res. 1997;7:986–995. doi: 10.1101/gr.7.10.986. [DOI] [PubMed] [Google Scholar]
- 18.Spellman P.T., Miller M., Stewart J., Troup C., Sarkans U., Chervitz S., Bernhart D., Sherlock G., Ball C., Lepage M., et al. Design and implementation of microarray gene expression markup language (MAGE-ML) Genome Biol. 2002;3 doi: 10.1186/gb-2002-3-9-research0046. RESEARCH0046. [DOI] [PMC free article] [PubMed] [Google Scholar]


