


Abstract
TreeFam is a database of phylogenetic trees of gene families found in animals. It aims to develop a curated resource that presents the accurate evolutionary history of all animal gene families, as well as reliable ortholog and paralog assignments. Curated families are being added progressively, based on seed alignments and trees in a similar fashion to Pfam. Release 1.1 of TreeFam contains curated trees for 690 families and automatically generated trees for another 11 646 families. These represent over 128 000 genes from nine fully sequenced animal genomes and over 45 000 other animal proteins from UniProt; ∼40–85% of proteins encoded in the fully sequenced animal genomes are included in TreeFam. TreeFam is freely available at http://www.treefam.org and http://treefam.genomics.org.cn.
INTRODUCTION
As the genomes of multiple species are sequenced, we want to transfer information between corresponding genes in different organisms. To do this, and gain a full understanding of the evolution of animals and their genomes, it will be important to know the evolutionary history of their genes, based on how they are related in gene families. The best way to study the history of a gene family is to construct a phylogenetic tree, from which one can infer genes that share a common ancestor due to speciation (orthologs), or due to duplication (paralogs) (1), as well as patterns of gene duplication and loss. As a result, we decided to develop TreeFam, a database of curated phylogenetic trees of all animal gene families. TreeFam aims to be a resource for identifying orthologs between animal species, and for studying the evolution of animal gene families.
In TreeFam, orthologs and paralogs are inferred from the phylogenetic tree of a gene family. In this way, ortholog inference in TreeFam is different from that used by most other ortholog databases such as Inparanoid (2), Ensembl-Compara (3), KOGs (4), OrthoMCL (5) and HomoloGene (6). These databases infer orthologs and paralogs from BLAST matches (Inparanoid, KOGs and OrthoMCL), or BLAST matches and synteny (Ensembl-Compara and HomoloGene). However, tree-based inference of orthologs is more robust because evolutionary rates, and therefore pair-wise BLAST scores, can vary greatly between members of the same gene family (7). Tree-based results are also more intuitive and informative, since they visually present the history of a gene family (8), and allow lineage-specific duplications and losses to be inferred by comparing the gene tree to the species tree (9).
Orthology, gene duplication and loss make sense in the context of a phylogenetic tree; indeed they are constrained by a tree. To our knowledge, only one previous database of orthologs, HOGENOM (10) has inferred orthologs from phylogenetic trees. HOGENOM focuses on gene families from completely sequenced genomes. In contrast to TreeFam, which contains curated trees, HOGENOM is based completely upon automatically generated trees. However, automatic trees are often incorrect, either because of poor data quality (such as few informative sites or incorrect gene predictions) or because the tree reconstruction algorithm assumes an unrealistic model of evolution (such as assuming that different lineages have evolved at the same rate) (11). There is currently no tree reconstruction algorithm that can solve all these difficulties. We believe that orthology and paralogy statements must be consistent with the tree we present. Therefore, to improve the accuracy with which TreeFam reflects the orthology relationships and history of gene duplications and losses in a family, our approach is that human experts manually curate the automatic trees. The curators only edit a tree if additional phylogenetic analyses and information such as gene function strongly suggest that the automatic tree is incorrect. We allow multifurcating trees if there is ambiguity.
In addition to inferring orthologs, TreeFam aims to classify genes into families, and to assign a name to each family and significant subfamily. Protein classification databases such as PANTHER (12) and SYSTERS (13) define families according to the degree of similarity between family members. In contrast, TreeFam aims to define a family as a group of genes that descended from a single gene in the ancestor of all animals. This is a more evolutionarily robust definition than one based on a similarity threshold.
MATERIALS AND METHODS
Sequence data
Protein sequences for human, mouse (Mus musculus), rat (Rattus norvegicus), chicken (Gallus gallus), pufferfish (Takifugu rubripes), zebrafish (Danio rerio) and fruitfly (Drosophila melanogaster) were retrieved from Ensembl (3). In addition, we obtained nematode (Caenorhabditis elegans and Caenorhabditis briggsae) proteins from WormBase (14), baker's yeast (Saccharomyces cerevisiae) proteins from SGD (15), fission yeast (Schizosaccharomyces pombe) proteins from GeneDB (16) and thale cress (Arabidopsis thaliana) proteins from TIGR (17). In addition to these fully sequenced species, TreeFam includes UniProt (18) proteins from animal species whose genomes have not been fully sequenced. Where multiple splice forms were available for a gene, all were downloaded, but just one splice form was chosen to represent the gene during the process of building a family (see ‘Constructing Phylogenetic Trees’ below). For TreeFam release 1.1, the Ensembl sequences were downloaded on 27th December 2004, and the other sequences in January 2005.
Definition of gene families
TreeFam aims to define a gene family as a group of genes that descended from a single gene in the last common ancestor of all animals, or that first appeared within the animals. We identify the genes in one family on the basis that either (i) they are phylogenetically separated from other genes by a non-animal outgroup gene either from a yeast (S.cerevisiae or S.pombe) or a plant (Arabidopsis), or (ii) they lack homologs outside the animals.
TreeFam is concerned with families of full-length gene sequences, not domain families as classified e.g. by Pfam (19). The members of a TreeFam gene family may contain segments of sequence that do not align because they have diverged too far, but these segments should not align to other non-family sequences either. There may also be cases where family members differ in the number of copies of a repeated element (20). Finally, there may be members that have incomplete sequences, perhaps because of a gene prediction error. In practice, we handle partial matches by using HMMER (21) full-length match scores as an initial threshold criterion for family membership.
Overall strategy
Like Pfam (19), TreeFam is a two-part database: a first part consisting of automatically generated trees (TreeFam-B) and a second part that consists of manually curated trees (TreeFam-A).
Automatically generating trees for TreeFam-B
Using PhIGs to create TreeFam-B seed families
TreeFam uses clusters of closely related animal and fungal genes from the PhIGs database [http://phigs.org; (22)] as seeds for TreeFam-B families (Figure 1A). Phylogenetically Inferred Groups (PhIGs) is an automatically generated database of gene families inferred to have descended from a single common ancestral gene, created by using the known evolutionary relationships of species. For each node on the species tree, clusters are created such that, using pair-wise protein distances, the genes from the two sister taxa are more similar to each other than they are to the genes from the outgroup taxa. PhIGs currently contains 23 fungal and animal species for which a draft genome is available.
Figure 1.

Flowcharts of TreeFam pipelines. (A) Overall strategy. The seed families for TreeFam-B are taken from PhIGs clusters. They are expanded by a seed-to-full procedure to form full families. Manual curation makes TreeFam-B families become TreeFam-A families, which can also be curated further at a later date. (B) The seed-to-full procedure. This procedure is used to expand seed families to full families. Note that the complete seed-to-full pipeline is only applied when the sequence sets are updated or a whole new genome is added to TreeFam. That is, for a TreeFam-A family created by curation of a TreeFam-B family, the TreeFam-A seed is generated by manual curation, and the full sequences are taken directly from the TreeFam-B family that was curated. (C) Manual curation. Various published resources and in-house tools are utilized in this process.
All the genes in one PhIGs cluster were used as the founding genes in one TreeFam family. To avoid creating families that contained single incorrect gene predictions, a PhIGs cluster had to contain at least three animal and/or fungal genes to be used as the seed for a TreeFam family. About 30% of PhIGs clusters satisfied this criterion.
Expanding seed families to full families using database searches
Each seed family in TreeFam-B is expanded by searching for sequence matches among the animal and outgroup protein datasets (Figure 1B). BLAST (23) is much faster, but less sensitive, than hidden Markov model search procedures such as HMMER (21). Thus, we run BLAST first, to rapidly find an initial list of possible matches. Then we align the seed sequences using Muscle (24), and using the alignment as input, we run HMMER, to select the most probable homologs from the initial list. The sequence matches found by BLAST that are confirmed by HMMER are added to the seed family, thereby creating a full family. Release 1.1 of TreeFam was made using E-value cutoffs of 10−5 for BLAST and 10 for HMMER. Based on our experience of curating families we are considering using a less stringent BLAST cutoff (0.01) to increase the sensitivity of the initial search, and a more stringent HMMER cutoff (0.1) to improve the specificity of the filtering step.
When seed families are expanded to full families, different seed families sometimes have blast/hmmer matches to the same gene. As a result, a gene can appear in more than one TreeFam-B family. However, our goal is that each animal gene should appear in just one TreeFam-A (curated) family. Therefore, when overlapping TreeFam-B trees are curated as described below, we manually split them into two or more non-overlapping families, each with its own tree.
Constructing phylogenetic trees of full TreeFam-B families
After expanding the seed family to a full family, the protein sequences in the family are aligned using Muscle (24). If a gene has several alternative splice forms, we only retain the splice form that aligns best to the other genes in the alignment. The alignment is then filtered to retain only conserved regions, by using CLUSTALX (25) with the BLOSUM62 scoring matrix (26) to calculate a score for each alignment column. The scores are scaled to be in the range 0 to 100, and columns having scores of <15 are removed. The filtered alignment is used as input in the neighbor-joining algorithm (27), and a phylogenetic tree is constructed based on amino acid mismatch distances. The tree is bootstrapped 100 times.
The final step aims to discard sequences that do not belong to a family from its phylogenetic tree, and retain only (i) family members that descended from a single gene in the last common ancestor of animals, and (ii) the most closely related yeast and/or plant outgroup sequences. In an effort to discard homologs that are descendants of a different (paralogous) gene in the last common ancestor of animals, each tree is cut above the last common ancestor of the seed sequences and their closest yeast/plant homolog. The resultant cut trees based on PhIGs clusters form TreeFam-B, the automatically generated portion of TreeFam's trees.
For almost all the PhIGs clusters that were used as seeds, our procedure for cutting trees results in non-animal sequences (if there are any in the alignment) forming an outgroup to the animal sequences, as desired. In the remainder of cases there are internal non-animal sequences, and when the tree is curated it has to be manually split into two or more separate families.
Manually curating TreeFam-B trees
Gathering published information to aid curation
Manual curation is a key feature of TreeFam (Figure 1C). During curation, experts manually correct errors in the automatic trees for TreeFam-B families. To curate a tree, the curator gathers phylogenetic and functional information on the genes in the family from journal articles; from manually curated databases such as UniProt (18), FlyBase (28), WormBase (14) and OMIM (29); and from accepted species taxonomy in the NCBI database (6).
Tools for tree curation
If the phylogenetic tree for a family differs from that expected from functional information, published articles or the accepted species taxonomy, the curator explores the plausibility of alternative tree topologies using a combination of published and in-house tools. For example, the Jalview alignment editor (30) is used to display and edit alignments; and an extended version of the ATV tree viewer (31) is used to display and edit phylogenetic trees. If a curator suspects that a tree is missing genes, BLAST (23) and HMMER (21) are run with non-stringent E-value cutoffs, to search for distant sequence matches.
The in-house tools developed for TreeFam include:
An algorithm that infers the nodes in the tree that correspond to gene duplications or gene losses. This Duplication/Loss Inference algorithm (DLI; H. Li, unpublished data) is based on Zmasek and Eddy's Speciation versus Duplication Inference (SDI) algorithm (9) for inferring gene duplications in a phylogenetic tree. In contrast to SDI, DLI also infers gene losses, and allows for multifurcations in the species tree.
An interactive program for tree curation, tree curation tool (tctool); Lachlan Coin; http://www.sanger.ac.uk/Software/analysis/tctool). This program allows the curator to visually adjust the gene tree topology and recalculate a score which reflects both how well the topology explains the sequence alignment and (optionally) how closely the topology agrees with the species tree. This score is proportional to the log of the maximum (over all possible branch lengths for the gene tree) of the product of two probability terms: the likelihood of the gene tree given the sequence alignment; and a conditional probability of the gene tree given the species tree, which is derived from a probabilistic model of gene duplication and loss. The second term penalizes gene duplication and loss, thereby allowing the curator to trade-off reductions in the number of gene duplications and losses in the tree with decreases in the likelihood term. The curator has the option of curating the tree purely on the basis of the likelihood term, which is equivalent to not penalizing gene duplications or losses. In the scoring step, the curator can allow all branch lengths in the gene tree to be either unconstrained or clock-like; or alternatively can require the gene tree branch lengths to be ‘tied’ to the species tree, while allowing the species tree branch lengths to be either unconstrained or clock-like. To perform the likelihood calculations, tctool provides the curator with the choice of several common nucleotide, codon and amino acid models of evolution.
An alignment viewer that displays the positions of intron–exon boundaries with respect to a multiple alignment of the proteins in a family (H. Li, unpublished data). The fraction of introns that have remained in the same positions in homologous genes can be used a measure of evolutionary distance (32). As a result, intron–exon structure can be useful for distinguishing recently diverged orthologs from ancient paralogs (33).
The DLI algorithm, used for inferring duplication and speciation nodes in the automatic trees of TreeFam-B, estimates the minimal number of duplications and losses that may have occurred. Thus, DLI may overestimate orthology in a small number of gene families. For example, if an ancient duplication event were followed by differential gene loss, DLI would incorrectly classify the duplication node as a speciation. A probabilistic method will be more accurate for predicting duplications and speciations in such families (34). Thus, TreeFam curators use tctool's probabilistic model for predicting duplications and speciations to try to identify hidden duplication nodes in the automatic trees.
An example of tree curation
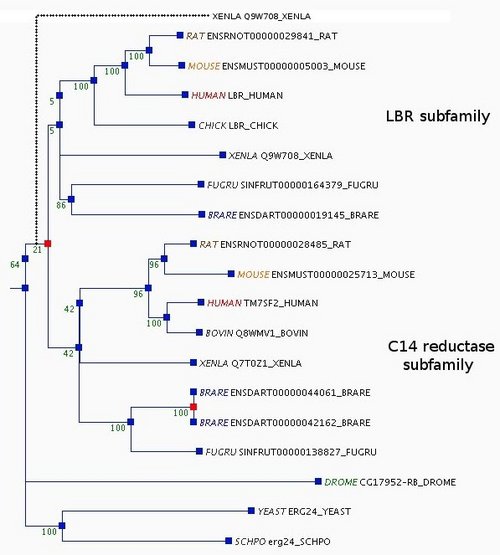
Orthologs typically perform equivalent functions, and paralogs sometimes have acquired new functions, but this is not always true (35). Thus, we take the example of the lamin B receptor/sterol C14 reductase family to explain how we use a combination of phylogenetic analyses and functional information to make decisions during curation.
This family derives from an ancestral sterol C14 reductase, and in vertebrates has split into two subfamilies, one corresponding to the lamin B receptor (LBR), and the other retaining the ancestral sterol C14 reductase function. In the automatic tree there are two Xenopus laevis sequences, one (UniProt Q7T0Z1) grouped with the sterol C14 reductase subfamily and the other (Q9W708) placed near the root of the tree (Supplementary Figure 1). This topology would imply that a gene duplication occurred in the ancestor of all vertebrates, and that one of the duplicates was lost from all vertebrate species present in the tree except for X.laevis. Using tctool, we found that the likelihood of the tree is improved if Q9W708 is moved to either of the two vertebrate subfamilies (the log likelihood of the tree increases from −9417.1 to −9415.1 for either subfamily). From a literature search, we learnt that Q9W708 is recognized as the X.laevis LBR, since it binds chromatin and is localized in the inner nuclear membrane (36), in contrast to the endoplasmic reticulum localization of the proteins in the sterol C14 reductase subfamily (37). In addition, Q9W708 shares a conserved N-terminal extension with the LBR subfamily genes that is absent from the C14 reductase subfamily. Furthermore, placing Q9W708 in the LBR subfamily would require no additional duplications, whereas placing it in the C14 reductase subfamily (with Q7T0Z1) would imply an additional duplication. Therefore, based on both functional knowledge and phylogenetic analyses using tctool, we moved the Xenopus Q9W708 gene to the LBR subfamily.
For more details of the guidelines used for curation, see our FAQ website http://www.treefam.org/cgi-bin/misc_page.pl?faq.
Naming and describing families and subfamilies during tree curation
The curators assign a name and symbol to each TreeFam family, and symbols to obvious subfamilies within a family. If possible, the HGNC name and symbol (38) for the human gene in a family/subfamily are used to name that family/subfamily. The curator also writes a short description of the function of the genes in a family, based on a review of the literature.
Marking nodes as putative or correct during tree curation
Once the curator has finished editing the phylogenetic tree for a family, the curator marks the nodes in the tree that are considered to be probably correct with ‘C’. A node is marked with ‘C’ if the curator is sure that (i) the subtree descending from that node contains every gene that it should contain (among the sequences already in the tree); and (ii) the subtree does not contain any genes that it should not contain; and (iii) the topology of the subtree is completely correct. If the curator has doubts about whether the node is correct, then the node is marked with ‘P’ (putative).
Maintaining TreeFam-A
Making TreeFam-A seed families
When a TreeFam-B tree has been curated, it becomes the seed tree for a TreeFam-A family, and is removed from TreeFam-B (Figure 1A). In this way, TreeFam-A increases in size as TreeFam-B decreases in size.
Expanding TreeFam-A seed families to full families using database searches
Each TreeFam-A seed family is then expanded into a full TreeFam-A family. This is done by (i) temporarily adding back the sequences that were cut from its ancestral TreeFam-B tree; and (ii) if a new gene prediction set has been released since the last build of the TreeFam-A database, either for a TreeFam species or a newly sequenced genome, then BLAST and HMMER are used to identify extra sequence matches in this gene prediction set. These are added to the expanded family.
Constructing phylogenetic trees of full TreeFam-A families
A filtered alignment is made for each TreeFam-A family, as described above for TreeFam-B families. In contrast to TreeFam-B trees, TreeFam-A full trees are built using a constrained version of Saitou and Nei's (27) neighbor-joining algorithm (H. Li, unpublished data). That is, each subtree in the seed tree that was marked as correct (with ‘C’) by curators is forced to appear with the same topology and sequences in the full TreeFam-A tree. For example, if the seed tree contains a subtree [(mouse1, rat1), chicken1] that the curator marked as correct, then the full TreeFam-A tree is forced to contain this subtree. The constrained subtrees can contain extra homologs that were absent from the seed tree but were found by searching new gene prediction sets. Thus, if an extra homolog human1 is found in a new gene prediction set, it can be added to the constrained subtree, giving e.g. {[(mouse1, rat1), human1], chicken1}. The full tree is bootstrapped 100 times, and any sequences that do not belong to the family are discarded to create a cut TreeFam-A tree by a process similar to that described for TreeFam-B, retaining non-animal sequences as the outgroup.
Curating TreeFam-A full families
The full tree of a TreeFam-A family can be curated later when additional knowledge is acquired about the family. When a curator edits a TreeFam-A full tree, the edited tree becomes the seed for a new TreeFam-A family. This new TreeFam-A seed family is treated exactly the same as a TreeFam-A seed that originated from TreeFam-B. That is, the seed is expanded to make a full family; a constrained neighbor-joining tree is built for the full family; and finally the tree is cut, by discarding sequences that do not belong to the family.
Each build of the TreeFam-A database has a release number of the form X.Y, where X is the major release number and Y is the minor release number. The major release number is incremented when some sequence sets are updated or a whole new gene prediction set is added to TreeFam (requiring database searches to expand all TreeFam-A seed families). In contrast, the minor release number is incremented whenever the number of curated TreeFam-A families is judged to have increased significantly. We plan to make a major release of TreeFam-A every 6 months.
TreeFam database content
Release 1.1 of TreeFam contains curated trees for 690 families and automatically generated trees for another 11 646 families. The curated trees in TreeFam-A are currently biased towards gene families involved in mitosis and DNA repair, because TreeFam curators are involved in collaborations to study these processes.
The 12 336 trees represent over 128 000 genes from nine fully sequenced animal genomes and over 45 000 other animal proteins from UniProt. With respect to coverage of fully sequenced animal genomes, TreeFam includes 82% of the 22 207 protein-coding human genes, 80% of the 25 383 mouse genes, 84% of the 22 159 rat genes, 72% of the 17 709 chicken genes, 75% of the 20 796 pufferfish genes, 75% of the 23 524 zebrafish genes and 56% of the 13 792 fruitfly genes in Ensembl, and 50% of the 19 764 genes from the nematode Caenorhabditis elegans and 42% of the 19 528 genes from C.briggsae in WormBase.
Of the trees in TreeFam, 29.8% contain genes from both animals and a yeast/plant outgroup; 1.5% only contain yeast/plant genes; and 68.7% only contain animal genes (of which 54.4% only contain chordate genes, 1.0% only contain arthropod genes and 3.2% only contain nematode genes).
Orthologs and paralogs are inferred from the full trees in both TreeFam-A and TreeFam-B. Table 1 shows the number of orthologs inferred between each pair of animal species that have fully sequenced genomes. There are one-to-one orthology relationships between the genes from the nine fully sequenced animal genomes in just 421 (3.4%) trees. The remaining 11 915 trees lack a gene from one or more of the nine animal genomes, or contain one-to-many and/or many-to-many orthology relationships between these nine animal species.
Table 1.
The number of orthologs between each pair of fully sequenced animal genomes in TreeFam
| Mouse | Rat | Chicken | Zebrafish | Pufferfish | Fruitfly | C. elegans | C. briggsae | |
|---|---|---|---|---|---|---|---|---|
| Human | 16 424 H | 15 572 H | 12 075 H | 11 203 H | 12 089 H | 7878 H | 7349 H | 6977 H |
| 17 401 M | 16 088 R | 10 839 C | 12 815 Z | 11 852 P | 4895 F | 4612 Ce | 4312 Cb | |
| Mouse | 17 782 M | 12 550 M | 12 047 M | 12 642 M | 8063 M | 7520 M | 7120 M | |
| 16 782 R | 10 633 C | 12 593 Z | 11 708 P | 4875 F | 4553 Ce | 4296 Cb | ||
| Rat | 11 784 R | 10 981 R | 11 537 R | 7514 R | 7127 R | 6758 R | ||
| 10 127 C | 12 000 Z | 11 089 P | 4720 F | 4380 Ce | 4118 Cb | |||
| Chicken | 10 876 Z | 10 040 P | 5810 C | 5396 C | 5098 C | |||
| 8225 C | 9081 C | 4338 F | 4281 Ce | 4013 Cb | ||||
| Zebrafish | 10 151 P | 7999 Z | 7844 Z | 7247 Z | ||||
| 12 249 Z | 4305 F | 4137 Ce | 3887 Cb | |||||
| Pufferfish | 7613 P | 7292 P | 6877 P | |||||
| 4781 F | 4519 Ce | 4267 Cb | ||||||
| Fruitfly | 4055 F | 3954 F | ||||||
| 4485 Ce | 4223 Cb | |||||||
| C.elegans | 8126 Ce | |||||||
| 7339 Cb |
For example, 16 424 human genes are orthologous to 17 401 mouse genes. Here H = human, M = mouse, R = rat, C = chicken, Z = zebrafish, P = pufferfish, F = fruitfly, Ce = C.elegans and Cb = C.briggsae.
Using TreeFam
Searching TreeFam
TreeFam is freely available in the UK at http://www.treefam.org and in China at http://treefam.genomics.org.cn. TreeFam allows users to easily search for their genes of interest. First, one can search for accession numbers from the source sequence databases such as Ensembl or WormBase. In addition, TreeFam extracts cross-references to GenBank (6) from Ensembl, so it is possible to search for genes using their GenBank accessions numbers as queries. It is also possible to use text searches to search for a gene name (such as ‘leucyl-tRNA synthetase’); a gene symbol (such as ‘LARS’) or its synonyms (such as ‘LeuRS’; these are taken from UniProt and HGNC); as well as to search the TreeFam functional descriptions of curated families.
The TreeFam webpage for a family
Each family in TreeFam has its own webpage, which contains the TreeFam accession number, symbol and name for that family, as well as a short description of the function of the genes in the family (Figure 2). For example, the TreeFam family with accession no. TF105718 has the symbol ‘LARS’ and name ‘leucyl-tRNA synthetase.’ The description of the function of the genes in this family ‘attaches a leucine to its cognate tRNA isoacceptors. LARS misactivates a diverse group of standard amino acids and metabolic amino acid intermediates, therefore editing is required to ensure fidelity of protein translation [PMID: 12 718 881]’. The description provides a reference (via a PubMed identifier) to the article that it was based upon.
Figure 2.

An example TreeFam webpage, for the Cyclin-E family. In the alignment the position of introns are indicated by highlighting the amino acid to the right of each intron–exon boundary in red.
The webpage for a family also displays the protein sequences in the seed and full trees, as well as multiple alignments of these sequences. The positions of intron–exon boundaries are displayed with respect to these protein alignments. Phylogenetic trees of the seed family and of the full family are provided as clickable image-maps. That is, when the mouse is moved over a gene in the tree, a pop-up box provides a short description of the gene. Furthermore, the user can click on a gene in the tree, and follow the ‘view gene’ link, to go to the webpage for that gene in the source database (e.g. Ensembl).
There are two buttons below the seed and full trees on the webpage for a TreeFam-A family, which display automatic unconstrained neighbor-joining trees based on the same alignment as the curated trees. Branches that differ between the automatic and curated trees are highlighted in red. Thus, by comparing the automatic tree to the curated tree, the user can see what changes curators have made.
The TreeFam webpage for a gene
TreeFam also has a webpage for each individual gene. This is found by searching for the gene name (such as ‘LARS’) or accession no. (such as ‘ENSG00000133706’) on the TreeFam main page. Alternatively, it can be accessed from the webpage for the corresponding family, by clicking on that gene in the image-map of the phylogenetic tree, and following the ‘view ortholog’ link.
The gene page provides a list of the animal and yeast/plant orthologs of that gene that were inferred from the phylogenetic tree for the full family. A support value is given for each pair of orthologs, which is the frequency at which that particular orthology assignment was observed among a set of 100 bootstrap trees (39,40). If a particular gene is present in more than one TreeFam family, we report the orthologs that are inferred for this gene from the phylogenetic trees of each of the families. In addition to the orthologs inferred by TreeFam, for comparison of the orthologs inferred by Ensembl-Compara (3) are also displayed, and there is a link to the Inparanoid (2) webpage for the gene.
Downloading TreeFam data
All the data for TreeFam 1.1 can be freely downloaded from ftp://ftp.sanger.ac.uk/pub/treefam. This includes DNA and protein sequences; multiple alignments and phylogenetic trees of families; and a list of orthologs inferred from TreeFam-A and TreeFam-B full trees.
DISCUSSION AND FUTURE PLANS
Testing the accuracy of curated trees
It is difficult to test whether manual editing improves the accuracy of curated trees relative to automatic trees, because we use all available information about a gene family during curation. However, our analysis indicates that the trees we choose for manual editing are biased towards trees based on poor quality data. We found that compared to the 297 curated seed trees in TreeFam-A that curators considered to not require editing, the 393 seed trees whose topology was edited by curators were based on poorer quality data. That is, the filtered alignments had 1.2-fold fewer variable sites (278 versus 347 sites; Wilcoxon test: P = 0.001), and were 1.5 times more likely to contain a truncated gene prediction (26% versus 17%; Fisher's test: P = 0.007). Here we considered a gene prediction to be truncated if it covered <50% of the alignment columns having at least two sequences. Tree reconstruction algorithms often produce incorrect trees when the input data is of low quality (11), so the observation that we select those trees that are based on poorer quality data for editing suggests that we choose to edit the automatic trees that are most likely to be incorrect.
Improving methods of building and curating trees, and identifying orthologs
Tree curation is time-consuming and difficult, especially for large gene families of dozens of genes. In the future, we plan to support external curation, in order to involve biologists in curating families that they are interested in. In addition, to accelerate curation, we plan to identify the major sources of artifacts in automatic trees (e.g. sampling error, gene prediction errors), and to refine our tree-building process so that the automatic trees are more accurate. For example, we intend to explore the use of DNA level similarity (synonymous substitutions) for building phylogenetic trees of closely related gene families or subfamilies.
To improve ortholog identification, we plan to use synteny information to help distinguish orthologs from paralogs, as well as to aid identification of distantly related gene family members.
Dealing with families with complex evolutionary histories
If the data are ambiguous, our curation principles assume that the evolutionary history of the genes in a family is likely to mirror the species tree. We believe this is reasonable in the absence of other data. However, we are aware that there are many real reasons why a gene family could have a different tree than the species tree, such as lateral gene transfer or gene conversion. Lateral gene transfer has probably affected few families, as it is rare in eukaryotes (41). In contrast, gene conversion may have affected the topologies of some trees, but is difficult to distinguish from recent gene duplication (42).
Ancestral polymorphism can also cause a gene tree to differ from the species tree, but this is only likely to occur if the interval between two subsequent speciation events was just a few million years (43). The closest speciation events for animals with fully sequenced genomes in TreeFam are the primate-rodent and mouse-rat speciations, but these occurred so far apart in time (∼50 My) that incomplete lineage sorting is highly unlikely. However, as TreeFam's taxon sampling improves in the future, e.g. by adding the chimpanzee and gorilla genomes, we expect to see a considerable number of conflicts between gene and species trees caused by ancestral polymorphisms (44). We plan to flag cases where this seems a likely explanation of the data.
Another challenge for TreeFam will be to deal with gene families that have histories involving chromosomal rearrangements such as domain shuffling, gene fusion or fission, intragenic rearrangement or acquisition of novel coding sequence from non-coding DNA (20). In such a family, some regions of coding sequence may be present in all members but other regions may only be found in a subset of members. Furthermore, chunks of sequence may have a different order or copy number in different family members. As a result, different genes in the family will have different evolutionary histories, as will different parts of some individual genes. To trace the history of the members of such a family, it may be necessary to construct separate phylogenetic trees for different regions of the members' genes, e.g. for each Pfam domain found in the family (45).
Identifying eukaryotic gene families
TreeFam contains many related animal gene families that arose due to ancient duplication events that occurred before the origin of animals. For example, the last common ancestor of animals possessed many different but related kinase genes, the descendants of each of which forms a different TreeFam kinase gene family. A future direction will be to cluster such related animal families into eukaryotic gene families.
Annotating new genomes
In addition to further chordates, arthropods and nematodes, whole-genome sequencing projects are ongoing or planned for representatives of eight more animal phyla over the next two years, i.e. the first whole-genome sequences from the Placozoa, Porifera, Cnidaria, Mollusca, Platyhelminthes, Hemichordata, Annelida and Echinodermata (46). The current capability of TreeFam to provide phylogenetic trees of gene families and infer orthologs will prove useful in understanding the evolution of these phyla. In addition, one of the long-term goals of TreeFam is to assist in gene annotation when a new animal genome is sequenced. For example, TreeFam could be used to identify orthologs of these newly sequenced animal phyla in previously sequenced genomes, and comparisons between these orthologs could be used to improve gene predictions for the new genomes. We plan to design easy-to-use pipelines and web services to facilitate this task.
SUPPLEMENTARY DATA
Supplementary Data are available at NAR Online.
Supplementary Material
Acknowledgments
This project is supported by The Wellcome Trust, the Chinese Academy of Science (GJHZ0518; 90403130; 2004AA231050), the National Natural Science Foundation of China (90403110; 30200163; 90208019), reannotation of the Arabidopsis genome: methods, tools, protocols and the Danish Basic Research Fund (Danish Platform for Integrative Biology). Jean-Karim Hériché is supported by the European Union Integrated Project MitoCheck (LSHG-CT-2004-503464). P.D. is supported by the U.S. Department of Energy, Office of Biological and Environmental Research, by the University of California, Lawrence Berkeley National Laboratory, under contract no. DE-AC03-76SF00098. We are grateful to two anonymous referees for their helpful comments. Funding to pay the Open Access publication charges for this article was provided by The Wellcome Trust.
Conflict of interest statement. None declared.
REFERENCES
- 1.Fitch W.M. Distinguishing homologous from analogous proteins. Syst. Zool. 1970;19:99–113. [PubMed] [Google Scholar]
- 2.O'Brien K.P., Remm M., Sonnhammer E.L. Inparanoid: a comprehensive database of eukaryotic orthologs. Nucleic Acids Res. 2005;33:D476–D480. doi: 10.1093/nar/gki107. [DOI] [PMC free article] [PubMed] [Google Scholar]
- 3.Hubbard T., Andrews D., Caccamo M., Cameron G., Chen Y., Clamp M., Clarke L., Coates G., Cox T., Cunningham F., et al. Ensembl 2005. Nucleic Acids Res. 2005;33:D447–D453. doi: 10.1093/nar/gki138. [DOI] [PMC free article] [PubMed] [Google Scholar]
- 4.Tatusov R.L., Fedorova N.D., Jackson J.D., Jacobs A.R., Kiryutin B., Koonin E.V., Krylov D.M., Mazumder R., Mekhedov S.L., Nikolskaya A.N., et al. The COG database: an updated version includes eukaryotes. BMC Bioinformatics. 2003;4:41. doi: 10.1186/1471-2105-4-41. [DOI] [PMC free article] [PubMed] [Google Scholar]
- 5.Li L., Stoeckert C.J., Jr, Roos D.S. OrthoMCL: identification of ortholog groups for eukaryotic genomes. Genome Res. 2003;13:2178–2189. doi: 10.1101/gr.1224503. [DOI] [PMC free article] [PubMed] [Google Scholar]
- 6.Wheeler D.L., Barrett T., Benson D.A., Bryant S.H., Canese K., Church D.M., DiCuccio M., Edgar R., Federhen S., Helmberg W., et al. Database resources of the National Center for Biotechnology Information. Nucleic Acids Res. 2005;33:D39–D45. doi: 10.1093/nar/gki062. [DOI] [PMC free article] [PubMed] [Google Scholar]
- 7.Rodríguez-Trelles F., Tarrío R., Ayala F.J. Erratic overdispersion of three molecular clocks: GPDH, SOD, and XDH. Proc. Natl Acad. Sci. USA. 2001;98:11405–11410. doi: 10.1073/pnas.201392198. [DOI] [PMC free article] [PubMed] [Google Scholar]
- 8.Eisen J.A. Phylogenomics: improving functional predictions for uncharacterized genes by evolutionary analysis. Genome Res. 1998;8:163–167. doi: 10.1101/gr.8.3.163. [DOI] [PubMed] [Google Scholar]
- 9.Zmasek C.M., Eddy S.R. A simple algorithm to infer gene duplication and speciation events on a gene tree. Bioinformatics. 2001;17:821–828. doi: 10.1093/bioinformatics/17.9.821. [DOI] [PubMed] [Google Scholar]
- 10.Dufayard J.F., Duret L., Penel S., Gouy M., Rechenmann F., Perrière G. Tree pattern matching in phylogenetic trees: automatic search for orthologs or paralogs in homologous gene sequence databases. Bioinformatics. 2005;21:2596–2603. doi: 10.1093/bioinformatics/bti325. [DOI] [PubMed] [Google Scholar]
- 11.Delsuc F., Brinkmann H., Philippe H. Phylogenomics and the reconstruction of the tree of life. Nature Rev. Genet. 2005;6:361–375. doi: 10.1038/nrg1603. [DOI] [PubMed] [Google Scholar]
- 12.Mi H., Lazareva-Ulitsky B., Loo R., Kejariwal A., Vandergriff J., Rabkin S., Guo N., Muruganujan A., Doremieux O., Campbell M.J., et al. The PANTHER database of protein families, subfamilies, functions and pathways. Nucleic Acids Res. 2005;33:D284–D288. doi: 10.1093/nar/gki078. [DOI] [PMC free article] [PubMed] [Google Scholar]
- 13.Meinel T., Krause A., Luz H., Vingron M., Staub E. The SYSTERS Protein Family Database in 2005. Nucleic Acids Res. 2005;33:D226–D229. doi: 10.1093/nar/gki030. [DOI] [PMC free article] [PubMed] [Google Scholar]
- 14.Chen N., Harris T.W., Antoshechkin I., Bastiani C., Bieri T., Blasiar D., Bradnam K., Canaran P., Chan J., Chen C.K., et al. WormBase: a comprehensive data resource for Caenorhabditis biology and genomics. Nucleic Acids Res. 2005;33:D383–D389. doi: 10.1093/nar/gki066. [DOI] [PMC free article] [PubMed] [Google Scholar]
- 15.Balakrishnan R., Christie K.R., Costanzo M.C., Dolinski K., Dwight S.S., Engel S.R., Fisk D.G., Hirschman J.E., Hong E.L., Nash R., et al. Fungal BLAST and Model Organism BLASTP Best Hits: new comparison resources at the Saccharomyces Genome Database (SGD) Nucleic Acids Res. 2005;33:D374–D377. doi: 10.1093/nar/gki023. [DOI] [PMC free article] [PubMed] [Google Scholar]
- 16.Hertz-Fowler C., Peacock C.S., Wood V., Aslett M., Kerhornou A., Mooney P., Tivey A., Berriman M., Hall N., Rutherford K., et al. GeneDB: a resource for prokaryotic and eukaryotic organisms. Nucleic Acids Res. 2004;32:D339–D343. doi: 10.1093/nar/gkh007. [DOI] [PMC free article] [PubMed] [Google Scholar]
- 17.Haas B.J., Wortman J.R., Ronning C.M., Hannick L.I., Smith R.K., Jr, Maiti R., Chan A.P., Yu C., Farzad M., Wu D., et al. Complete reannotation of the Arabidopsis genome: methods, tools, protocols and the final release. BMC Biol. 2005;3:7. doi: 10.1186/1741-7007-3-7. [DOI] [PMC free article] [PubMed] [Google Scholar]
- 18.Bairoch A., Apweiler R., Wu C.H., Barker W.C., Boeckmann B., Ferro S., Gasteiger E., Huang H., Lopez R., Magrane M., et al. The Universal Protein Resource (UniProt) Nucleic Acids Res. 2005;33:D154–D159. doi: 10.1093/nar/gki070. [DOI] [PMC free article] [PubMed] [Google Scholar]
- 19.Bateman A., Coin L., Durbin R., Finn R.D., Hollich V., Griffiths-Jones S., Khanna A., Marshall M., Moxon S., Sonnhammer E.L., et al. The Pfam protein families database. Nucleic Acids Res. 2004;32:D138–D141. doi: 10.1093/nar/gkh121. [DOI] [PMC free article] [PubMed] [Google Scholar]
- 20.Henikoff S., Greene E.A., Pietrokovski S., Bork P., Attwood T.K., Hood L. Gene families: the taxonomy of protein paralogs and chimeras. Science. 1997;278:609–614. doi: 10.1126/science.278.5338.609. [DOI] [PubMed] [Google Scholar]
- 21.Eddy S.R. Profile hidden Markov models. Bioinformatics. 1998;14:755–763. doi: 10.1093/bioinformatics/14.9.755. [DOI] [PubMed] [Google Scholar]
- 22.Dehal P., Boore J.L. Two rounds of whole genome duplication in the ancestral vertebrate. PLoS Biol. 2005;3:e314. doi: 10.1371/journal.pbio.0030314. [DOI] [PMC free article] [PubMed] [Google Scholar]
- 23.Altschul S.F., Madden T.L., Schäffer A.A., Zhang J., Zhang Z., Miller W., Lipman D.J. Gapped BLAST and PSI-BLAST: a new generation of protein database search programs. Nucleic Acids Res. 1997;25:3389–3402. doi: 10.1093/nar/25.17.3389. [DOI] [PMC free article] [PubMed] [Google Scholar]
- 24.Edgar R.C. MUSCLE: a multiple sequence alignment method with reduced time and space complexity. BMC Bioinformatics. 2004;5:113. doi: 10.1186/1471-2105-5-113. [DOI] [PMC free article] [PubMed] [Google Scholar]
- 25.Thompson J.D., Gibson T.J., Plewniak F., Jeanmougin F., Higgins D.G. The CLUSTAL_X windows interface: flexible strategies for multiple sequence alignment aided by quality analysis tools. Nucleic Acids Res. 1997;25:4876–4882. doi: 10.1093/nar/25.24.4876. [DOI] [PMC free article] [PubMed] [Google Scholar]
- 26.Henikoff S., Henikoff J.G. Amino acid substitution matrices from protein blocks. Proc. Natl Acad. Sci. USA. 1992;89:10915–10919. doi: 10.1073/pnas.89.22.10915. [DOI] [PMC free article] [PubMed] [Google Scholar]
- 27.Saitou N., Nei M. The neighbor-joining method: a new method for reconstructing phylogenetic trees. Mol. Biol. Evol. 1987;4:406–425. doi: 10.1093/oxfordjournals.molbev.a040454. [DOI] [PubMed] [Google Scholar]
- 28.Drysdale R.A., Crosby M.A., Consortium F. FlyBase: genes and gene models. Nucleic Acids Res. 2005;33:D390–395. doi: 10.1093/nar/gki046. [DOI] [PMC free article] [PubMed] [Google Scholar]
- 29.Hamosh A., Scott A.F., Amberger J.S., Bocchini C.A., McKusick V.A. Online Mendelian Inheritance in Man (OMIM), a knowledgebase of human genes and genetic disorders. Nucleic Acids Res. 2005;33:D514–D517. doi: 10.1093/nar/gki033. [DOI] [PMC free article] [PubMed] [Google Scholar]
- 30.Clamp M., Cuff J., Searle S.M., Barton G.J. The Jalview Java alignment editor. Bioinformatics. 2004;20:426–427. doi: 10.1093/bioinformatics/btg430. [DOI] [PubMed] [Google Scholar]
- 31.Zmasek C.M., Eddy S.R. ATV: display and manipulation of annotated phylogenetic trees. Bioinformatics. 2001;17:383–384. doi: 10.1093/bioinformatics/17.4.383. [DOI] [PubMed] [Google Scholar]
- 32.Zdobnov E.M., von Mering C., Letunic I., Bork P. Consistency of genome-based methods in measuring metazoan evolution. FEBS Lett. 2005;579:3355–3361. doi: 10.1016/j.febslet.2005.04.006. [DOI] [PubMed] [Google Scholar]
- 33.Franck E., Madsen O., van Rheede T., Ricard G., Huynen M.A., de Jong W.W. Evolutionary diversity of vertebrate small heat shock proteins. J. Mol. Evol. 2004;59:792–805. doi: 10.1007/s00239-004-0013-z. [DOI] [PubMed] [Google Scholar]
- 34.Arvestad L., Berglund A.C., Lagergren J., Sennblad B. Bayesian gene/species tree reconciliation and orthology analysis using MCMC. Bioinformatics. 2003;19:i7–i15. doi: 10.1093/bioinformatics/btg1000. [DOI] [PubMed] [Google Scholar]
- 35.Koonin E.V. Orthologs, paralogs, and evolutionary genomics. Annu. Rev. Genet. 2005;39:309–338. doi: 10.1146/annurev.genet.39.073003.114725. [DOI] [PubMed] [Google Scholar]
- 36.Gajewski A., Krohne G. Subcellular distribution of the Xenopus p58/lamin B receptor in oocytes and eggs. J. Cell. Sci. 1999;112:2583–2596. doi: 10.1242/jcs.112.15.2583. [DOI] [PubMed] [Google Scholar]
- 37.Holmer L., Pezhman A., Worman H.J. The human lamin B receptor/sterol reductase multigene family. Genomics. 1998;54:469–476. doi: 10.1006/geno.1998.5615. [DOI] [PubMed] [Google Scholar]
- 38.Wain H.M., Lush M.J., Ducluzeau F., Khodiyar V.K., Povey S. Genew: the Human Gene Nomenclature Database, 2004 updates. Nucleic Acids Res. 2004;32:D255–D257. doi: 10.1093/nar/gkh072. [DOI] [PMC free article] [PubMed] [Google Scholar]
- 39.Zmasek C.M., Eddy S.R. RIO: analyzing proteomes by automated phylogenomics using resampled inference of orthologs. BMC Bioinformatics. 2002;3:14. doi: 10.1186/1471-2105-3-14. [DOI] [PMC free article] [PubMed] [Google Scholar]
- 40.Storm C.E., Sonnhammer E.L. Automated ortholog inference from phylogenetic trees and calculation of orthology reliability. Bioinformatics. 2002;18:92–99. doi: 10.1093/bioinformatics/18.1.92. [DOI] [PubMed] [Google Scholar]
- 41.Scholl E.H., Thorne J.L., McCarter J.P., Bird D.M. Horizontally transferred genes in plant-parasitic nematodes: a high-throughput genomic approach. Genome Biol. 2003;4:R39. doi: 10.1186/gb-2003-4-6-r39. [DOI] [PMC free article] [PubMed] [Google Scholar]
- 42.Rooney A.P., Piontkivska H., Nei M. Molecular evolution of the nontandemly repeated genes of the histone 3 multigene family. Mol. Biol. Evol. 2002;19:68–75. doi: 10.1093/oxfordjournals.molbev.a003983. [DOI] [PubMed] [Google Scholar]
- 43.Pamilo P., Nei M. Relationships between gene trees and species trees. Mol. Biol. Evol. 1988;5:568–583. doi: 10.1093/oxfordjournals.molbev.a040517. [DOI] [PubMed] [Google Scholar]
- 44.Chen F.C., Li W.H. Genomic divergences between humans and other hominoids and the effective population size of the common ancestor of humans and chimpanzees. Am. J. Hum. Genet. 2001;68:444–456. doi: 10.1086/318206. [DOI] [PMC free article] [PubMed] [Google Scholar]
- 45.Storm C.E., Sonnhammer E.L. Comprehensive analysis of orthologous protein domains using the HOPS database. Genome Res. 2003;13:2353–2362. doi: 10.1101/gr1305203. [DOI] [PMC free article] [PubMed] [Google Scholar]
- 46.Bernal A., Ear U., Kyrpides N. Genomes OnLine Database (GOLD): a monitor of genome projects world-wide. Nucleic Acids Res. 2001;29:126–127. doi: 10.1093/nar/29.1.126. [DOI] [PMC free article] [PubMed] [Google Scholar]
Associated Data
This section collects any data citations, data availability statements, or supplementary materials included in this article.