

Abstract
Ghrelin is a newly discovered peptide and an endogenous ligand for growth hormone (GH) secretagogue (GHS) receptor. It has been shown to possess various central and peripheral effects, including GH secretion, food intake, and gastric and cardiac effects. Ghrelin and the GHS receptor are expressed also in pancreatic islets. We have identified several ghrelin-induced genes by PCR-select subtraction methods, among which is a β-cell autoantigen for type 1 diabetes, IA-2β. Administration of ghrelin increased IA-2β mRNA in mouse brain, pancreas, and insulinoma cell lines (MIN6 and βTC3). However, the expression of IA-2, another structurally related β-cell autoantigen, was not induced by ghrelin. Administration of ghrelin or overexpression of IA-2β, but not overexpression of IA-2, inhibited glucose-stimulated insulin secretion in MIN6 insulinoma cells and, moreover, inhibition of IA-2β expression by the RNA interference technique ameliorated ghrelin's inhibitory effects on glucose-stimulated insulin secretion. These findings strongly suggest that inhibitory effects of ghrelin on glucose-stimulated insulin secretion are at least partly due to increased expression of IA-2β induced by ghrelin. Our data demonstrate the link among ghrelin, IA-2β, and glucose-stimulated insulin secretion.
Keywords: protein tyrosine phosphatase, secretary granule
Ghrelin is a newly discovered acylated 28 amino acid peptide from stomach (1) and an endogenous ligand for growth hormone (GH) secretagogue (GHS) receptor (2). Ghrelin has been shown to possess various central and peripheral effects and potently stimulates GH release through GHS receptors in pituitary somatotrophs (1). Ghrelin enhances food intake; induces obesity; and affects gastric acid secretion, gastric motility, blood pressure, and cardiac output (3–6), and is mainly produced in A-like cells in the stomach (7). However, ghrelin and GHS receptors are not restricted to the stomach and hypothalamuspituitary (8) and are expressed also in pancreatic islets (9–10). Ghrelin has been reported to inhibit insulin secretion (11–14), although there are some reports indicating otherwise (9, 15).
To investigate downstream target genes of ghrelin, we have identified several ghrelin-induced genes by PCR-select subtraction method (data not shown). One of them is a β-cell autoantigen for type 1 diabetes, IA-2β, also called phogrin, IAR, PTP-NP, or ICAAR, which is an integral membrane glycoprotein that is widely expressed among neuroendocrine tissues, where it localizes to secretory granules (16–20). IA-2β is a member of the receptor-type protein tyrosine phosphatase family. However, its phosphatase activity may not be active, because of the substitution of a highly conserved residue Alanine to Aspartate. IA-2β is closely related to another islet cell autoantigen and secretory granule protein, IA-2 (21–22), which shares a similar domain structure and exhibits 43% amino acid sequence identity overall and 73% in cytoplasmic region. So far, no ligands for these receptor-type protein tyrosine phosphatases have been identified, and their biological function remains unknown. Homologues of IA-2 and IA-2β with inactive phosphatase domains have been described in species including Caenorhabditis elegans, Drosophila, and Zebrafish, indicating a high degree of conservation of this protein family (23). Therefore, these proteins should have important functions. Because both IA-2 and IA-2β are localized in secretory granules of islet cells or neuroendocrine cells, they may function as a part of the secretory machinery. Ghrelin has been reported to inhibit insulin secretion, and we have demonstrated that it induces the expression of IA-2β in brain, pancreas, and β-cell lines. Therefore, we have investigated a possible link among ghrelin, IA-2β, and insulin secretion in this study.
Results
Identification of Ghrelin-Induced Genes. To identify genes induced by ghrelin, mice at age 7–8 weeks were subjected to i.p. injections of ghrelin, at various doses, or saline as a control. In preliminary experiments, we confirmed the effective function of ghrelin at a dose used in this study (10 μg per mouse) by measuring its effects on food consumption (saline, 0.33 ± 0.04 g/h; ghrelin, 0.48 ± 0.04 g/h; n = 4, P < 0.05 with Student's t test). Poly(A)+ mRNA were prepared from mice brain and pancreas after injection of ghrelin or saline for 15 min and used for PCR-selected subtraction analysis. We picked up and investigated >110 clones induced by ghrelin from brain and pancreas, respectively. Several candidate cDNAs, including IA-2β, were detected. IA-2β, identified as one of the ghrelin-induced genes from brain, had been reported to be an autoantigen for type 1 diabetes (16–20). To confirm the effect of ghrelin on IA-2β mRNA expression, we performed Northern blot analysis. Administration of ghrelin increased IA-2β mRNA in mouse brain and pancreas (Fig. 1A). More than 1.6-fold increases of IA-2β expression were verified by QT-PCR analysis by using IA-2β-specific probes (Fig. 1B). Because IA-2β is closely related to IA-2, another islet cell autoantigen, we also determined IA-2 mRNA levels by QT-PCR. In contrast to results for IA-2β, IA-2 mRNA was not induced by ghrelin (Fig. 1C).
Fig. 1.

Effect of ghrelin on IA-2β and IA-2 expression in vivo. (A) Northern blot analysis for IA-2β mRNA from brain and pancreas of mice injected saline or 10 μg per mouse of ghrelin i.p. We loaded 2 μg of poly(A)+ mRNA in each lane. (B and C) cDNA prepared from mice injected with saline (□) or ghrelin (▪) for 15 min were subjected to QT-PCR analysis for IA-2β (B) or IA-2 (C) expression. Data of mRNA expression quantified by QT-PCR are expressed as fold stimulation relative to the values observed with mice that were stimulated by saline. All values are expressed as the means ± SDs of three independent experiments (n = 6–12, **, P < 0.01 vs. saline).
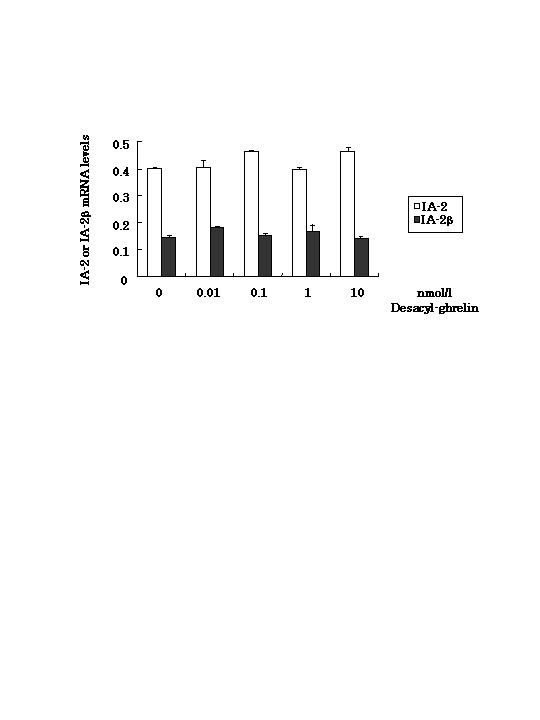
Effect of Ghrelin on IA-2β or IA-2 mRNA and Protein Levels in Insulinoma Cell Lines. Ghrelin may induce the expression of IA-2β via GH secreted from pituitary by ghrelin stimulation. To eliminate this possibility and to confirm the direct effect of ghrelin, we examined whether ghrelin induces IA-2β expression in the cultured insulinoma cell line (MIN6 cells). Incubation of cultured MIN6 cells with increasing doses of ghrelin for 30 min showed that ghrelin induced IA-2β expression at concentrations above 0.1 nmol/liter (Fig. 2A). In contrast to the results for IA-2β, levels of IA-2 mRNA in MIN6 cells were not affected by ghrelin stimulation at any concentration tested (0.01–10 nmol/liter) (Fig. 2A). We also confirmed that ghrelin induced IA-2β protein expression by Western blot analysis dose dependently (Fig. 2C). In addition, cells were incubated with 1 nmol/liter ghrelin for different times (15–120 min). IA-2β mRNA levels were increased at every time point compared with nonstimulation, whereas ghrelin had no influence on IA-2 levels (Fig. 2B). The protein levels of IA-2β started to increase around 15–30 min after stimulation by ghrelin (Fig. 2C). In MIN6 cells, ghrelin stimulated IA-2β mRNA levels with maximal effects after 30-min incubation at 1 nmol/liter ghrelin. Stimulatory effects of ghrelin on IA-2β expression were also observed in another insulinoma cell line, βTC3 cells (data not shown).
Fig. 2.

Effect of ghrelin on IA-2β expression in MIN6 cells. (A) IA-2 (□) and IA-2β (▪) mRNA expression levels of MIN6 incubated with 0.01, 0.1, 1, or 10 nmol/liter or without ghrelin for 30 min. (B) IA-2 (□) and IA-2β (▪) mRNA expression levels of MIN6 incubated with 1 nmol/liter ghrelin for the indicated times. Data of mRNA expression quantified by QT-PCR are expressed as fold increase relative to the values observed with cells that were nonstimulated by ghrelin. All values are expressed as the means ± SDs of three independent experiments (n = 6–12, *, P < 0.05; **, P < 0.01 vs. nonstimulation with ghrelin). (C)(Upper) IA-2β protein expression levels of MIN6 incubated with 1 nmol/liter ghrelin for indicated times. (Lower) IA-2β protein expression levels of MIN6 incubated with 0.01, 0.1, and 1.0 nmol/liter or without ghrelin for 30 min.
Effect of Ghrelin on Insulin Secretion from MIN6 Cells. Ghrelin has been reported to affect insulin secretion (9, 11–15). We therefore studied the influence of ghrelin on insulin secretion in MIN6 cells. After stabilization of basal insulin secretion by preincubation for 30 min in KRBH with 5 mmol/liter glucose, MIN6 cells were incubated with 3.3, 5.5, 8.3, 11.1, or 22.2 mmol/liter of glucose for 60 min, and insulin secretion into the medium was measured. Insulin secretion was increased dose-dependently (3.3 mmol/liter, 299 ± 79 pmol/liter; 5.5 mmol/liter, 365 ± 10 pmol/liter; 8.3 mmol/liter, 995 ± 2 pmol/liter; 11.1 mmol/liter, 2686 ± 53 pmol/liter; 22.2 mmol/liter, 3,530 ± 316 pmol/liter, respectively), and these increased secretions induced by high glucose were significantly decreased by the presence of 1 or 10 nmol/liter ghrelin, not 0.1 nmol/liter (Fig. 3A).
Fig. 3.

Effect of ghrelin on glucose-stimulated insulin secretion from MIN6 cells. (A) Medium insulin concentration after 60-min incubation of MIN6 in the presence of 3.3 (□) or 22.2 (▪) mmol/liter glucose with 0.1, 1, or 10 nmol/liter or without ghrelin. Insulin concentration was measured by ELISA. All values are expressed as the means ± SDs of three independent experiments (n = 9–15, *, P < 0.05 vs. nonstimulation with ghrelin at 22.2 mmol/liter glucose). (B) Insulin secretion with 3.3 (□) or 22.2 (▪) mmol/liter glucose containing with 10 nmol/liter or without ghrelin for the indicated times. Results are expressed as the means ± SDs of three independent experiments (n = 5–7; *, P < 0.05; **, P < 0.01 vs. nonstimulation with ghrelin at same times).
Increased insulin secretion induced by 22.2 mmol/liter glucose and the inhibitory effects of 10 nmol/liter ghrelin were evident after 15 min of stimulation; similar effects of ghrelin on insulin secretion were also observed at 30 or 60 min (Fig. 3B). On the other hand, basal insulin secretion tended to be increased by 10 nmol/liter ghrelin at 3.3 mmol/liter glucose (Fig. 3B).
Effect of Ghrelin on Insulin Biosynthesis in MIN6 Cells. To investigate the effects of ghrelin on insulin biosynthesis, levels of insulin mRNA and insulin protein content in cell lysates, after collecting medium for secretion analysis, were analyzed. Lysate insulin contents were slightly decreased by ghrelin stimulation at 22.2 mmol/liter glucose for 60 min (Fig. 4A). We measured insulin mRNA levels from cells incubated with or without ghrelin but did not find any differences (Fig. 4B).
Fig. 4.

Effect of ghrelin on insulin content in MIN6 cells. (A) Cellular insulin concentration after 60-min incubation of MIN6 in the presence of 3.3 (□) or 22.2 (▪) mmol/liter glucose with 0.1, 1, 10 nmol/liter or without ghrelin. Cells were lysed with lysis buffer, and cellular insulin contents were assayed by ELISA and normalized by protein content of the lysate. (B) Insulin mRNA expression levels of MIN6 incubated with 0.01, 0.1, 1, or 10 nmol/liter or without ghrelin for 30 min. Data are expressed as fold increase relative to the values observed with nonstimulation. All values are expressed as the means ± SDs of three independent experiments (n = 6–12; *, P < 0.05 vs. nonstimulation with ghrelin).
Effects of Overexpression of IA-2β on Insulin Secretion. It has been reported that IA-2β is localized to insulin secretory granules in pancreatic β-cells (16). To investigate the effects of IA-2β on insulin secretion and synthesis, MIN6 cells stably overexpressing IA-2β or IA-2 were established. In preliminary experiments, we confirmed an ≈2.5-fold increase of either IA-2 or IA-2β mRNAs, as quantified by QT-PCR, respectively (Fig. 7, which is published as supporting information on the PNAS web site). Overexpression of IA-2 did not affect endogenous expression of IA-2β, and vice versa. Stable overexpression of IA-2β but not of IA-2 inhibited glucose-stimulated insulin secretion in MIN6 cells when performed in medium containing 11.1 or 22.2 mmol/liter glucose (Fig. 5A). Increased insulin secretion induced by 22.2 mmol/liter glucose was inhibited by the presence of 1 or 10 nmol/liter ghrelin even in MIN6 cells overexpressed for IA-2 (Fig. 5B). This inhibitory effect on insulin secretion seemed to be similar in some degree to the effect of overexpressing IA-2β, suggesting that ghrelin affects only IA-2β, and not IA-2, function. We did not observe any significant change in insulin content in the cell lysates or in insulin mRNA expression, at least in these cultured β-cells overexpressing either IA-2 or IA-2β (data not shown).
Fig. 5.

Effect of overexpression of IA-2β and IA-2 on insulin secretion. (A) Effects of exogenously overexpressed IA-2, IA-2β, or control vector in MIN6 cells on glucose-stimulated insulin secretion. These cells prepared as described in Materials and Methods were stimulated by glucose indicating concentrations (3.3, 5.5, 8.3, 11.1, or 22.2 mmol/liter) for 60 min. Results are expressed as the means ± SDs of three independent experiments (n = 5–8; **, P < 0.01 vs. control cells stimulated with glucose at same dose). (B) Medium insulin concentration after 60-min incubation in the presence of 3.3 (□) or 22.2 (▪) mmol/liter glucose with 1 or 10 nmol/liter or without ghrelin. Results are expressed as the means ± SDs of three independent experiments (n = 9–12; *, P < 0.05; **, P < 0.01 vs. nonstimulation with ghrelin in each cells).
Effects of siRNA for IA-2β on Insulin Secretion. The influence of the suppression of IA-2β expression on insulin secretion was studied by using the RNAi technique. IA-2β mRNA and protein levels were suppressed by using transfection with siRNA of IA-2β (Fig. 8 A and B, which is published as supporting information on the PNAS web site). Glucose-stimulated insulin secretion from MIN6 cells transfected with control siRNA was decreased by ghrelin stimulation (Fig. 6A). In MIN6 cells with suppressed endogenous IA-2β mRNA levels by treatment with IA-2β siRNA, glucose-stimulated insulin secretion was increased, compared with control siRNA-treated cells (Fig. 6A). We also examined the effect of suppression of IA-2β in MIN6 cells overexpressing IA-2 or IA-2β exogenously. Glucose-stimulated insulin secretion was decreased by stimulation of ghrelin or overexpression of IA-2β, and these inhibitory effects were blocked by transfection of IA-2β siRNA (Fig. 6B). Inhibition of IA-2β expression by siRNA ameliorated ghrelin's inhibitory effects on glucose-stimulated insulin secretion.
Fig. 6.

Effect of suppression of IA-2β expression on insulin secretion. (A) Effects of suppression of endogenous IA-2β in MIN6 cells on inhibitory effect of ghrelin on glucose-stimulated insulin secretion. MIN6 cells transfected with control siRNA or IA-2β siRNA for 24 h were prepared as described in Materials and Methods.. Medium insulin concentration after 60 min incubation in the presence of 3.3 or 22.2 mmol/liter glucose with 0.1, 1, or 10 nmol/liter or without ghrelin were measured. (B) Effect of suppression of IA-2β in MIN6 cells overexpressing IA-2β on insulin secretion. Buffer insulin concentration after 60-min incubation in the presence of 3.3 or 22.2 mmol/liter glucose with 10 nmol/liter or without ghrelin were measured by using MIN6 cells transfected with control siRNA or IA-2β siRNA for 24 h. All values are expressed as the means ± SDs of three independent experiments (n = 6–8; **, P < 0.01; *, P < 0.05 vs. nonstimulation with ghrelin in each cells; ##, P < 0.01; #, P < 0.05 control siRNA vs. IA-2β siRNA; $, P < 0.05 vs. control cells with the same condition).
Discussion
In the present study, we have identified ghrelin-induced genes in the brain by the PCR-select subtraction method. Unexpectedly, one of them turned out to be IA-2β, a β-cell autoantigen for type 1 diabetes. Identification of ghrelin-induced islet genes by using whole-pancreas mRNA was unsuccessful, because most of the genes identified were of exocrine pancreatic origin (data not shown). Therefore, we directly assessed whether ghrelin enhances IA-2β in mouse pancreas or insulinoma cell lines (MIN6 or βTC3 cells). After confirmation of enhancement of IA-2β expression by ghrelin in pancreas and insulinoma cells, we tested the effects on insulin secretion. As shown in Fig. 3A, ghrelin inhibits glucose-stimulated insulin secretion (GSIS) in MIN6 cells, with a minimal concentration of ≈1 nmol/liter. The concentrations of ghrelin inhibiting GSIS were very close to those of ghrelin enhancing IA-2β expression (Figs. 2A and 3A). Next we assessed the effects of overexpression of IA-2β on insulin secretion. Overexpression of IA-2β but not of IA-2 inhibited GSIS (Fig. 5). These findings strongly suggest that ghrelin may inhibit GSIS via enhancement of IA-2β expression. To confirm this possibility, we carried out RNAi experiments. By blocking enhancement of IA-2β expression with siRNA, the inhibitory effects of ghrelin or overexpression of IA-2β on GSIS were ameliorated (Fig. 6 A and B), providing direct evidence of the links between ghrelin, IA-2β, and GSIS. Because our experiments on GSIS were carried out by using insulinoma cell lines, this phenomenon might not be observed in physiological conditions. However, inhibitory effects of ghrelin have been reported also in isolated islets and animals, and we have confirmed the enhancement of IA-2β expression in mice. At least, in the whole animal, ghrelin inhibits insulin secretion and enhances IA-2β expression, although in vivo experiments of overexpression or siRNA inhibition of IA-2β would be necessary. Another question is whether the concentration of ghrelin used in our experiments is within the physiological range of the hormone. The inhibitory effects of ghrelin on GSIS were observed at ≈1 nmol/liter. Serum concentrations of total ghrelin range from 100 to 300 pmol/liter in humans (24) and from 1 to 2 nmol/liter in rodents (25). Because the active acylated form of ghrelin is estimated to be ≈10–20% of total circulating ghrelin, 1 nmol/liter of acylated ghrelin used in our experiments might be slightly higher than the physiological concentration, even in mice. However, significant elevations of ghrelin in anorexic patients have been reported (26). In such extreme cases of anorexia or malnutrition, serum ghrelin concentration may well reach a significant level to inhibit insulin secretion. The physiological role of ghrelin's inhibitory effect might be the prevention of hypoglycemia in malnourished states.
Two independent groups have recently reported ghrelin knockout mice (27, 28). In contrast to our results, serum insulin levels of knockout mice were not significantly different from wild type. There are possibilities that some compensating mechanism may exist in knockout mice to maintain glucose homeostasis, or defects of systemic effects of ghrelin may influence insulin secretion. Therefore, a conditional or β-cell-specific GHS receptor knockout would be necessary. Recently, two types of ghrelin transgenic mice, one using the rat insulin II promoter (RIP-G) and the other using the rat glucagon promoter (RGP-G) have been reported (29). RIP-G mice showed decreased GSIS, although this might be due to increased insulin sensitivity. And the important point was that RIP-G mice, which express 1,000 times more ghrelin in pancreas, did not show any increase of active acylated ghrelin, possibly due to lack of acylation enzyme activity in β-cells. RGP-G mice did not show any difference in insulin secretion. Because the blood stream usually flows from β- to α-cells in islet, expression of ghrelin in α-cells may not affect β-cells. Recently, another peptide, obestatin, has been identified from the proghrelin gene, and it antagonizes ghrelin's orexigenic effects (30). Because knockout and transgenic mice also will change obestatin level, the discrepancy between our results and the results in these mice may be attributable to obestatin. IA-2β knockout mice have been reported to be glucose-intolerant and to have impaired insulin secretion (31). Small amounts of IA-2β, at least, may be needed for normal secretory functions. Too much or too little IA-2β might impair insulin secretion. In our siRNA experiments, it was impossible to completely block the expression of IA-2β. Further study of the relationship between IA-2β expression levels and insulin secretion will be necessary. IA-2 knockout mice have been reported to be also glucose-intolerant and show insulin secretory defects (32). IA-2 also may be involved in the regulation of insulin secretion machinery. Although IA-2 and IA-2β have similar structures, and both localize in secretory granules, their expression seems to be regulated differently (33). In our data, ghrelin enhances expression of IA-2β and does not affect IA-2 expression. Compensatory changes of IA-2 expression have not been observed in our overexpression or RNAi experiments. Therefore, IA-2 is unlikely to play a role in the inhibition of insulin secretion by ghrelin.
The mechanism of inhibitory effects on GSIS by IA-2β is unknown. Ghrelin was reported to inhibit insulin secretion by attenuating Ca2+ signaling (11). In pituitary somatotrophs, ghrelin increases intracellular Ca2+ via the GHS receptor, which is also present in islets and MIN6 cells (Fig. 9, which is published as supporting information on the PNAS web site). Because deacylghrelin, which could not bind the GHS receptor, had no effects on both IA-2β induction and inhibition of insulin secretion (Figs. 10 and 11, which are published as supporting information on the PNAS web site), ghrelin probably act on the GHS receptor. Further analysis of intracellular signaling using various inhibitors will be necessary.
GSIS is biphasic, therefore, we have tested which phase was predominantly impaired by ghrelin. As shown in Fig. 12, which is published as supporting information on the PNAS web site, the second phase of GSIS was significantly inhibited by ghrelin or IA-2β overexpression. On the contrary to inhibition of GSIS by ghrelin, ghrelin did not have an effect on insulin secretion by sulfonylurea (ref. 11; data not shown). These results might be a key to clarify the mechanism or target of ghrelin and IA-2β. For example, Cav2.3 calcium channels are reported to regulate second-phase insulin secretion (34). Ghrelin and IA-2β may act on these Ca channels.
Secretagogue-dependent phosphorylation of IA-2β mediated by PKA was reported, and the time course of phosphorylation paralleled that of insulin release (35, 36). This suggested that phosphorylated IA-2β might play a role in stimulated insulin secretion. Overexpression of unphosphorylated IA-2β might inhibit the phosphorylated proteins. Wasmeier and Hutton (36) reported that the IA-2β phosphorylation mutant did not affect hormone release in AtT20 cells. Unfortunately, the result of such mutants in β-cell lines has not been reported. Because the number of secretory granules differs in various cell types, this needs to be done in the β-cell line.
IA-2β and IA-2 are believed to be inactive tyrosine phosphatases because of amino acid replacements of critical residues. However, Cui et al. (37) reported the presence of phosphatase activity in IA-2β, although the activity was extremely low compared with other phosphatases. Protein tyrosine phosphatase activity may involve the inhibitory effects of IA-2β against GSIS. On the contrary, the expression of these inactive phosphatases may inhibit active phosphatases by multimerization or competition for substrates (38). Further studies are needed to clarify the mechanism of inhibition of GSIS by ghrelin or IA-2β and their physiological roles.
Materials and Methods
Animals and Experimental Design. Male C57BL/6J mice, weighing 23.9 ± 1.2 g, were purchased from Japan SLC (Shizuoka, Japan) at 7 weeks of age and were maintained in our animal facilities under specific pathogen-free conditions (Institute of Animal Experimentation, Wakayama Medical University). The animals were individually housed in an air-conditioned room (23 ± 1°C) with a 12-h light/dark cycle (0800–2000). The mice were maintained on standard chow (containing 12.9% fat, 26.7% protein, and 60.4% carbohydrate as energy, minerals, and vitamins; Oriental Yeast, Tokyo) and tap water ad libitum. Body weight and food intake were measured at daily intervals through the experimental period. Feeding experiments were performed at 11:00 a.m., after an overnight fast. Ghrelin (Peptide Institute, Osaka; 10 μg per mouse dissolved with physiologic saline) was administrated by i.p. injection to mice (n = 4) and calculated food intakes were given at 20 min and 1 and 4 h after injection. For RNA and protein isolation, the mice (n = 4) received either a single i.p. injection of ghrelin (10 μg per mouse) or saline and were killed by cervical dislocation 15 min later. All treatment started at 11:00 a.m. and was carried out in the light phase. Brain blocks and pancreas were surgically removed immediately, frozen in liquid nitrogen, or soaked in RNAlater solution (Qiagen, Tokyo) and stored at –80°C until further analysis.
RNA Isolation and PCR-Selected Subtraction Analysis. Brain and pancreas were stored in liquid nitrogen for RNA isolation. Total RNA was extracted from tissues by using a guanidine–isothiocyanate preparation (TRIzol reagent) according to the manufacturer's recommended protocol (Invitrogen). Poly(A)+ mRNA was purified by using Oligotex-dT30 Super (Takara Shuzo, Shiga, Japan). Two micrograms of Poly(A)+ mRNA was used for PCR-selected subtraction analysis to identify cDNAs that correspond to differentially expressed sequences in one cDNA population compared with another. The Clontech PCR-Select cDNA Subtraction kit was purchased from BD Biosciences. Poly(A)+ mRNA samples isolated from mice injected with ghrelin were used as “Tester,” cDNA in which specific transcripts are found, and samples isolated from mice injected saline were used as “Driver,” the reference cDNA. Subtracted PCR products were cloned by the pGEM-T Easy Cloning kit (Promega).
Northern Blotting. pGEM-T Easy-mouse IA-2β (corresponding to amino acids 126–260 of IA-2β) cloned by PCR-select subtraction was digested by EcoRI and purified 408-bp fragment with the QIAEX II Gel Extraction kit (Qiagen). Poly(A)+ mRNA (2 μg) isolated from tissues was separated on a 1.0% agarose gel containing 2.4% formaldehyde and transferred to nitrocellulose membrane (Schleicher & Schüll). Then the membranes were crosslinked and hybridized with [32P] dCTP (Amercham)-labeled IA-2β cDNA probes by using a BcaBest labeling kit (Takara Shuzo).
RT-PCR and Quantitative PCR. Total RNA was isolated from tissues or cells of individual mice. A total of 4.5 μg of total RNA was reverse-transcribed into cDNA by using MultiScribe Reverse Transcriptase (Applied Biosystems). Expression levels of IA-2, IA-2β, and insulin mRNA were analyzed by quantitative real-time PCR (QT-PCR) by using the Applied Biosystems PRISM 7700 Sequence Detection System (Applied Biosystems), according to the manufacturer's directions. Primer pairs and FAM-conjugated probes for each mouse mRNA purchased from Applied Biosystems are shown in Table 1, which is published as supporting information on the PNAS web site. Control templates for quantification were made by cloning each cDNA fragments into pGEM-T Easy vector (Promega), and sequences were confirmed. To compensate for variations in amounts of input RNA and efficiency of reverse transcription, data were calculated as copy number of each mRNA relative to β-actin as an internal control.
Western Blotting. Cultured cells were suspended in ice-cold lysis buffer (M-PER Protein Extraction Reagent; Pierce). After rotation at 4°C for 30 min and centrifugation at 3,560 × g at 4°C for 20 min, the supernatant was measured by using the Bio-Rad Protein Assay kits and normalized based on the concentration of protein. The total lysate samples were subjected to SDS/PAGE, and the proteins were transferred to nitrocellulose membrane then immunoblotted by using a rabbit polyclonal antibody against mouse IA-2β (a kind gift from John C. Hutton, University of Colorado, Denver). The proteins bound to antibodies were detected by using horseradish peroxidase-conjugated anti-rabbit IgG and visualized by using an enhanced chemiluminescence detection system (Amersham Pharmacia Biosciences).
Cell Lines. MIN6 cells (obtained from J. Miyazaki, Osaka University, Osaka) and βTC3 cells (obtained from D. Hanahan, University of California, San Francisco) were maintained in DMEM containing 25 mmol/liter glucose, 10% FBS, and antibiotics (Invitrogen). To investigate the effect on overexpression of IA-2 or IA-2β, mouse IA-2 and IA-2β clones were obtained from the IMAGE clone collection (Open Biosystems, Huntsville, AL). An XhoI–XhoI (IA-2) or SfiI–SfiI fragment (IA-2β) was subcloned into the plasmid pcDNA 3.1 (Invitrogen) individually, in which expression is driven by a cytomegalovirus promoter. The MIN6 cells were seeded in 24-well culture plates. Constructed plasmids, pcDNA3.1-mouse IA-2, or pcDNA3.1-mouse IA-2β were transfected to MIN6 cells by using a FuGENE6 Transfection Reagent (Roche Diagnostics) and selected by neomycin to obtain cells stably overexpressing IA-2 or IA-2β. The pcDNA 3.1 vector alone was transfected into MIN6 cells in parallel experiments.
Insulin Secretion Assay and Insulin ELISA. For secretion experiments, MIN6 cells were plated onto 24-well culture plates and incubated at 37°C in 5% CO2, in 1 ml of culture medium. After 48 h of culture, the medium were removed, and cells were washed once with Krebs–Ringer bicarbonate–Hepes buffer (KRBH) containing 0.5% BSA without glucose. To stabilize basal insulin secretion, cells were preincubated for 30 min in KRBH with 0.5% BSA and 5 mmol/liter glucose. After washing two times with KRBH, cells were incubated in KRBH supplemented with 0.5% BSA and indicated concentrations (3.3, 5.5, 8.3, 11.1, or 22.2 mmol/liter) of glucose for 60 min. In addition, cells were incubated with ghrelin at different doses (0.01–10 nmol/liter) for 60 min or with 1 nmol/liter ghrelin at different times (15–120 min). In another set of experiments, MIN6 cells overexpressing IA-2 or IA-2β were used (see Cell Lines above). Buffer samples were collected at the end of the experiments, and the insulin content of the supernatant was quantified by an ELISA kit (Linco Research, St. Charles, MO), according to the manufacturer's instructions. After collecting the supernatant, cells were gently scraped with a lysis buffer, and the insulin concentration in the cell suspension was measured. Insulin contents were normalized by protein content of the lysate, determined by a Bio-Rad Protein Assay kit.
RNA Interference (RNAi). To investigate the influence of reduction of IA-2β by RNAi, small interfering RNA (siRNA) of a specific sequence of mouse IA-2β was obtained from Japan Bio Services (Saitama, Japan). Two single-strand siRNAs were annealed in annealing buffer to form dsRNA, according to the manufacturer's directions. The MIN6 cells were seeded into 24-well culture plates and transfected with IA-2β dsRNA by RNAiFect Transfection Reagent (Qiagen). Negative-control siRNA and Alexa Fluor 488 (accompaniment to RNAiFect) were used as control. After 24 or 48 h, MIN6 cells transfected with siRNA for mouse IA-2β were used for further analysis.
Statistical Analysis. Data are expressed as means ± SDs. Data were analyzed by Student's t test for unpaired comparisons or valiance pulse Bonferroni multiple-comparison tests for determining the significance of any differences among more than two groups. A P value <0.05 was accepted as significant.
Supplementary Material
Acknowledgments
We thank Dr. Y. Morikawa for valuable comments during the course of this work and Dr. J. C. Hutton (University of Colorado, Denver) for providing an anti-IA-2β antibody. This work was supported by a Grantin-Aid for Scientific Research from the Japan Society for the Promotion of Science (JSPS) (1661641) and by a Grant-in-Aid from Scientific Research on Priority Areas “Medical Genome Science” from the Ministry of Education, Culture, Sports, Science and Technology of Japan (13204074). A.D. was supported by a JSPS Research Fellowship for Young Scientists.
Conflict of interest statement: No conflicts declared.
This paper was submitted directly (Track II) to the PNAS office.
Abbreviations: GH, growth hormone; GHS, GH secretagogue; QT-PCR, quantitative real-time PCR; KRBH, Krebs–Ringer bicarbonate–Hepes; RNAi, RNA interference; siRNA, small interference RNA; GSIS, glucose-stimulated insulin secretion.
References
- 1.Kojima, M., Hosoda, H., Date, Y., Nakazato, M., Matsuo, H. & Kangawa, K. (1999) Nature 402, 656–660. [DOI] [PubMed] [Google Scholar]
- 2.Howard, A. D., Feighner, S. D., Cully, D. F., Arena, J. P., Liberator, P. A., Rosenblum, C. I., Hamelin, M., Hreniuk, D. I., Palyha, O. C., Anderson, J., et al. (1996) Science 273, 974–977. [DOI] [PubMed] [Google Scholar]
- 3.Nakazato, M., Murakami, N., Date, Y., Kojima, M., Matsuo, H., Kangawa, K. & Matsukura, S. (2001) Nature 409, 194–198. [DOI] [PubMed] [Google Scholar]
- 4.Tschop, M., Smiley, D. L. & Heiman, M. L. (2000) Nature 407, 908–913. [DOI] [PubMed] [Google Scholar]
- 5.Matsuda, Y., Tanaka, T., Inomata, N., Ohnuma, N., Tanaka, S., Itoh, Z., Hosoda, H., Kojima, M. & Kangawa, K. (2000) Biochem. Biophys. Res. Commun. 276, 905–908. [DOI] [PubMed] [Google Scholar]
- 6.Nagaya, N., Uematsu, M., Kojima, M., Ikeda, Y., Yoshihara, F., Shimizu, W., Hosoda, H., Hirota, Y., Ishida, H., Mori, H., et al. (2001) Circulation 104, 1430–1435. [DOI] [PubMed] [Google Scholar]
- 7.Date, Y., Kojima, H., Hosoda, H., Sawaguchi, A., Mondal, M. S., Suganuma, T., Matsukura, S., Kangawa, K. & Nakazato, M. (2000) Endocrinology 141, 4255–4261. [DOI] [PubMed] [Google Scholar]
- 8.Gnanapavan, S., Kola, B., Bustin, S. A., Morris, D. G., McGee, P., Fairclough, P., Bhattachaya, S., Carpenter, R., Grossman, A. B. & Korbonits, M. (2002) J. Clin. Endocrinol. Metab. 87, 2988–2991. [DOI] [PubMed] [Google Scholar]
- 9.Date, Y., Nakazato, M., Hashiguchi, S., Dezaki, K., Mondal, M. S., Hosoda, H., Kojima, M., Kangawa, K., Arima, T., Matsuo, H., et al. (2002) Diabetes 51, 124–129. [DOI] [PubMed] [Google Scholar]
- 10.Volante, M., Allia, E., Gigliotta, P., Funaro, A., Broglio, F., Deghenghi, R., Muccioli, G., Ghigo, E. & Papotti, M. (2002) J. Clin. Endocrinol. Metab. 87, 1300–1308. [DOI] [PubMed] [Google Scholar]
- 11.Dezaki, K., Hosoda, H., Kakei, M., Hashiguchi, S., Watanabe, M., Kangawa, K. & Yada, T. (2004) Diabetes 53, 3142–3151. [DOI] [PubMed] [Google Scholar]
- 12.Egigo, E. M., Rodriguez Gallardo, J., Silvestre, R. A. & Marco, J. (2002) Eur. J. Endocrinol. 146, 241–244. [DOI] [PubMed] [Google Scholar]
- 13.Reimer, M. K., Pacini, G. & Ahren, B. (2003) Endocrinology 144, 916–921. [DOI] [PubMed] [Google Scholar]
- 14.Colombo, M., Gregersen, S., Xiao, J. & Hermansen, K. (2003) Pancreas 27, 161–166. [DOI] [PubMed] [Google Scholar]
- 15.Lee, H.-M., Wang, G., Englander, E. W., Kojima, M. & Greeley, G. H., Jr. (2002) Endocrinology 143, 185–190. [DOI] [PubMed] [Google Scholar]
- 16.Wasmeier, C. & Hutton, J. C. (1996) J. Biol. Chem. 271, 18161–18170. [DOI] [PubMed] [Google Scholar]
- 17.Lu, J., Li, Q., Xie, H., Chen, Z.-J., Borovitskaya, A. E., Maclaren, N. K., Notkins, A. L. & Lan, M. S. (1996) Proc. Natl. Acad. Sci. USA 93, 2307–2311. [DOI] [PMC free article] [PubMed] [Google Scholar]
- 18.Cui, L., Yu, W.-P., DeAizpurua, H. J., Schmidli, R. S. & Pallen, C. J. (1996) J. Biol. Chem. 40, 24817–24823. [PubMed] [Google Scholar]
- 19.Chiang, M. K. & Flanagan, J. G. (1996) Development (Cambridge, U.K.) 122, 2239–2250. [DOI] [PubMed] [Google Scholar]
- 20.Smith, P. D., Barker, K. T., Wang, J., Lu, Y.J., Shipley, J. & Crompton, M. R. (1996) Biochem. Biophys. Res. Commun. 229, 402–411. [DOI] [PubMed] [Google Scholar]
- 21.Lan, M. S., Lu, J., Goto, Y. & Notkins, A. L. (1994) DNA Cell Biol. 13, 505–514. [DOI] [PubMed] [Google Scholar]
- 22.Lan, M. S., Wasserfall, C., Maclaren, N. K. & Notkins, A. L. (1996) Proc. Natl. Acad. Sci. USA 93, 6367–6370. [DOI] [PMC free article] [PubMed] [Google Scholar]
- 23.Cai, T., Krause, M. W., Odenward, W. F., Toyama, R. & Notkins, A. L. (2001) Diabetologia 44, 81–88. [DOI] [PubMed] [Google Scholar]
- 24.Shinya, T., Nakazato, M., Mizuta, M., Date, Y., Mondal, S. M., Tanaka, M., Nozoe, S., Hosoda, H., Kangawa, K. & Matsukura, S. (2002) J. Clin. Endocrinol. Metab. 87, 240–244. [DOI] [PubMed] [Google Scholar]
- 25.Toshinai, K., Mondal, M. S., Nakazato, M., Date, Y., Murakami, N., Kojima, M., Kangawa, K. & Matsukura, S. (2001) Biochem. Biophys. Res. Commun. 281, 1220–1225. [DOI] [PubMed] [Google Scholar]
- 26.Otto, B., Cuntz, U., Fruehauf, E., Wawarta, R., Folwaczny, C., Riepl, R. L., Heiman, M. L., Lehnert, P., Fichter, M. & Tschop, M. (2001) Eur. J. Endocrinol. 145, R5–R9. [PubMed] [Google Scholar]
- 27.Sun, Y., Ahmed, S. & Smith, R. G. (2003) Mol. Cell. Biol. 23, 7973–7981. [DOI] [PMC free article] [PubMed] [Google Scholar]
- 28.Wortley, K. E., Anderson, K. D., Garcia, K., Murray, J. D., Malinova, L., Liu, R., Moncrieffe, M., Thabet, K., Cox, H. J., Yancopoulos, G. D., et al. (2004) Proc. Natl. Acad. Sci. USA 101, 8227–8232. [DOI] [PMC free article] [PubMed] [Google Scholar]
- 29.Iwakura, H., Hosoda, K., Son, C., Fujikura, J., Tomita, T., Noguchi, M., Ariyasu, H., Takaya, K., Masuzaki, H., Ogawa, Y., et al. (2005) J. Biol. Chem. 280, 15247–15256. [DOI] [PubMed] [Google Scholar]
- 30.Zhang, J. V., Ren, P.-G., Avisian-Kretchmer, O., Luo, C.-W., Rauch, R., Klein, C. & Hsueh, A. J. W. (2005) Science 310, 996–999. [DOI] [PubMed] [Google Scholar]
- 31.Kubosaki, A., Gross, S., Miura, J., Saeki, K., Zhu, M., Nakamura, S., Hendriks, W. & Notkins, L. (2004) Diabetes 53, 1684–1691. [DOI] [PubMed] [Google Scholar]
- 32.Saeki, K., Zhu, M., Kubosaki, A., Xie, J., Lan, M. S. & Notkins, A. L. (2002) Diabetes 51, 1842–1850. [DOI] [PubMed] [Google Scholar]
- 33.Lobner, K., Steinbrenner, H., Roberts, G. A., Ling, Z., Huang, G.-C., Piquer, S., Pipeleers, D. G., Seissler, J. & Christie, M. R. (2002) Diabetes 51, 2982–2988. [DOI] [PubMed] [Google Scholar]
- 34.Jing, X., Li, D.-Q., Ologsson, C. S., Salehi, A., Surve, V. V., Caballero, J., Ivarsson, R., Lundquist, I., Pereverzev, A., et al. (2005) J. Clin. Invest. 115, 146–154. [DOI] [PMC free article] [PubMed] [Google Scholar]
- 35.Wasmeier, C. & Hutton, J. C. (1999) Biochem J 341, 563–569. [PMC free article] [PubMed] [Google Scholar]
- 36.Wasmeier, C. & Hutton, J. C. (2001) J. Biol. Chem. 34, 31919–31928. [DOI] [PubMed] [Google Scholar]
- 37.Cui, L., Yu, W.-P. & Pallen, C. J. (1998) J. Biol. Chem. 52, 34784–34791. [DOI] [PubMed] [Google Scholar]
- 38.Gross, S., Blanchetot, C., Schepens, J., Albet, S., Lammers, R., den Hertog, J. & Hendriks, W. (2002) J. Biol. Chem. 277, 48139–48145. [DOI] [PubMed] [Google Scholar]
Associated Data
This section collects any data citations, data availability statements, or supplementary materials included in this article.