Abstract
The metabotropic glutamate receptor 1α (mGluR1α) is crucial for some forms of synaptic plasticity, by inducing various cell responses via coupling to various types of G proteins. Upon glutamate binding, an active conformation, closed–open/active, of the extracellular domain is stabilized, which induces dimeric rearrangement in the intracellular domains, resulting in the initiation of downstream signals. We have confirmed that mGluR1α functionally interacts with both Gq and Gs pathways; a combination of fluorescent indicators showed that glutamate increased intracellular Ca2+ and cAMP concentration ([Ca2+]i and [cAMP]i). By contrast, Gd3+, a different type of ligand whose recognition site on mGluR1α is distinct from the glutamate site, increased only [Ca2+]i and the concentration-activation curve was bell-shaped. FRET analysis revealed that a low concentration of Gd3+ induced dimeric rearrangement of the intracellular domains of mGluR1α as does glutamate, whereas a high concentration of Gd3+ reversed the FRET efficiency, which was consistent with a bell-shaped relationship between concentration and Gq activation. These results suggest that Gd3+ induces an active and a sort of “inactivated” conformation in mGluR1α. The Gd3+-induced active state is considered to correspond to the closed-closed/active conformation, revealed by previous x-ray crystallographic studies. In conclusion, the glutamate-induced closed–open/active state coupled both to Gs and Gq proteins whereas the Gd3+-induced closed-closed/active conformation state preferred Gq to Gs, suggesting that mGluR1α serves not only as a simple on/off switch but also as a multiple signaling path regulator.
Keywords: FRET, G protein-coupling receptor
The metabotropic glutamate receptor 1α (mGluR1α) plays an important role in some forms of synaptic plasticity; long-term depression in cerebellum Purkinje cells (1, 2) and long-term potentiation in hippocampal pyramidal cells (3, 4) are suppressed in mGluR1α deficient animals. Activation of the mGluR1α causes various cell responses via coupling to various types of G proteins (5); activation of the receptor results in an increase in intracellular Ca2+ concentration ([Ca2+]i) via the Gq pathway and in an accumulation of intracellular cAMP via Gs (6–9). In addition, mGluR1α evokes nonselective cation current through canonical transient receptor potential channels (10, 11). Divergent responses mediated by mGluR1α may underlie its important role in synaptic transmission and synaptic plasticity.
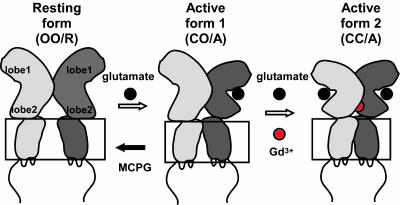
The metabotropic glutamate receptor 1α (mGluR1α), a class 3 G protein-coupling receptor (GPCR), is functionally and structurally distinct from other classes of GPCRs in that it displays: (i) homodimer conformation, (ii) a large extracellular domain (ECD) that includes a recognition site for ligand binding (12, 13), and (iii) sensitivity to polyvalent cations, such as Ca2+ and Gd3+ (7, 14). X-ray crystallographic studies have revealed that the ECD of each subunit forms a structural unit, namely a Venus flytrap, which consists of lobe 1 and lobe 2 (15) (Fig. 1). Glutamate stabilizes the closed conformation of the Venus flytrap by binding on the interface between the lobes, transitioning the dimer to the active state and thereby inducing a dimeric rearrangement of the intracellular domains (ICD) (16), which leads to downstream signaling. On the other hand, a different type of ligand, Gd3+ (7, 14), interacts with the lobe 2-to-lobe 2 dimer interface (17), inducing the dimeric rearrangement of the ICD (16). It is also known that repulsion by negative residues clustered at the dimeric interface generates two distinct active conformations; closed–open/active (CO/A), induced by glutamate, and closed–closed/active (CC/A), induced by Gd3+ with glutamate (17). The repulsion causes a negative cooperativity, which prohibits both subunits from being in closed conformations at the same time (18), whereas additional Gd3+ attenuates the repulsion and permits both subunits to simultaneously form closed conformations (Fig. 1). Because it has been suggested that different ligands induce different active conformations and thereby affect the coupling properties of the receptor to G proteins (19), it is possible that the downstream signals also differ depending on the type of ligand. In this study, we examined this possibility, and also investigated by FRET analysis whether the conformations of the ICD in CO/A and CC/A states differ.
Fig. 1.
A schematic drawing of conformational states of mGluR1α based on analysis of structural data. The ligand-induced conformational states are shown, based on the structural studies (15, 17). Upon binding of glutamate, mGluR1α enters from open–open/resting (OO/R) into closed–open/active (CO/A) state. In the presence of Gd3+, mGluR1 enters another active state, closed–closed/active (CC/A), as Gd3+ neutralizes negative charges clustered at the dimer interface.
Results
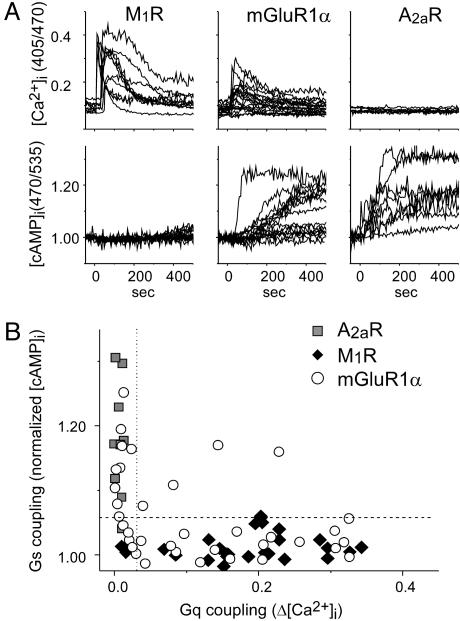
Activation of both Gs and Gq Pathways by the mGluR1α in CHO Cells. We have simultaneously monitored the changes in [Ca2+]i and [cAMP]i, by using fluorescent indicators, because mGluR1α has been reported to directly activate Gs and Gq pathways in CHO cells (6–9). Activation of mGluR1α caused a transient increase in [Ca2+]i and a gradual increase in [cAMP]i (Fig. 2A Center). The changes of [Ca2+]i and [cAMP]i were not secondary results of each other, because the activation of the Gq-coupled acetyl-choline M1 receptor caused an increase in the [Ca2+]i transient without altering [cAMP]i (Fig. 2 A Left), whereas the activation of Gs-coupled adenosine A2a receptor increased [cAMP]i without affecting [Ca2+]i (Fig. 2A Right). Based on these results, we defined that the Gq and Gs pathways are activated if Δ[Ca2+]i and [cAMP]i were >0.045 and 1.06, respectively (Fig. 2B dashed and dotted line, respectively). The simultaneous monitoring revealed that mGluR1α does not activate Gs and Gq pathways uniformly (Fig. 2B). The ratio of cells exhibiting (Gq+, Gs–), (Gq–, Gs+), and (Gq+, Gs+) were 0.56, 0.34, and 0.10, respectively (the total number was 30). The inequality of the couplings might be partially due to phosphorylation, because mGluR1α has spontaneous activity and protein kinase C-dependent phosphorylation of mGluR1α was reported to prohibit the Gq coupling (20). A scaffold protein, homer, also modulates mGluR signaling (21–23), but in CHO cells, cotransfection of homer proteins did not alter the pattern of responses (data not shown).
Fig. 2.
mGluR1α directly activates both Gs and Gq pathways in CHO cells. (A) Time-dependent changes in [Ca2+]i (Upper) and [cAMP]i were represented as ratios of fluorescent intensity (405/470) and as normalized reciprocal FRET values (470/535), respectively. Ligands (10 μM oxotremoline for M1R, 1 mM glutamate for mGluR1α, and 10 μM NECA for A2aR) were applied at time 0. (B) Comparison of functional coupling of the receptors with signaling pathway mediated by Gq and Gs proteins. Abscissa represents maximal change of [Ca2+]i, and the ordinate shows normalized [cAMP]i (averaged value at 230–250 s after application). Based on these results, we defined that the Gq and Gs pathways are activated if Δ[Ca2+]i and [cAMP]i were >0.045 (dashed line) and 1.06 (dotted line), respectively.
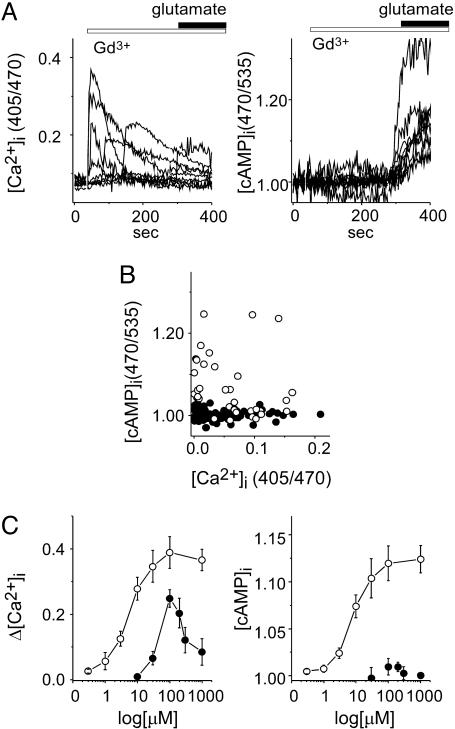
Ligand-Directed Heterogeneity of Signaling Pathways Mediated by mGluR1α. Because a combination of fluorescent indicators enabled visualization of dual coupling of mGluR1α to Gs and Gq proteins, we investigated the effects of another ligand, Gd3+ (7, 14). The [Ca2+]i transient was induced by Gd3+ (100 μM), but an increase in [cAMP]i was not (Fig. 3 A and B). The former was not a nonspecific effect of Gd3+ because the effect was not reproduced in cells expressing E238Q-mGluR1α (data not shown), a point mutant whose Gd3+ sensitivity is abolished (14), and the latter was not due to the deficiency of the endogenous Gs pathway because additional application of glutamate increased [cAMP]i (Fig. 3A Right). Although the structure of Venus flytrap with Gd3+ alone has not been reported, it would be feasible that Gd3+ may lead mGluR1α to enter into CC/A state for two reasons as follows. (i) Each Venus flytrap spontaneously enters the closed conformation (15), which is promoted by attenuation of the repulsion at the dimer interface (24). (ii) Gd3+ could interact with mGluR only in the CC/A conformation, which is supported by results that an antagonist, (S)-MCPG (500 μM), known to stabilize the open conformation of each subunit (open-open/resting) (17), inhibited the effects of Gd3+ (Fig. 7, which is published as supporting information on the PNAS web site). The Gq preferential activation was observed in various concentrations of Gd3+ (Fig. 3C), and the relationship of Gd3+ concentration to Δ[Ca2+]i was bell-shaped (Fig. 3C), as observed in HEK cells (23); this could be due to a sort of inactivation induced by high concentration of Gd3+, because the duration of the [Ca2+]i transient was shortened, which was not observed by high concentration of glutamate (23). Taken together, it was shown that the signaling pathways via mGluR1α are differentially activated by different types of ligands, glutamate and Gd3+.
Fig. 3.
Gd3+ activates Gq but not Gs pathway via mGluR1α. (A) Time-dependent changes in the [Ca2+]i (Left) and [cAMP]i (Right) are shown. Gd3+(100 μM, open bar) was applied at time 0, and then glutamate was applied additionally at 270 s (filled bar). (B) Functional coupling of mGluR1α with G proteins, induced by glutamate (open circle) or Gd3+ (filled circle), was represented as in Fig. 2. (C) Concentration dependence of Gq and Gs activation is shown as changes in [Ca2+]i (Left) and [cAMP]i (Right), respectively. Abscissa represents concentration, and ordinate represents maximal change in [Ca2+]i (C left) and normalized [cAMP]i (C Right).
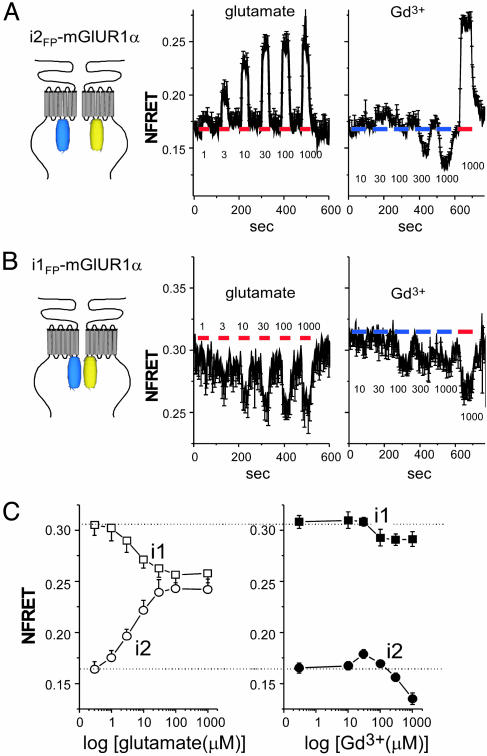
Effects of Gd3+ on the Dimeric Rearrangement of the Receptor. Two distinct active conformations, CO/A and CC/A, in the ECD of mGluR1α (15, 17) may induce different conformational changes in the ICD where the receptor–G protein coupling actually occurs (9, 20). The possible difference in conformation may result in functional differences depending on the type of ligand. Therefore, the dimeric rearrangement of the ICD was evaluated by FRET analysis. As we previously reported (16), glutamate increased and decreased FRET efficiency between fluorescent protiens (FPs) inserted into the second and first intracellular loops of mGluR1α (i2 and i1, respectively, Fig. 4 A and B). The glutamate-concentration dependence of FRET efficiency was almost identical in both constructs, and comparable in potency to activate Gq and Gs pathways (see Figs. 3C and 4C). Gd3+ also caused the dimeric rearrangement, but the changes in FRET efficiency were not identical to that induced by glutamate. In i2FPs-mGluR1αs, the FRET efficiency was increased by 30 μM of Gd3+, similar to by glutamate, whereas efficiency was reduced at high concentration of Gd3+ (Fig. 4A Right). These changes were not observed in E238Q-i2FPs-mGluR1α (Fig. 8, which is published as supporting information on the PNAS web site), indicating that interaction of Gd3+ with the dimer interface did induce these dimeric rearrangements. In i1FPs-mGluR1αs, conspicuous changes were not detected at low concentration of Gd3+, but the decrease was also observed when Gd3+ at >100 μM was applied (Fig. 4B). The decreases in FRET changes in both constructs appear consistent with the decreasing phase of the concentration-Δ[Ca2+]i curve (Fig. 3C), reflecting a putative inactivated state that has not been structurally identified. Our FRET analysis showed that low concentrations of Gd3+ cause dimeric rearrangement of the ICD, like glutamate, and high concentrations of Gd3+ further induce the inactivated state in mGluR1α. However, coexistence of the inactivated state makes it difficult to discriminate the dimeric rearrangements corresponding to CO/A and CC/A states.
Fig. 4.
Effects of glutamate and Gd3+ on dimeric rearrangement of mGluR1α Intracellular domains. (A and B) Time- and concentration-dependent changes of the FRET efficiency in i2FPs- (A) and i1FPs-mGluR1α (B) and their labels (A and B, Left). Indicated concentrations (μM) of glutamate (red bars, Center) and Gd3+ (blue bars, Right) were perfused for 1 min. In case of Gd3+ application, 1,000 μM glutamate was also applied (red bars at Right) at the end to confirm the reponsiveness of constructs. (C) Concentration–NFRET relationships are shown (n = 6–12).
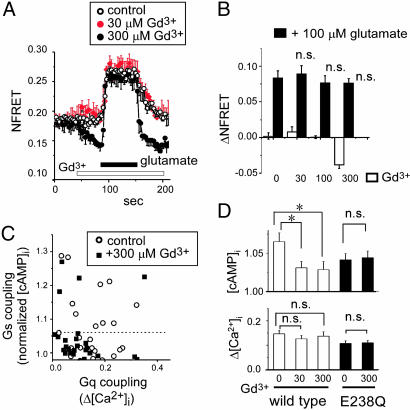
CC/A State Is Unfavorable to Gs Coupling of the mGluR1α. As a next step, we aimed to structurally and functionally discriminate the glutamate-induced CO/A state from the CC/A state induced by glutamate with Gd3+ (17). We applied glutamate (100 μM) in the absence and presence of Gd3+, because coapplication of Gd3+ shifts the conformational equilibrium toward the CC/A state from the glutamate-induced CO/A state (see Fig. 1). Even with various concentrations of Gd3+ (30–300 μM), glutamate (100 μM) increased the FRET efficiency in i2FPs-dimer to an almost identical level with data in the absence of Gd3+ (Fig. 5 A and B) and decreased in the i1FPs-dimer (data not shown). FRET analysis could not discriminate the two active states, CO/A and CC/A, which suggests that the conformational difference in ICD between them is subtle. By contrast, simultaneous monitoring of the downstream signaling revealed that glutamate-induced activation of the Gs pathway was significantly attenuated by addition of Gd3+ in wild-type mGluR1α, although that of the Gq pathway was not affected (Fig. 5 C and D). It is unlikely that Gd3+ directly suppresses the endogenous Gs pathway, because the effect was not observed in E238Q-mGluR1α (Fig. 5D). The inhibitory effect of Gd3+ at low concentration on the glutamate-induced activation of the Gs pathway is opposite to that on the glutamate-induced activation of the Gq pathway: low concentration of Gd3+ (10 μM) enhanced sensitivity of the Gq response to glutamate (14). It should be noted that there is a tendency for the magnitude of [cAMP]i accumulation to be smaller for E238Q than for wild type (Fig. 5D) under control conditions, suggesting that some population of the mutant receptors could enter the CC/A state because of alleviation of the repulsion at the dimer interface by reduction of a negative charge. Taken together, these results show that the glutamate-induced CO/A state can interact with Gq and Gs proteins, whereas the Gd3+-induced CC/A state prefers Gq to Gs.
Fig. 5.
Modification of the coupling property of mGluR1α by Gd3+. (A) Time-dependent changes of i2-FRET efficiency, induced by glutamate (filled bar) in the presence or absence of Gd3+ (open bar), were shown (n = 4–6). (B) ΔNFRET values in each group, calculated as subtraction of average NFRET (between 30 and 60 s) from baseline, were plotted. Open and filled column represents the changes of NFRET by Gd3+ and by additional 100 μM glutamate, respectively. n.s., not significant to control. (C) Functional coupling of mGluR1α with G proteins, induced by glutamate in the absence (open circle) or presence of 300 μM Gd3+ (filed square), was represented as in Fig. 2. (D) Gd3+ decreased the population of mGluR1α coupling to Gs but not to Gq. Each column represents the averaged value of the glutamate-induced increases in [cAMP]i (Upper) and [Ca2+]i (Lower) in cells functionally expressing WT-(open column) and E238Q-mGluR1α (filled column) (n = 38–47). The increase in [cAMP]i in control is almost half as compared with that in Fig. 2, because the ratio of Gs-positive cells was 0.49 of mGluR1α responsible cells. *, P < 0.05 against control (0 mM Gd3+), n.s., not significant against control (0 mM Gd3+).
Discussion
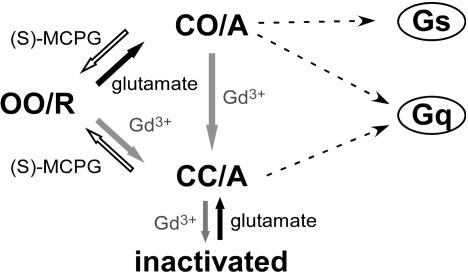
The present study provides evidence for a functional difference between two active states, CO/A and CC/A, although the conformational difference of the intracellular region between the two states could not be detected by FRET analysis. Based on the present results, we propose a possible scheme of ligand-induced conformational states and their preferential couplings to G proteins (Fig. 6); a glutamate-induced CO/A state activates both Gq and Gs pathways, whereas Gd3+ leads to CC/A conformation coupling to Gq but not Gs. Furthermore, a high concentration of Gd3+ induces a nonfunctional, sort of inactivated state in the receptor, which is apparently distinguishable from CC/A by FRET analysis.
Fig. 6.
A scheme explaining correlation between ligand-induced conformational states and G protein coupling.
The mechanism of how conformational changes upon ligand binding are transmitted to the seven-transmembrane regions (7-TMs) including intracellular loops is thought to be different between class 3 and other classes of GPCRs, because in other classes of GPCRs, the recognition site for ligands is located in the 7-TMs, but in class 3 GPCRs it is located in the large ECDs. In other class GPCRs, such as rhodopsin, α-adrenoreceptor, and parathyroid receptors (25–27), ligand binding directly alters the 7-TM conformation, leading to corresponding conformational changes in the intracellular loops, where the coupling of receptor to G proteins takes place. On the other hand, glutamate induces conformational changes in the ECD of mGluR1α and leads to remarkable rearrangement of the dimeric allocation in the ICD, without conspicuous conformational changes in 7-TM domains of each subunit (16). The dimeric rearrangement may serve as an on/off switch by altering the conformation or environment of the intracellular loops of mGluR1α, including the second and third loops (i2 and i3) that play important roles in the multiple coupling to G proteins (20). In addition to the simple switch, this study showed that mGluR1α serves as a multiple signaling path regulator depending on the conformational states, although our FRET analysis could not discriminate the conformational difference in i2 between CO/A and CC/A states. This is considered to be caused by subtle difference in conformation between the two active states, as reported in a previous structural study of the ECD (17). However, the subtle conformational change in the CC/A state might be sufficient to alter the coupling property of mGluR1α, because a phosphorylation of one amino acid residue in the second loop, Thr at 695, could prohibit the coupling to Gq but not Gs (9). It would be also possible that conspicuous dimeric rearrangement is induced in i3 when mGluR1α enters the CC/A state, although our FRET analysis could not be applied to detect it because the insertion of FPs into i3 disturbed the folding both of FPs and mGluR1α (16). Further studies are necessary to solve the detailed conformation of the ICD, corresponding to each conformation of the ECD.
Gd3+ activates mGluR1α, but does not exist in cerebrospinal fluid at sufficient concentration. Ca2+ has been suggested as a possible candidate to mimic the effect Gd3+ (17, 28), and has been reported to enhance the glutamate sensitivity of mGluR1α (29). However, Ca2+ does not appear to interact with mGluR1α at the Gd3+ binding site, because the enhancing effect of Ca2+ on the glutamate sensitivity remains intact even in E238Q-mGluR1α (14). Because a type C natriuretic peptide (NP) interacts with the interface of the NP receptor (30), it would be fascinating to determine whether there are some other endogenous substances that mimic the effects of Gd3+, which may restrict the active conformation of mGluR1α in neuronal cells and thereby regulate the multiple signaling. Even without Gd3+, the mGluR5 dimer has been reported to enter into CC/A state (28), suggesting that, under some condition or environment, mGluR enters the CC/A state. This possibility is supported by a recent report in which ligand affinity of Drosophila mGluR was affected by lipid (31); the high-affinity state was promoted by sterol-rich lipid.
GPCRs have been accepted as a simple on/off switch for signal transduction, via a single active conformation induced by ligand-binding to a single recognition site. However, the multiple recognition sites have recently been suggested to induce multiple active conformations and thereby to affect the intensity of signaling (19). This was supported by a recent report that in mGluR5 partial activity was observed in the CO/A conformation, whereas full activity was in the CC/A (28). In addition to the conformation-dependent changes of the signaling intensity, in the present work we observed a difference in the type of signaling pathway, suggesting that mGluR1α is not a simple on/off switch but a multisignaling path regulator of downstream signals in a ligand type- and conformation-dependent manner.
Materials and Methods
Constructs and Expression System. The coding regions (V2-L238) of fluorescent proteins (FPs), Cerulean (32) and Venus (33), were PCR amplified and inserted into loops-1 (i1, P621-V622) or -2 (i2, I685-L686) of mGluR1α, as reported (16). Each construct was subcloned into the pCXN2 expression vector, after which the sequence was confirmed by DNA sequencing (ABI prism 310) as described (14). CHO cells were cultured on glass-bottom dishes (Matsunami) with F-12 medium and transfected with plasmid DNA using LipofectAMINE2000 (Invitrogen). Experiments were carried out 48–72 h after transfection.
Simultaneous Monitoring of the Changes in [Ca2+]i and [cAMP]i. Simultaneous monitoring of the changes in [Ca2+]i and [cAMP]i were carried out by using indo-1 and the cAMP indicator, del-RII-cyan FP (CFP)/CAT-yellow FP (YFP) (34). [Ca2+]i was estimated from the ratio (405 nm/470 nm) of indo-1 emission, and [cAMP]i was estimated from the reversed FRET ratio (470 nm/535 nm) of the cAMP indicator. Indo-1, CFP and YFP were excited by using the 340/10 nm, 436/10 nm and 470/30 nm filters, respectively, together with a multiband path dichroic mirror (86004, Chroma Technology). Emission signals from Ca2+ bound- and Ca2+ free-Indo-1, CFP, and YFP were collected by using 405/30, 470/30, 470/30 and 535/30 (Chroma Technology) filters mounted on a Lambda-10 filter wheel (Sutter), respectively. The emission images were analyzed as described (14, 16).
TIRF Image Acquisition and FRET Analysis. Fluorescence from single cells expressing both Cerulean- and Venus-mGluR1α was imaged by using a TIRF microscope equipped with an oil immersion objective (×60, 1.45 numerical aperture) and argon (515 nm) and helium-cadmium (442 nm) lasers (Olympus). Cerulean and Venus were excited by the 442- and 515-nm laser lines, respectively, using a double band path dichroic mirror (86002v1, Chroma Technology). Emission signals from Cerulean and Venus were collected by using S470/30 and S535/30 (Chroma Technology) filters, respectively. Images of the emission were amplified by an image intensifier unit (C8600, Hamamatsu Photonics), and then recorded by using a cooled charge-coupled device camera (CoolSNAP, Roper Scientific). A laser switching controller (Olympus) and a Lambda-10 filter exchanger (Sutter) were controlled by using metafluor imaging software (Universal Imaging). The exposure time was 100 ms, and images were collected every 3 s. Background fluorescence, obtained from nontransfected cells, was subtracted from all images. Cells were superfused continuously with bath solution by gravity at a rate of ≈3 ml/min, and each concentration of ligands was applied by changing the superfusion solution. Intermolecular FRET efficiency at each time point was estimated as NFRET (16, 35).
Statistics. All data were expressed as mean ± SEM. Statistical significance between two groups was evaluated by Student's t test, and that of treated groups against control was first verified by analysis of variance (multiple groups) and then evaluated by Dannet's t test; P < 0.05 was considered statistically significant.
Supplementary Material
Acknowledgments
We are grateful to Drs. J. Miyazaki (Osaka University, Osaka) for pCXN2 expression vector, T. Kubo (Neuroscience Research Institute, AIST, Tsukuba, Japan) for M1R cDNA, M. Nakamura (Laboratory of Life Science and Biomolecular Engineering, Yokohama, Japan) for A2aR cDNA, M. Zuccolo (Venetian Institute of Molecular Medicine, Venice) for cAMP indicator cDNA, and A. Miyawaki (RIKEN, Tokyo) for Venus cDNA. We are also grateful to Drs. T. Misaka, C. E. Clancy, and A. Collins for scientific discussion and to Ms. Y. Asai for technical support. This work was supported partly by the research grants from the Ministry of Education, Science, Sports, Culture, and Technology of Japan (to M.T. and to Y.K.) and Japan Society for the Promotion of Science (to M.T. and to Y.K.), and from foundations of Uehara and The Tokyo Biochemical Research (to M.T.) and Naitoh (to Y.K.).
Conflict of interest statement: No conflicts declared.
This paper was submitted directly (Track II) to the PNAS office.
Abbreviations: [Ca2+]i, intracellular Ca2+ concentration; mGluR1α, metabotropic glutamate receptor 1α; GPCR, G protein-coupling receptor; ECD, extracellular domain; ICD, intracellular domain; CO/A, closed–open/active; CCA, closed–closed/active; FP, fluorescent protein; 7-TM, seven-transmembrane region.
References
- 1.Aiba, A., Kano, M., Chen, C., Stanton, M. E., Fox, G. D., Herrup, K., Zwingman, T. A. & Tonegawa, S. (1994) Cell 79, 377–388. [PubMed] [Google Scholar]
- 2.Shigemoto, R., Abe, T., Nomura, S., Nakanishi, S. & Hirano, T. (1994) Neuron 12, 1245–1255. [DOI] [PubMed] [Google Scholar]
- 3.Aiba, A., Chen, C., Herrup, K., Rosenmund, C., Stevens, C. F. & Tonegawa, S. (1994) Cell 79, 365–375. [DOI] [PubMed] [Google Scholar]
- 4.Conquet, F., Bashir, Z. I., Davies, C. H., Daniel, H., Ferraguti, F., Bordi, F., Franz-Bacon, K., Reggiani, A., Matarese, V., Conde, F., et al. (1994) Nature 372, 237–243. [DOI] [PubMed] [Google Scholar]
- 5.Hermans, E. & Challiss, R. A. (2001) Biochem. J. 359, 465–484. [DOI] [PMC free article] [PubMed] [Google Scholar]
- 6.Aramori, I. & Nakanishi, S. (1992) Neuron 8, 757–765. [DOI] [PubMed] [Google Scholar]
- 7.Kubo, Y., Miyashita, T. & Murata, Y. (1998) Science 279, 1722–1725. [DOI] [PubMed] [Google Scholar]
- 8.Miyashita, T. & Kubo, Y. (2000) Receptors Channels 7, 77–91. [PubMed] [Google Scholar]
- 9.Francesconi, A. & Duvoisin, R. M. (2000) Proc. Natl. Acad. Sci. USA 97, 6185–6190. [DOI] [PMC free article] [PubMed] [Google Scholar]
- 10.Tozzi, A., Bengtson, C. P., Longone, P., Carignani, C., Fusco, F. R., Bernardi, G. & Mercuri, N. B. (2003) Eur. J. Neurosci. 18, 2133–2145. [DOI] [PubMed] [Google Scholar]
- 11.Kim, S. J., Kim, Y. S., Yuan, J. P., Petralia, R. S., Worley, P. F. & Linden, D. J. (2003) Nature 426, 285–291. [DOI] [PubMed] [Google Scholar]
- 12.Hammerland, L. G., Krapcho, K. J., Garrett, J. E., Alasti, N., Hung, B. C., Simin, R. T., Levinthal, C., Nemeth, E. F. & Fuller, F. H. (1999) Mol. Pharmacol. 55, 642–648. [PubMed] [Google Scholar]
- 13.Litschig, S., Gasparini, F., Rueegg, D., Stoehr, N., Flor, P. J., Vranesic, I., Prezeau, L., Pin, J. P., Thomsen, C. & Kuhn, R. (1999) Mol. Pharmacol. 55, 453–461. [PubMed] [Google Scholar]
- 14.Abe, H., Tateyama, M. & Kubo, Y. (2003) FEBS Lett. 545, 233–238. [DOI] [PubMed] [Google Scholar]
- 15.Kunishima, N., Shimada, Y., Tsuji, Y., Sato, T., Yamamoto, M., Kumasaka, T., Nakanishi, S., Jingami, H. & Morikawa, K. (2000) Nature 407, 971–977. [DOI] [PubMed] [Google Scholar]
- 16.Tateyama, M., Abe, H., Nakata, H., Saito, O. & Kubo, Y. (2004) Nat. Struct. Mol. Biol. 11, 637–642. [DOI] [PubMed] [Google Scholar]
- 17.Tsuchiya, D., Kunishima, N., Kamiya, N., Jingami, H. & Morikawa, K. (2002) Proc. Natl. Acad. Sci. USA 99, 2660–2665. [DOI] [PMC free article] [PubMed] [Google Scholar]
- 18.Suzuki, Y., Moriyoshi, E., Tsuchiya, D. & Jingami, H. (2004) J. Biol. Chem. 279, 35526–35534. [DOI] [PubMed] [Google Scholar]
- 19.Kenakin, T. (2003) Trends Pharmacol. Sci. 24, 346–354. [DOI] [PubMed] [Google Scholar]
- 20.Francesconi, A. & Duvoisin, R. M. (1998) J. Biol. Chem. 273, 5615–5624. [DOI] [PubMed] [Google Scholar]
- 21.Tu, J. C., Xiao, B., Yuan, J. P., Lanahan, A. A., Leoffert, K., Li, M., Linden, D. J. & Worley, P. F. (1998) Neuron 21, 717–726. [DOI] [PubMed] [Google Scholar]
- 22.Xiao, B., Tu, J. C., Petralia, R. S., Yuan, J. P., Doan, A., Breder, C. D., Ruggiero, A., Lanahan, A. A., Wenthold, R. J. & Worley, P. F. (1998) Neuron 21, 707–716. [DOI] [PubMed] [Google Scholar]
- 23.Abe, H., Misaka, T., Tateyama, M. & Kubo, Y. (2003) Mol. Cell. Neurosci. 23, 157–168. [DOI] [PubMed] [Google Scholar]
- 24.Jensen, A. A., Greenwood, J. R. & Brauner-Osborne, H. (2002) Trends Pharmacol. Sci. 23, 491–493. [DOI] [PubMed] [Google Scholar]
- 25.Farrens, D. L., Altenbach, C., Yang, K., Hubbell, W. L. & Khorana, H. G. (1996) Science 274, 768–770. [DOI] [PubMed] [Google Scholar]
- 26.Ghanouni, P., Steenhuis, J. J., Farrens, D. L. & Kobilka, B. K. (2001) Proc. Natl. Acad. Sci. USA 98, 5997–6002. [DOI] [PMC free article] [PubMed] [Google Scholar]
- 27.Vilardaga, J. P., Bunemann, M., Krasel, C., Castro, M. & Lohse, M. J. (2003) Nat. Biotechnol. 21, 807–812. [DOI] [PubMed] [Google Scholar]
- 28.Kniazeff, J., Bessis, A. S., Maurel, D., Ansanay, H., Prezeau, L. & Pin, J. P. (2004) Nat. Struct. Mol. Biol. 11, 706–713. [DOI] [PubMed] [Google Scholar]
- 29.Tabata, T., Aiba, A. & Kano, M. (2002) Mol. Cell. Neurosci. 20, 56–68. [DOI] [PubMed] [Google Scholar]
- 30.He, X., Chow, D., Martick, M. M. & Garcia, K. C. (2001) Science 293, 1657–1662. [DOI] [PubMed] [Google Scholar]
- 31.Eroglu, C., Brugger, B., Wieland, F. & Sinning, I. (2003) Proc. Natl. Acad. Sci. USA 100, 10219–10224. [DOI] [PMC free article] [PubMed] [Google Scholar]
- 32.Rizzo, M. A., Springer, G. H., Granada, B. & Piston, D. W. (2004) Nat. Biotechnol. 22, 445–449. [DOI] [PubMed] [Google Scholar]
- 33.Nagai, T., Ibata, K., Park, E. S., Kubota, M., Mikoshiba, K. & Miyawaki, A. (2002) Nat. Biotechnol. 20, 87–90.11753368 [Google Scholar]
- 34.Zaccolo, M., De Giorgi, F., Cho, C. Y., Feng, L., Knapp, T., Negulescu, P. A., Taylor, S. S., Tsien, R. Y. & Pozzan, T. (2000) Nat. Cell Biol. 2, 25–29. [DOI] [PubMed] [Google Scholar]
- 35.Xia, Z. & Liu, Y. (2001) Biophys. J. 81, 2395–2402. [DOI] [PMC free article] [PubMed] [Google Scholar]
Associated Data
This section collects any data citations, data availability statements, or supplementary materials included in this article.


