Abstract
Tracer flux experiments in isolated guard cells of Commelina communis L. suggest that the vacuolar ion content is regulated and is reset to a reduced fixed point by abscisic acid (ABA) with no significant change in cytoplasmic content. The effects of changes in external osmotic pressure were investigated by adding and removing mannitol from the bathing solution. Two effects were distinguished. In the new steady state of volume and turgor, the vacuolar ion efflux was sensitive to turgor: efflux increased at high turgor and reduced at lower turgor after the addition of mannitol. These changes were inhibited by phenylarsine oxide and are likely to involve the same channel that is involved in the response to ABA. After a hypoosmotic transfer, there was an additional effect: a fast transient stimulation of vacuolar efflux during the period of water flow into the cell; the size of this hypopeak increased with the size of the hypoosmotic shock, with increased water flow. No corresponding transient in reduced vacuolar efflux was observed upon hyperosmotic transfer. The fast hypopeak was not inhibited by phenylarsine oxide and appears to involve a different ion channel from that involved in the resting efflux, the response to ABA, or the turgor sensitivity. Thus, the tonoplast can sense an osmotic gradient and respond to water flow into the vacuole by increased vacuolar ion efflux, thereby minimizing cytoplasmic dilution. An aquaporin is the most likely sensor and may also be involved in the signal transduction chain.
Keywords: aquaporin, hypoosmotic shock, phenylarsine oxide, tonoplast ion channels, stomata
Stomatal closure, essential for plant survival in dry conditions, requires net efflux of potassium salt at both the plasmalemma and the tonoplast of the guard cell, resulting in guard cell shrinkage, loss of turgor, and reduction in stomatal aperture. Ion release across the tonoplast is essential for stomatal closure, but the mechanisms that control this flux, and the nature of the associated signaling chains, are not well understood. Flux studies (1, 2) have shown that the addition of abscisic acid (ABA) produces a transient stimulation of the rate of 86Rb+ release from guard cell vacuoles, but the rate then returns to a value very close to that before the addition of ABA. This finding suggests that the effect of ABA is not a permanent change in ion permeability but rather modulation of a regulatory system, with a change in the “set-point” of a control system. This idea is strengthened by detailed comparison of efflux transients at different concentrations of ABA (3). At low concentrations of ABA, the vacuolar efflux transient is delayed and the peak height is reduced, but the same end-point is reached as that reached at optimal concentrations of ABA. Detailed comparison shows that the relative efflux stimulation during the vacuolar transient tracks the declining ion content, and that at different concentrations of ABA, both the peak and the end of the transient are reached at the same ion content but at different times. This finding suggests a regulated process of vacuolar efflux, sensitive to ion content, whose set-point is reduced by ABA. Upon adding ABA, the ion content (or associated variable, such as turgor) is registered as “wrong,” differing from the new set-point, and the vacuolar efflux is stimulated. As the content falls and the discrepancy reduces, the vacuolar efflux tracks the ion content over different time scales at different ABA concentrations.
One possibility is that the vacuolar efflux is pressure-sensitive, regulating to a set-point of pressure, and this article reports the effects of external osmotic changes on vacuolar ion efflux. Upon changing the osmotic pressure of the external solution, there will be a period of a few minutes during which water flows into or out of the cell, establishing a new state of turgor and internal osmotic pressure in water equilibrium with the new external osmotic pressure. This period may be followed by a period of ionic adjustment, if the ion fluxes are sensitive to pressure, and the ion content (or pressure) regulates to the set-point. Vacuolar tracer efflux was followed after an up- or down-shift of external osmotic pressure, and two effects were found. After the first few minutes, the vacuolar ion efflux was indeed sensitive to pressure, increased at higher turgor (after hypoosmotic change), and reduced at low turgor (after hyperosmotic change). But a much larger transient stimulation of vacuolar efflux was also observed during the first few minutes of hypoosmotic treatment, the period of water flow into the cell; no converse effect of reduced vacuolar ion efflux during water flow out of the cell after hyperosmotic transfer was observed. The slower changes reflecting the sensitivity to pressure are blocked by phenylarsine oxide (PAO), which blocks the resting and ABA-stimulated vacuolar efflux (4), suggesting that these slow changes involve the normal ABA-sensitive channel. In marked contrast, the initial transient associated with a hypoosmotic transfer is not inhibited by PAO and therefore appears to involve a separate process or channel. Such independence is also suggested by comparison of the hypoosmotic transients in the presence and absence of ABA.
Results
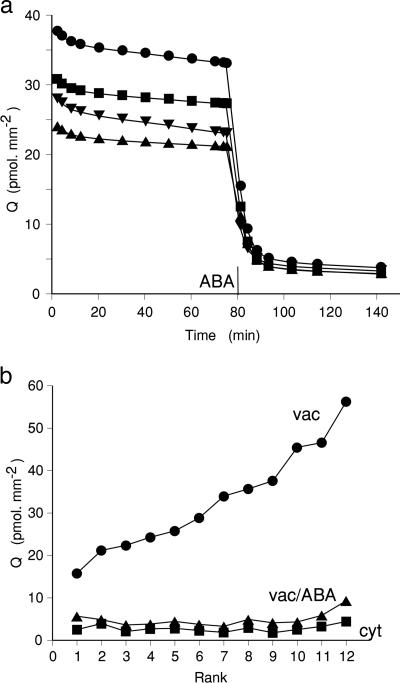
ABA-Sensitive Regulation of Vacuolar Ion Content. The clearest evidence for the existence of an ABA-sensitive regulation of vacuolar ion content was seen in an experiment in which the range of 86Rb+ content after overnight loading was unusually wide and the ABA-induced efflux transient was particularly large. Fig. 1a shows a plot of tracer content against time during washout, with ABA added at 80 min. At this time, after an initial period of faster cytoplasmic exchange, the tracer remaining in the tissue is essentially vacuolar. What is striking is that the wide variability in vacuolar content before ABA is added is not reproduced in the vacuolar content after the efflux transient. For each of the 12 strips measured in this experiment, the first 80 min of washout was fitted to two exponentials, allowing estimation of cytoplasmic and vacuolar content, Qc and Qv, respectively. Strips were rank-ordered by their vacuolar content, and Fig. 1b shows vacuolar and cytoplasmic contents before ABA and vacuolar content after the ABA-induced efflux transient plotted against this rank order. Two points are important. First, it is clear that the wide variability in content before ABA reflects differences in the vacuolar content, with the same cytoplasmic content over the whole range. Also, after ABA treatment, the vacuolar content regulates to the same much reduced value in all strips. The results suggest a regulatory system involving vacuolar content (volume), which can be reset by ABA to a new set-point. Cells of differing vacuolar volume will also have different turgor pressures, and it may well be that pressure is the variable to be sensed and regulated.
Fig. 1.
Regulation of vacuolar content: ABA resets the vacuolar content to a reduced set-point. (a) Tracer content plotted against time for washout of four replicate strips. ABA (10 μM) was added after 80 min of washout. (b) Washout curves to 80 min were fitted to two exponentials, allowing calculation of cytoplasmic and vacuolar content at the start of the washout. Cytoplasmic (cyt) and vacuolar (vac) contents in 12 replicate strips were plotted against rank order of total content. The level of vacuolar content after ABA treatment (vac/ABA) is also shown.
The effect of ABA on cytoplasmic content was also assessed by a comparison of washout curves in the presence and absence of ABA. In the ABA treatment, after overnight loading in the absence of ABA, ABA was added to the radioactive solution for a final loading period (significantly longer than the ABA-induced efflux transient), followed by washout in the presence of ABA. Washout curves were fitted to two exponentials, and cytoplasmic and vacuolar content were calculated. In one such experiment (at 20 mM Rb+), ABA reduced the vacuolar content from 48 ± 4 to 34 ± 6 pmol·mm–2, whereas the respective cytoplasmic contents were 13.1 ± 0.9 and 13.9 ± 1.3 pmol·mm–2. Two further experiments gave similar results. Again, this finding suggests an ABA-sensitive control system regulating vacuolar content.
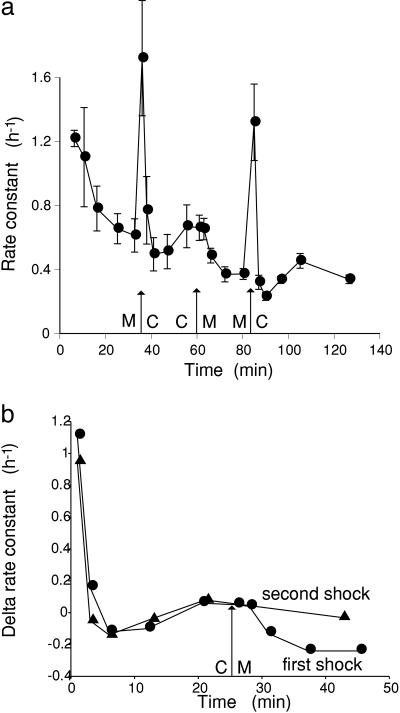
Effect of Changes of External Osmotic Pressure on Vacuolar Efflux. The experiment shown in Fig. 2a, a plot of rate constant for efflux against time, demonstrates the effect on vacuolar efflux of adding or removing 150 mM mannitol from the external bathing solution. Tissue was loaded in the presence of 150 mM mannitol, washed out for 35 min in the presence of mannitol, and then given a hypoosmotic shock by removing mannitol. A marked transient stimulation of vacuolar efflux was observed for the first few minutes, with a gradual rise after this transient to an approximately steady level. After 25 min in the hypoosmotic solution, mannitol was readded, and the vacuolar efflux fell; finally, after 24 min in mannitol, a second hypoosmotic shock was given, and a second large transient was observed. The two transients are compared in Fig. 2b, which is a plot of the difference in rate constant relative to the value before the first hypoosmotic shock. Two effects can be distinguished. The first is a large, fast transient, of high efflux in the first few minutes of hypoosmotic shock, corresponding to the period in which water will be flowing into the cells. Time courses of volume changes have been measured (5) but not accurately, and the time course of efflux is not well resolved; nevertheless, this first transient does correspond to the period of water influx. There is no corresponding transient reduction in efflux after a hyperosmotic change during the period when water is flowing out of the cell. The second effect is a slower response, >10–15 min after the change, showing higher vacuolar efflux at higher turgor after the removal of mannitol outside and the reduction in vacuolar efflux at lower turgor upon the addition of mannitol. In this experiment, the efflux in 150 mM mannitol was reduced to 0.55 ± 0.17 of that in the absence of mannitol, and the range in five such experiments was 0.27–0.65, with a mean of 0.52 ± 0.06 (5).
Fig. 2.
Effect of hypoosmotic and hyperosmotic transfers on tracer efflux. (a) Tissue was loaded in the presence of 150 mM mannitol in the bathing solution. After washout for 35 min in the presence of mannitol (M), tissue was transferred to control solution (C) without mannitol for 25 min before being returned to mannitol; after an additional 24 min, a second hypoosmotic shock was applied by again removing mannitol. Rate constant for exchange (rate of loss of tracer/tracer content, in h–1) plotted against time. Each point shows the mean ± SEM of four replicate strips. (b) Comparison of the two hypoosmotic shocks. The delta rate constant, the difference in rate constant from the value before the first shock, is plotted against time after the first hypoosmotic shock. In the first shock, tissue was returned to mannitol at 25 min (arrow), whereas in the second shock, the tissue remained in the hypoosmotic solution. Each point shows the mean of four replicate strips.
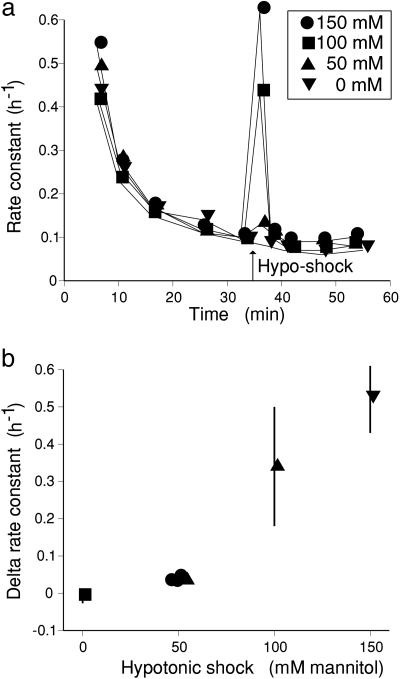
The size of the initial hypoosmotic transient depends on the size of the shock, as shown in Fig. 3. Four sets of tissue were loaded in 150 mM mannitol, washed out for 35 min in mannitol, and then transferred to 0 mM mannitol in one, two, or three steps, thus applying hypoosmotic shocks of 150, 100, or 50 mM mannitol (four values), with also a control left in mannitol. Fig. 3a shows efflux curves for hypoosmotic shocks of 0, 50, 100, or 150 mM mannitol; a transient is seen with a shock of 50 mM mannitol, but its size increases with the size of the shock. In Fig. 3b, the change in rate constant to the peak is plotted against the size of the shock. It is important to note that a 50 mM shock produces the same increase in the rate constant whether induced by a change from 150 to 100, 100 to 50, or 50 to 0 mM mannitol; thus, the size of the shock, setting the rate of water flow, determines the peak, not the absolute value of turgor.
Fig. 3.
Effect of the size of the hypoosmotic shock on the peak rate constant. Tissue was loaded in the presence of 150 mM mannitol and washed out for 35 min in the presence of mannitol. Replicate sets of four strips were then transferred to 0 mM mannitol in 1, 2, or 3 stages or left in mannitol throughout. Transfer sequences in mM mannitol were as follows: 150 to 0, 150 to 50 to 0, and 150 to 100 to 50 to 0. (a) Rate constant for exchange (h–1) plotted against time for the first hypoosmotic transfers for shocks of 150, 100, 50, and 0 mM mannitol. Each point is the mean of four replicate strips. (b) Peak values of delta rate constant (difference from preshock value) plotted against size of hypoosmotic shock. There are four values for shocks of 50 mM mannitol, corresponding to transfers from 150 to 100, 100 to 50, and 50 to 0 (two values). For clarity, errors are not shown for the 50 mM shocks.
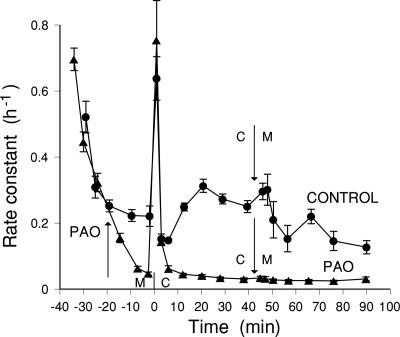
The resting tonoplast efflux and the ABA-induced efflux transients are both very sensitive to PAO (4), and the effect of this inhibitor was therefore tested on the osmotic responses. Fig. 4 shows that PAO does not inhibit the initial hypoosmotic transient peak but that it does abolish the slow responses to hypo- or hyperosmotic changes. The initial hypoosmotic transient started from a lower level in PAO, but the PAO peak reached a higher level than the control peak; measured as the increase in rate constant relative to the preshock value, the PAO peak was significantly greater than the control (P < 0.05). A second experiment gave very similar results. This finding suggests that the slow responses reflect changes in the usual efflux pathway, whereas the hypopeak, the initial transient of stimulated efflux while water is flowing into the cell, involves a different pathway.
Fig. 4.
Effect of PAO on responses to hypoosmotic and hyperosmotic transfers. Loading and initial washout in the presence of 150 mM mannitol (M) before hypoosmotic shock (0 mM mannitol, C) is given at zero time on the graph. Control shock was given at 35 min of washout and PAO shock was given at 40 min of washout after the addition of 25 μM PAO at 20 min. Mannitol was readded after 45 min in hypoosmotic solution.
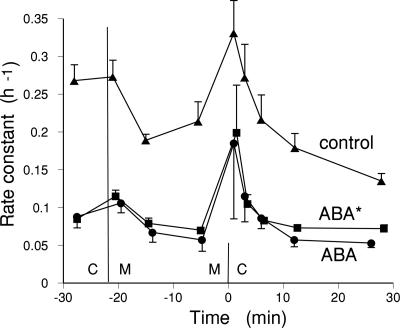
The Hypopeak and the ABA-Peak Are Independent. Four experiments were done to test whether the size of the hypopeak was affected by ABA. In the first experiment, guard cells were subjected to a hypoosmotic shock (removal of 150 mM mannitol) before or after treatment with ABA. The size of the hypopeak was equal in the presence and absence of ABA, and the size of the ABA-induced efflux transient was not affected by a previous hypoosmotic shock. In this experiment, the rate constants after the peaks were very similar to those before the transients, but in a second experiment, the rate constant after ABA treatment was much less than that before treatment. This experiment provides a more telling comparison, which is shown in Fig. 5. This graph shows hypopeaks (removal of 100 mM mannitol) in the absence of ABA, in tissue treated with ABA before the hypoosmotic shock, and in tissue in which ABA was added for the last 100 min of loading and for the entire washout. The size of the hypopeaks, the increase in rate constant over the preshock value, was very similar in all treatments, although the preshock values were very different. Two further experiments gave similar results, and in one of these experiments, hypopeaks measured on the same strips were equal before and after ABA treatment. As with the PAO experiments, these results suggest that independent pathways are involved in the ABA-induced transients and in the hypoosmotic transients.
Fig. 5.
Hypoosmotic efflux transient is independent of ABA. Shown are hypoosmotic transients in the presence and absence of ABA. The rate constant for efflux (h–1) is plotted against time. Loading and initial washout in 0 mM mannitol was followed by transfer to 100 mM mannitol before or after an ABA-induced transient. Control, mannitol after 40 min and hypoosmotic transfer after 23 min in mannitol; ABA, ABA at 40 min, followed by transfer to mannitol at 97 min and hypoosmotic shock 22 min later; ABA*, ABA for the last 100 min of loading and throughout the washout, 40 min of washout in 0 mM mannitol, followed by transfer to mannitol for 23 min before hypoosmotic shock.
Discussion
It has been argued previously that the ion efflux at the tonoplast is regulated by vacuolar ion content (or associated variable) in a control system whose set-point is reset to a lower value by ABA. The experiment shown in Fig. 1, in which the natural variability within replicate samples was unusually wide, demonstrates more clearly that it is specifically the vacuolar content that is subject to this regulation. The results show that before ABA treatment, guard cells in different strips had the same cytoplasmic content over a wide range of vacuolar ion content, but that after ABA treatment, the variability in vacuolar content was markedly reduced; all samples regulated to the new ABA-determined set-point. In other experiments, addition of ABA for the final period of tracer loading allowed comparison of cytoplasmic and vacuolar content before and after ABA, and this comparison showed that ABA reduced vacuolar content with no significant change in cytoplasmic content.
There is evidence for turgor regulation in many plant cells (see review in ref. 6), although most detailed studies have been done in algae. Sensing and regulation of vacuolar volume would most easily be achieved if vacuolar ion fluxes were sensitive to cell turgor; that is, if changes in pressure (presumably perceived at the plasmalemma) translated into a signal affecting ion fluxes at the tonoplast. External osmotic changes, by adding and removing mannitol from the medium, did indeed affect the tonoplast ion efflux. Two effects on vacuolar efflux could be distinguished. The first is a large, fast transient of high efflux in the first few minutes of hypoosmotic shock, corresponding to the period in which water will be flowing into the cells but with no corresponding transient reduction in efflux after a hyperosmotic change during the period when water is flowing out of the cell. The second effect is a slower response after a new cell volume and turgor have been established, and this response reflects the effect of turgor on vacuolar ion efflux.
Pressure-Sensitivity of Vacuolar Efflux: The Slow Response. The results show reduction in vacuolar efflux at lower turgor upon addition of mannitol outside and higher vacuolar efflux at higher turgor after removal of external mannitol; on average, the efflux in 150 mM mannitol was reduced to 0.52 ± 0.06 (5) of that in the absence of mannitol. This sensitivity provides a mechanism for osmoregulation; high turgor increases vacuolar ion efflux, reducing vacuolar volume and hence turgor, whereas at low turgor, the vacuolar ion efflux is reduced, helping to restore vacuolar volume and turgor. These changes are abolished by PAO, suggesting modulation of the activity of the normal tonoplast channel, which is involved in the response to ABA. The ABA response is triggered by increase in cytoplasmic Ca2+ (7), and similar control is likely in the osmotic responses, in the sensitivity to turgor.
This suggestion is supported by a number of studies showing transient increases in cytoplasmic Ca2+ in response to hypoosmotic shock in various plant cells. It was first demonstrated in the giant alga, Lamprothamnium, as part of the osmoregulatory system in that cell (8) but has since been observed in Fucus rhizoids (9, 10) and tobacco cells in culture (11, 12). The Ca2+ transient is usually biphasic, with an initial rise attributed to Ca2+ influx followed by a more prolonged second phase attributed to release of Ca2+ from internal stores. A stretch-activated, Ca2+-permeable channel in the plasmalemma was identified as the source of the initial Ca2+ influx in Fucus (9), and several stretch-activated channels have also been identified in guard cells, permeable to K+, Ca2+, and Cl– (13). There is also evidence of osmotically sensitive changes in cytoplasmic Ca2+ in guard cells from the effect of external osmotic changes on the pattern of Ca2+ oscillations (14); oscillations were suppressed upon the addition of 350 mM mannitol to the bathing medium but were restored upon removal of mannitol, whereas 150 mM mannitol generated slower oscillations of smaller amplitude. The concentration of Ca2+, averaged over the cycle, appeared to increase with turgor.
An increase in cytoplasmic Ca2+ could activate a Ca2+-sensitive tonoplast channel, and it should be noted that efflux of salt from the vacuole could be triggered by activation of either the anion or the cation; once the primary channel is activated, the membrane potential will change until it reaches the electroneutral position of equal flux of the charge balancing ion. Thus, although efflux of Rb+ is measured here, the response could be initiated by activation of a Cl– channel.
A stretch-activated, Ca2+-permeable channel provides a mechanism for direct activation of Ca2+-sensitive vacuolar efflux after a hypoosmotic transfer, but there may also be other less direct signaling chains leading to other consequences. In yeast, the hypoosmotic and hyperosmotic responses involve initiation of different kinases leading into different mitogen-activated protein (MAP) kinase cascades (15, 16); hypoosmotic transfer activates PKC1 (PKC-like), whereas hyperosmotic transfer activates Sln1, a His kinase leading to the high-osmolarity glycerol (HOG) MAP kinase pathway. A recent review discusses evidence for the involvement of MAP kinase in hyperosmotic signaling in plants (17). Blocking activation of MAP kinase by PD98059 produces a partial inhibition of ABA-induced stomatal closure (18) and of the ABA-induced efflux transient (unpublished work); it is possible that MAP kinase is also involved in the osmotic responses.
Initial Fast Hypoosmotic Efflux Transient. The initial response to a hypoosmotic shock is a large, short-lived increase in vacuolar efflux, for the first few minutes. The time course is not well defined but corresponds to the time course of cell swelling observed microscopically (5), the period when water is flowing into the cell, setting up a new state of increased volume and turgor in water equilibrium with a new external osmotic pressure. The peak height increases with the size of the shock and with the rate of water inflow. It should be noted that the vacuolar ion efflux is moving against the direction of water flow, so we are concerned with activation of a process of ion efflux, not with ions being dragged with the water flow. This situation differs from the effect of water flow on the K+ channels in the plasmalemma (19), where both inward and outward K+ currents are enhanced in the direction of water flow and inhibited by an opposing water flow. Because the water permeability of tonoplast membranes seems to be much greater than that at the plasmalemma (20), the rate of water flow will be nearly equal at the two membranes during the swelling process (21). It is striking that this fast transient occurs only in response to a hypoosmotic shock, with no corresponding transient reduction after a hyperosmotic transfer. The transient's effect will be to minimize cytoplasmic dilution, providing a physiological function for this effect.
The aperture change for a shift of 150 mM mannitol was 2–4 μm, giving an area change of 4–6% (estimated from Nomarski images of guard cells). Delivery of exocytotic vesicles increases membrane area during osmotically induced swelling (22–25), but given the 50-fold difference in volume/area ratio of cell and vesicle, the associated volume change will be very small. Thus, the vesicles will not discharge significant tracer (whatever their specific activity) and cannot be responsible for the initial transient.
The fast hypopeak seems to be independent of the ABA-induced peak. Most critically, the fast hypopeak is not inhibited by PAO, which blocks the resting tonoplast efflux and abolishes both the ABA-induced transient and the slower turgor-sensitive changes. The fast hypopeak correlates with water flow, in size and timing, and precedes the establishment of the new steady state of altered turgor. The results suggest that the turgor sensitivity and the ABA response share signaling pathways but that the fast hypopeak requires separate signaling processes.
The fast transient implies that a mechanism for sensing and responding to an osmotic gradient exists in the tonoplast membrane; an aquaporin is the most likely candidate for a sensor, but the nature of potential signaling elements is unknown. The existence and functions of aquaporins in plants have been reviewed (21, 26). The subgroup TIP is localized to the tonoplast and has 10–11 homologues in the Arabidopsis genome. In sunflower guard cells, there appear to be two tonoplast aquaporins expressed, SunTIP7 and SunTIP20, and the level of the SunTIP7 mRNA is markedly increased in conditions promoting stomatal closure, either in the diurnal cycle or in water stress (27).
Hill et al. (28) have recently suggested that an important function of aquaporins in cells is to act as detectors of osmotic and turgor pressure gradients and to relay this information to signaling chains in control systems. Aquaporins consist of tetramers in which each monomer forms an hourglass shape with a narrow, water-filled channel in the center of the membrane, which is is flanked by outer and inner atria. Exclusion of osmotic solutes from the atrium will create a negative pressure within the atrium, leading to deformation of the channel protein. The presence of an osmotic gradient will create a pressure gradient between the two atria, the driving force for water flow through the central channel, but will also produce unequal strain and deformation in the two halves of the molecule. A pressure gradient across the membrane will produce similar asymmetric deformations. Thus, each monomer is capable of sensing either pressure or osmotic gradients through its protein conformation. Work on Chara, root cortical cells, and the aquaporin NOD26 shows changes in water permeability in response to pressure or osmotic conditions (29–32), providing good evidence for such protein deformation. An aquaporin is therefore a strong candidate for the osmotic gradient sensor that is responsible for triggering the fast hypoosmotic transient.
The Hill hypothesis suggests that aquaporins may also interact with downstream signaling elements. The suggestion is that aquaporins may share properties with other tetrameric proteins such as, for example, hemoglobin, in that they exist in two configurations and switch between them; the proposal is that increasing monomer strain can induce such transitions. Interaction of either configuration with cell signaling systems can then lead to changes in membrane properties in response to changing osmotic gradients. The Hill hypothesis does not specify the nature of the signaling chains. A speculative hypothesis to explain the present results could involve a tonoplast membrane complex containing an aquaporin and an ion channel and in which deformation of the aquaporin influenced conformation of the ion channel. In the presence of an osmotic gradient across the tonoplast, the deformation will be asymmetric between the two atria. If higher pressure in the cytoplasmic atrium were required to produce the conformational change in the aquaporin protein leading to activation of the associated ion channel, then there would be asymmetry in the response; there would be a hypoosmotic peak but no response to a hyperosmotic transfer. A tonoplast channel sensitive to hydrostatic or osmotic pressure gradients has been described (33) from patch clamp recordings in isolated beet vacuoles, but the channel responded to both hyperosmotic and hypoosmotic gradients with no asymmetry in the response. An alternative would be ion permeation through the aquaporin in the stressed, deformed state; in general, aquaporins are not ion-permeable, but NOD26, bovine lens MIP, and Hg+-treated AQP6 (intracellular vesicles) can act as ion channels (34–37). However, although it seems likely that a tonoplast aquaporin is involved as the osmotic sensor, signaling and response elements downstream remain unknown.
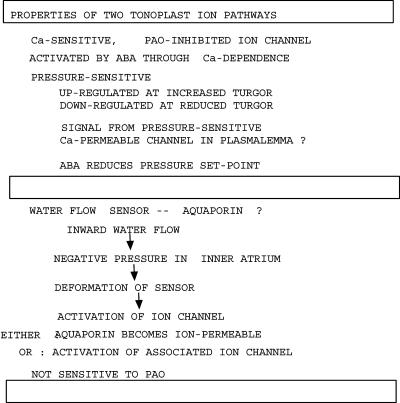
The results suggest two independent vacuolar flux systems involving different channels and signaling mechanisms. The channel involved in the fast hypoosmotic response seems to be distinct from that involved in the ABA response or in the sensitivity to turgor pressure. Fig. 6 summarizes the properties of each as well as speculative signaling connections.
Fig. 6.
Postulated properties of two independent vacuolar ion channels. The first is the Ca2+-sensitive, PAO-inhibited channel involved in ABA signaling and in the pressure sensitivity. The second system is responsible for the fast hypoosmotic transient, responding to inward water flow by activation of an ion channel. It is likely to involve an aquaporin as a sensor, signaling water flow by asymmetric deformation of the aquaporin protein. The aquaporin may become ion-permeable as a result or, alternatively, may signal its deformation to an associated ion channel, thereby activating it.
Methods
Flux was measured as described in ref. 4. Isolated guard cells of Commelina communis L. were prepared by treatment of epidermal strips at low pH to kill all cells other than guard cells. Cells were loaded by incubation overnight (≈16 h) in solutions containing 2 mM RbCl, 0.1 mM CaCl2, and 10 mM Pipes (pH 6) and labeled with 86Rb+ (Amersham Pharmacia). Thus, Rb+ is used as an analogue for K+ and not as a tracer. Effluxes were measured by transferring individual strips to successive 0.75-ml portions of nonradioactive solutions in the wells of plastic culture chambers on a vibrating shaker and counting both these washout solutions and the residue left in the tissue at the end of the efflux.
Tracer was expressed as pmol·mm–2 on the basis of the area of each individual strip, and the rate of loss was calculated for each time interval. During the washout, the total tracer content in the tissue (Q*) will be represented by the sum of two exponentials, reflecting exchange in two compartments, the cytoplasm (fast component) and the vacuole (slow component). The rate constant for exchange (h–1) was calculated as (rate of loss of tracer)/(tracer content) and plotted against time. In constant conditions, the rate constant falls with time as the cytoplasmic efflux proceeds, reaching a steady value equal to the rate constant for vacuolar exchange when the slow phase is reached. When conditions are changed during the slow phase of exchange, the effect on the vacuolar flux can be assessed.
Curves of tracer content against time were fitted to two exponentials, and cytoplasmic and vacuolar contents (Qc and Qv) were calculated from the intercepts and rate constants of this fitting (38).
Acknowledgments
Technical help from John Banfield is gratefully acknowledged. This work was supported, in part, by an Emeritus Fellowship from the Leverhulme Trust.
Conflict of interest statement: No conflicts declared.
Abbreviations: ABA, abscisic acid; PAO, phenylarsine oxide; MAP, mitogen-activated protein.
References
- 1.MacRobbie, E. A. C. (1981) J. Exp. Bot. 32, 563–572. [Google Scholar]
- 2.MacRobbie, E. A. C. (1990) Proc. R. Soc. London Ser. B 241, 214–219. [Google Scholar]
- 3.MacRobbie, E. A. C. (1995) Plant J. 7, 565–576. [Google Scholar]
- 4.MacRobbie, E. A. C. (2002) Proc. Natl. Acad. Sci. USA 99, 11963–11968. [DOI] [PMC free article] [PubMed] [Google Scholar]
- 5.MacRobbie, E. A. C. (1980) J. Membr. Biol. 53, 189–198. [Google Scholar]
- 6.Findlay, G. P. (2001) Aust. J. Biol. Sci. 28, 617–634. [Google Scholar]
- 7.MacRobbie, E. A. C. (2000) Proc. Natl. Acad. Sci. USA 97, 12361–12368. [DOI] [PMC free article] [PubMed] [Google Scholar]
- 8.Okazaki, Y. & Tazawa, M. (1990) J. Membr. Biol. 114, 189–194. [DOI] [PubMed] [Google Scholar]
- 9.Taylor, A. R., Manison, N. F. H., Fernandez, C., Wood, J. & Brownlee, C. (1996) Plant Cell 8, 2015–2031. [DOI] [PMC free article] [PubMed] [Google Scholar]
- 10.Goddard, H., Manison, N. F. H., Tomos, D. & Brownlee, C. (2000) Proc. Natl. Acad. Sci. USA 97, 1932–1937. [DOI] [PMC free article] [PubMed] [Google Scholar]
- 11.Takahashi, K., Isobe, M., Knight, M. R., Trewavas, A. J. & Muto, S. (1997) Plant Physiol. 113, 587–694. [DOI] [PMC free article] [PubMed] [Google Scholar]
- 12.Cessna, S. G., Chandra, P. S. & Low, P. S. (1998) J. Biol. Chem. 273, 27286–27291. [DOI] [PubMed] [Google Scholar]
- 13.Cosgrove, D. J. & Hedrich, R. (1991) Planta 186, 143–153. [DOI] [PubMed] [Google Scholar]
- 14.Hetherington, A. M., Gray, J. E., Leckie, C. P., McAinsh, M. R., Pical, C., Priestley, A. J., Staxen, I. & Webb, A. A. R. (1998) Philos. Trans. R. Soc. London B 353, 1489–1494. [Google Scholar]
- 15.Davenport, K. R., Sohaskey, M., Kamada, Y., Levin, D. E. & Gustin, M. C. (1995) J. Biol. Chem. 270, 30157–30161. [DOI] [PubMed] [Google Scholar]
- 16.Reiser, V., Raitt, D. C. & Saito, H. (2003) J. Cell Biol. 161, 1035–1040. [DOI] [PMC free article] [PubMed] [Google Scholar]
- 17.Boudsocq, M. & Lairière, C. (2005) Plant Physiol. 138, 1185–1194. [DOI] [PMC free article] [PubMed] [Google Scholar]
- 18.Burnett, E. K., Desikhan, R., Moser, R. C. & Neill, S. J. (2000) J. Exp. Bot. 51, 197–205. [DOI] [PubMed] [Google Scholar]
- 19.Liu, K. & Luan, S. (1998) Plant Cell 10, 1957–1970. [DOI] [PMC free article] [PubMed] [Google Scholar]
- 20.Niemietz, C. M. & Tyermann, S. D. (1997) Plant Physiol. 115, 561–567. [DOI] [PMC free article] [PubMed] [Google Scholar]
- 21.Tyerman, S. D., Bohnert, H. J., Maurel, C., Steudle, E. & Smith, J. A. C. (1999) J. Exp. Bot. 50, 1055–1071. [Google Scholar]
- 22.Homann, U. (1998) Planta 206, 329–333. [Google Scholar]
- 23.Kubitscheck, J., Homann, U. & Thiel, G. (2000) Planta 210, 423–431. [DOI] [PubMed] [Google Scholar]
- 24.Hurst, A. C., Meckel, T., Tayafen, S., Thiel, G. & Homann, U. (2004) Plant J. 37, 391–397. [DOI] [PubMed] [Google Scholar]
- 25.Shope, J. C., DeWald, D. B. & Mott, K. A. (2003) Plant Physiol. 133, 1314–1321. [DOI] [PMC free article] [PubMed] [Google Scholar]
- 26.Luu, D.-T. & Maurel, C. (2005) Plant Cell Environ. 28, 85–96. [Google Scholar]
- 27.Sarda, X., Tousch, D., Ferrare, K., Legrand, E., Dupuis, J. M., Casse-Delbart, F. & Lamaze, T. (1997) Plant J. 12, 1103–1111. [DOI] [PubMed] [Google Scholar]
- 28.Hill, A. E., Shachar-Hill, B. & Shachar-Hill, Y. (2004) J. Membr. Biol. 197, 1–32. [DOI] [PubMed] [Google Scholar]
- 29.Wan, X., Steudle, E. & Hartung, W. (2004) J. Exp. Bot. 55, 411–422. [DOI] [PubMed] [Google Scholar]
- 30.Ye, Q., Wiera, B. & Steudle, E. (2004) J. Exp. Bot. 55, 449–461. [DOI] [PubMed] [Google Scholar]
- 31.Ye, Q., Muhr, J. & Steudle, E. (2005) Plant Cell Environ. 28, 525–535. [Google Scholar]
- 32.Vandeleur, R., Niemietz, C., Tilbrook, J. & Tyerman, S. D. (2005) Plant Soil 274, 141–161. [Google Scholar]
- 33.Alexandre, J. & Lassalles, J. P. (1991) Biophys. J. 60, 1326–1336. [DOI] [PMC free article] [PubMed] [Google Scholar]
- 34.Ehring, G. R., Zampichi, G., Horowitz, J., Bok, D. & Hall, J. E. (1990) J. Gen. Physiol. 96, 631–664. [DOI] [PMC free article] [PubMed] [Google Scholar]
- 35.Weaver, C. D., Shomer, N. H., Louis, C. F. & Roberts, D. M. (1994) J. Biol. Chem. 269, 17858–17862. [PubMed] [Google Scholar]
- 36.Lee, J. W., Zhang, Y., Weaver, C. D., Shomer, N. H., Louis, C. F. & Toberts, D. M. (1995) J. Biol. Chem. 270, 27051–27057. [DOI] [PubMed] [Google Scholar]
- 37.Hazama, A., Kozono, D., Guggino, W. F., Agre, P. & Yasui, M. (2002) J. Biol. Chem. 277, 29224–29230. [DOI] [PubMed] [Google Scholar]
- 38.MacRobbie, E. A. C. (1981) J. Exp. Bot. 32, 545–562. [Google Scholar]


