Abstract
Despite a large number of studies on the role of oxygen in cellular processes, there is no consensus as to how oxygen availability to the cell should be defined, let alone how it should be quantified. Here, a quantitative definition for oxygen availability (perceived aerobiosis) is presented; the definition is based on a calibration with reference to the minimal oxygen supply rate needed for fully oxidative catabolism (i.e., complete conversion of the energy source to CO2 and water for glucose-limited conditions). This quantitative method is used to show how steady-state electron fluxes through the alternative cytochrome oxidases of Escherichia coli are distributed as a function of the extent of aerobiosis of glucose-limited chemostat cultures. At low oxygen availability the electron flux is mainly via the high-affinity cytochrome bd oxidase, and, at higher oxygen availability, a similar phenomenon occurs but now via the low-affinity cytochrome bo oxidase. The main finding is that the catabolic activities of E. coli (and specifically its respiratory activity) are affected by the actual oxygen availability per unit of biomass rather than by the residual dissolved oxygen concentration of the culture.
The terms microaerobic, microoxic, and semiaerobic conditions are frequently used to describe growth conditions where oxygen is present in subsaturating amounts. The first attempt to come to some quantification of oxygen availability was made by Pasteur, who classified oxygen availability as very aerobic, aerobic, anaerobic, and very anaerobic (17). Later, Harrison and Pirt divided oxygen availability into three “states”: limited-oxygen state, transition state, and excess-oxygen state (9). Despite the fact that this is a broad range of different conditions, ranging from almost anaerobic (trace amounts of oxygen are present) to almost aerobic, no strict quantitative definition of these conditions exists. Various approaches to quantify the extent of oxygenation of the environment and to study the corresponding cellular response have been used.
To this end, cultures are often provided with varying, well-controlled amounts of oxygen in the inflowing gas mixture (i.e., variable partial pressures of oxygen in the gas phase, expressed as percentages of O2 in the input gas). When liquid cultures are used, however, this approach does not allow one to compare results obtained from different experimental setups since it has been demonstrated earlier (18) that similar oxygen inputs can result in widely different responses of cells. The reverse is also true, i.e., identical responses can be observed for seemingly different levels of oxygen input (18). This is due to the fact that the actual supply rate of O2 in the gas phase does not define the availability of dissolved oxygen to the individual cell because the latter is dependent on the Kl,a value (the rate of oxygen transfer from the gaseous to the liquid phase) (8), and therefore on the geometry of the system, and also on the biomass concentration and its specific rate of oxygen consumption (the O2 consumed per unit of biomass per unit of time).
A more direct measure of the extent to which oxygen is available to growing cells seems to be the dissolved oxygen tension (expressed as partial pressure in millibars, in micromolar, or as a percentage of air saturation), which can be monitored by the use of an oxygen electrode. However, the steady-state residual dissolved-oxygen tension (rDOT; the ambient oxygen concentration) is a complex parameter determined by the oxygen input rate, the stirring rate, the chemical composition of the medium, the biomass concentration, and the specific respiratory activity of the organisms. A number of recent studies have used rDOT as a variable to describe the cellular response to different microaerobic conditions (2, 3, 5). Harrison and Pirt (9) and Wimpenny and Necklen (21) were the first to monitor (residual) dissolved-oxygen concentration in continuous cultures of Klebsiella aerogenes and Escherichia coli, respectively, grown with variable oxygen supply. Surprisingly, with increasing oxygen input concentrations, no significant changes in the residual dissolved-oxygen concentration, up to a threshold value of the oxygen supply rate, were observed. This observation was ascribed to the relative insensitivity of the oxygen electrode. It was speculated that the redox potential rather than the dissolved oxygen concentration would be the more suitable parameter to describe cellular responses under microaerobic conditions (21). However, unambiguous interpretation of the reading of a redox electrode is hampered by the fact that (i) growth media often contain components of multiple redox couples, which mostly are not in mutual equilibrium, and (ii) it is unknown whether the cells under study are sensitive to the same redox couples as the electrode is. Lawford and Rousseau (13) varied Kl,a (millimoles of O2 per liter per hour) by adjusting the agitation rate and air sparging rate to study the effect of oxygen availability on ethanol production by a recombinant ethanologenic E. coli. This method does not allow for quantification since the Kl,a value can only be determined for an experimental setup in the absence of cells. The presence of cells (and the products of cellular metabolism) may change the solubility of oxygen, due to changes in water activity, and may change the oxygen transfer rate, due to changes in the viscosity of the solution. Moreover, this approach does not take into account the respiratory activity of biomass, and hence a variation in this activity will alter the actual oxygen availability for individual cells.
Because the activity and amount of biomass affect the steady-state availability of oxygen as well as the culture system itself, the specific dissolved-oxygen availability (the amount of oxygen available per cell per unit of time, e.g., dissolved-oxygen tension [in micromoles] per gram of biomass per hour) seems to be the most appropriate parameter to study the response of cells to molecular oxygen. Unfortunately, this parameter cannot be measured in a culture of respiring cells.
Besides the technical problems mentioned above, a rather confusing terminology with respect to the rate of oxygen supply is often used. For example Tseng et al. (20) and Li et al. (14) varied the oxygen input in the gas phase (percentage of air in the input gas) but used the term dissolved oxygen to refer to this.
Essentially, all of the above approaches can be used in individual experiments under specified conditions, but results from independent experiments cannot easily be compared. In this paper an approach that allows one to study cellular responses in different experimental setups under microaerobic conditions is described. The approach is based on a quantitative calibration of oxygen availability, with the oxygen input rate that is minimally needed for fully aerobic catabolism and strict anaerobic conditions as the two points of reference.
A quantitative description of the cellular physiology of growth of E. coli in the microaerobic range is given. It is concluded that rDOT is not a proper parameter to describe microaerobic conditions since no significant variation in its value for a wide range of oxygen supply rates could be measured (1), whereas the cell's physiology simultaneously changed significantly. In addition we describe how the cellular in vivo activities of the two cytochrome oxidases vary between minimal and saturating rates of oxygen supply.
MATERIALS AND METHODS
Strains and growth conditions.
E. coli MC4100 was grown in chemostat cultures under glucose-limited conditions (Bioflo 3000 and Bioflo III [New Brunswick] or 2-liter benchtop fermentor [Applicon]) at a constant dilution rate of 0.15 ± 0.01 h−1. Glucose (45 mM) was used as the single carbon and energy source. A simple salts medium as described by Evans et al. (7) was used, except that, instead of citrate, nitriloacetic acid (2 mM) was used as the chelator. Selenite (30 μg/liter) and thiamine (15 mg/liter) were added to the medium. The pH was maintained at 7.0 ± 0.1 by titrating with sterile 4 M NaOH, and the temperature was set to 35°C. The oxygen supply was varied by changing the percentage of oxygen in a gas mixture of air and N2, and the culture was stirred at a constant rate. To obtain a percentage of 29% (see Fig. 1) a mixture of N2 and O2 was used. In some cases the agitation rate was varied. In these experiments the cells were supplied with air (20.95% O2). The gas flow rate was 500 ml/min in all experiments. Dissolved-oxygen concentrations were monitored with an INGOLD polarographic (diameter, 12 mm) O2 sensor with a detection limit of 100 nM and an accuracy of approximately 30 nM (as determined by examining O2 input versus O2 output [electrode reading] under conditions similar to those used for cultivation with respect to medium composition, pH, and temperature).
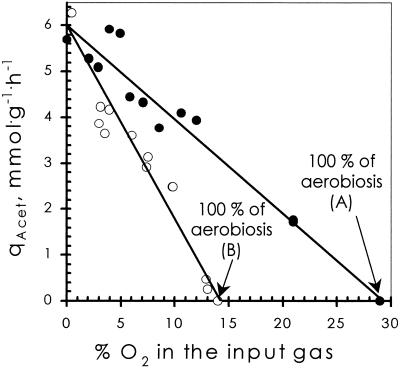
FIG. 1.
Effect of oxygen supply on steady-state acetate production rate (qAcet) in two chemostats. The agitation rate was fixed at 500 rpm. Solid circles, Bioflo 3000 (A); open circles, Bioflo III (B). Lines are linear regressions through the two sets of data points.
Analytical procedures.
Steady-state bacterial dry weight was measured by the procedure of Herbert et al. (10). Glucose, pyruvate, lactate, formate, acetate, succinate, and ethanol were determined by high-pressure liquid chromatography (LKB) with a REZEX organic acid analysis column (Phenomenex) at a temperature of 40°C; 7.2 mM H2SO4 was the eluent. A RI 1530 refractive index detector (Jasco) and Borwin chromatography software, for data integration, were used. CO2 production and O2 consumption were measured by passing the outgoing gas from the fermentor through a Servomex CO2 and O2 analyzers, respectively.
For all data presented a carbon balance of 95% ± 3% was calculated from the rates of glucose consumption and product formation (1). All aerobic and anaerobic redox balances were 95 to 98%, again as calculated from all products and biomass.
Calculations.
Calculations were performed assuming Michaelis-Menten kinetics. For calculations of the flux via the cytochrome bd oxidase [qO2 (cyt d)], numerical values for Km (2.4 × 10⁻⁵ mM) and Vmax (4.2 × 10⁻² mmol of O2·nmol of protein−1 · h−1) were taken from reference 18. The flux via cytochrome o [qO2 (cyt o)] was calculated from qO2 (cyt o) = qO2 − qO2 (cyt d), where qO2 is the measured specific rate of respiration. The total qO2 values and the data on cytochrome d content were taken from a study by Alexeeva et al. (1).
RESULTS
Quantification of oxygen availability.
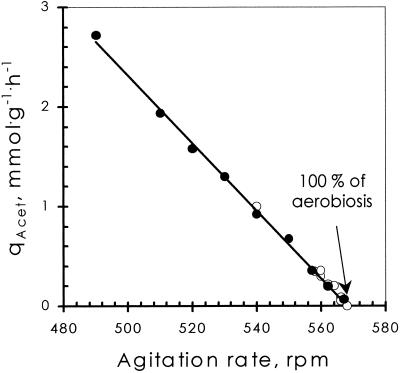
E. coli was grown in chemostat cultures, using glucose as the sole carbon and energy source. Product formation rates and glucose and oxygen consumption rates were measured for steady-state conditions with various supply rates of oxygen. Previously, it was observed that, by increasing the oxygen supply rate, fermentative catabolism was gradually replaced by respiratory catabolism, acetate being the most persistent fermentation product (1). In addition, it was invariably observed that similar conditions of aeration, applied to cell cultures grown in two different chemostats, resulted in quantitatively different responses of the cells with respect to catabolic fluxes. This is illustrated by the steady-state acetate production rates: consistently, a 2.2-fold-higher percentage of oxygen in the inflowing gas mixture was required for chemostat A than for chemostat B to obtain an identical response of the cells (Fig. 1) (1). This difference probably reflects a difference in oxygen transfer rate between these two fermentors. Further support for this was provided by the fact that a negative linear relationship between the stirring rate (ranging from 490 to 570 rpm) and the steady-state acetate production rate was found (Fig. 2).
FIG. 2.
Effect of agitation rate on steady state acetate production (qAcet) in a Bioflo 3000 at fixed oxygen supply (air, 20.95% O2). Open circles, stepped-up agitation rate; solid circles, stepped-down agitation rate.
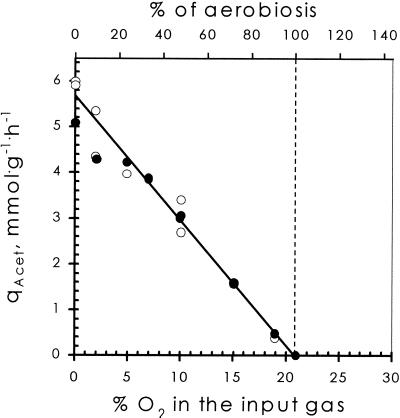
From Fig. 1 and 2 it can be concluded that fully respiratory catabolism of the cultures could be achieved by varying either the oxygen concentration in the inflowing gas or the stirring rate (i.e., by varying the oxygen transfer rate) of the setup. To calibrate the fermentor setup, two reference conditions were defined. One was trivial, namely, the fully anaerobic condition (no oxygen present; denoted 0% aerobiosis). The second was defined for glucose-limited conditions as the minimum oxygen input rate required for complete oxidation of glucose to CO2 (denoted 100% aerobiosis). It is emphasized that this definition holds only for glucose-limited conditions, since it is well documented that E. coli excretes acetate under glucose-excess conditions, irrespective of the availability of O2 (11). To set a particular chemostat setup at 100% aerobiosis, cells were grown with air as the inflowing gas (20.95% O2) and the specific steady-state acetate production rates for a number of steady states at different stirring rates were determined. By linear regression (Fig. 2), the minimal stirring rate required to prevent acetate production was determined. Oxygen availability was varied by varying the oxygen input in the inflowing gas (with a constant gas flow rate of 500 ml/min). At the minimal stirring rate, set as described above, 20.95% O2 in the gas mixture (air) corresponds to 100% aerobiosis, 10.47% O2 corresponds to 50% aerobiosis, etc. To eliminate effects of biomass, equal biomass concentrations for the same percentage of aerobiosis in different experimental setups were obtained by using the same glucose concentrations in all the experiments. Figure 3 illustrates a typical application of this approach in two different chemostats, a Bioflo 3000 (New Brunswick) and a 2-liter benchtop fermentor (Applicon).
FIG. 3.
Effect of oxygen supply on the steady-state acetate production rate (qAcet) in two chemostats. Solid circles, Bioflo 3000; open circles, Applicon type. In the initial phase of each run cells were supplied with air (20.95% O2). Agitation rate was fixed at the minimal value at which cells produce no acetate (i.e., 568 and 610 rpm for the two chemostats, respectively). This point is defined as 100% aerobiosis. Next oxygen availability was varied by varying oxygen percentage in the input gas.
The approach allows comparative and reproducible studies of facultatively anaerobic microorganisms under defined conditions of oxygen availability in chemostat cultures.
Flux distribution in the respiratory chain and cytochrome content in response to oxygen availability.
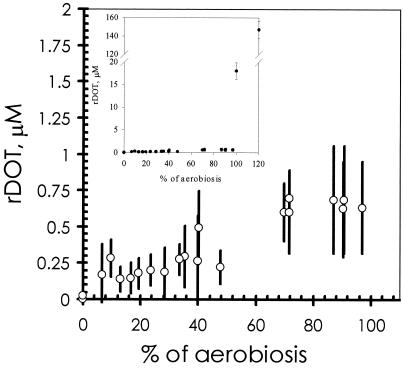
Having quantified oxygen availability for cells growing under well-defined conditions, its effects on the physiology of the organisms were studied. Increasing the oxygen in the inflowing gas mixture, up to a certain level, resulted in a new steady state, with cells displaying an increased oxygen consumption rate (qO2; Fig. 4). It is noteworthy that the steady-state residual dissolved-oxygen concentrations (rDOT) did not change significantly between 10 and 40% aerobiosis (1) (Fig. 5), remaining below 0.4 μM O2 in this range. From 40% aerobiosis onwards an increased rDOT value was measured (Fig. 5).
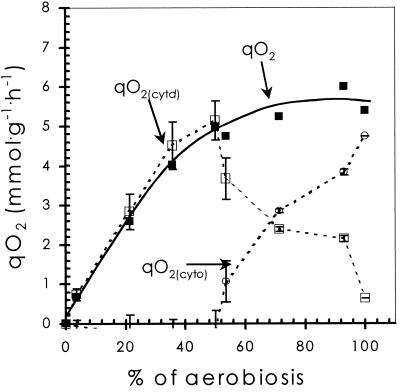
FIG. 4.
Contribution of cytochrome d (open squares) and cytochrome o (open circles) to total respiratory activity, calculated on the basis of measured cytochrome d content (1), rDOT values (Fig. 5), respiration rates (qO2, closed squares), and known Km and Vmax values for the cytochrome bd oxidase (14) (see also Materials and Methods).
FIG. 5.
Effect of oxygen availability on microaerobic (below 100% aerobiosis) steady-state rDOT. Bars, amplitudes of the oscillations observed (see Results). Inset, complete range.
In addition, it was observed that rDOT values exhibited a complex oscillation pattern through all conditions analyzed, with a frequency of 9 ± 1 h−1. The amplitudes of these oscillations are shown in Fig. 5. Oscillations with respect to rDOT values, as observed here, have been described earlier (9) for steady-state chemostat cultures of K. aerogenes grown under conditions that are comparable to those that now can be described as close to 100% aerobiosis. The oscillations in this “transition state” were interpreted as being a consequence of alterations in the respiration rate. To test this hypothesis for the oscillations described above, all respiratory activity of the cells growing in steady state was abolished by transiently applying a low ambient pH value (pH 0.8) for 1 h, followed by readjustment of the pH to 7.0. The culture vessel was then flushed with a gas mixture that contained known concentrations of oxygen (air saturation corresponds to 220 μM dissolved oxygen). The reading of the electrode (output) corresponded well with the input values, and no significant oscillations in the measurements were observed. Clearly, the observed oscillations are the result of cellular activity and not an artifact in the measurements. Interestingly, a small increase in the oxygen availability to a culture growing at almost 100% aerobiosis resulted in a new steady state with a significant increase in rDOT value from below 1 μM to well above 10 μM. Thus, it was impossible to achieve steady-state conditions with rDOT values between 1 and 15 μM (0.45 and 7% of air saturation, respectively). Similar results have been reported for K. aerogenes (9).
The virtually constant mean rDOT values in the range from 10 to 40% aerobiosis imply a homeostatic response of the organisms to changes in oxygen availability. This adaptive behavior could be brought about by differential synthesis of cytochrome bd oxidase and/or cytochrome bo oxidase as a response to the availability of oxygen. Previously we have shown (1) that indeed the content of cytochrome bd oxidase is affected by the steady-state percent aerobiosis. Assuming Michaelis-Menten kinetics, from our data on the content of cytochrome bd oxidase and the known kinetic data (18) and from the actual specific respiration rates (Fig. 4), the electron flux to oxygen via the cytochrome bd oxidase and that via the cytochrome bo oxidase were calculated. The calculations show (Fig. 4) that, below 50% aerobiosis, respiratory activity can be fully accounted for by the activity of the cytochrome bd oxidase. The increased respiration rate by the cells is matched by an increased cytochrome bd oxidase content. As a consequence, the specific cytochrome bd oxidase activity is rather constant in this range and close to the Vmax of this enzyme.
Above 55% aerobiosis the cytochrome bo oxidase contributed significantly to respiratory activity, and, under fully aerobic conditions, the flux via this pathway was calculated to occur with a rate of 4.75 mmol of O2·g (dry weight)−1 · h−1. The cytochrome bo oxidase has a Km for O2 of 2 × 10⁻⁴ mM and a Vmax of 6.6 × 10⁻² mmol of O2·nmol of cytochrome o−1·h−1 (18). This corresponds, at the measured rDOT value of 1.6 × 10⁻² mM, to a cytochrome bo oxidase content of 73 nmol of protein·g (dry weight)−1, which is in good agreement with the values reported for cells grown with oxygen saturation, i.e., approximately 100 nmol·g (dry weight)−1 (18).
DISCUSSION
From the results presented here, it can be concluded that the actual oxygen input in the gas phase is not a useful parameter to assess the molecular or physiological responses of E. coli to various extents of aerobiosis, since this parameter does not reflect oxygen availability to the individual cell. Instead, we introduced perceived aerobiosis as a quantifiable parameter which reflects the relative extent to which a cell uses oxidative catabolism. It should be noted that oxidative catabolism does not imply complete oxidation of glucose (to CO2 and water) since this occurs under glucose-limited conditions only; whenever glucose is in excess E. coli produces acetate as the overflow product irrespective of oxygen input or biomass concentration (11). Therefore, with an excess of glucose 100% aerobiosis should be redefined as the minimal oxygen input rate required to obtain the lowest carbon flux to by-products. The major advantages of the use of this parameter are (i) that it can be applied to cultivation setups that differ in their performance with respect to oxygen transfer rate and (ii) that it contains information on the physiological behavior of the organisms rather than on environmental conditions. When oxygen was supplied to the cultures in quantities exceeding 100% aerobiosis, all parameters we have analyzed, such as the expression of several catabolic genes, catabolic activities, cell yield on glucose, and the cytoplasmic concentration of key redox intermediates such as NAD(P)H, remained constant, except for the residual oxygen tension (1). We assume therefore that an oxygen supply above 100% aerobiosis in fact is an oxygen excess condition. However, we do not exclude the possibility that an O2 availability exceeding 100% may have physiological consequences (e.g., due to oxygen stress and superbaric conditions).
Using the above approach, we concluded that the entire range of incomplete aerobiosis can be divided into two physiologically distinct levels. Up to approximately 40% aerobiosis a low and virtually unchanging residual oxygen tension is maintained. The Arc regulon presumably plays a key role in the underlying regulation (4, 16). In this range cytochrome bd oxidase is the major, if not only, terminal oxidase contributing to the electron flow to oxygen. The observed homeostatic response with respect to rDOT can be accounted for by an increase in the cellular content of cytochrome bd oxidase. Above 50% aerobiosis, the cellular response to increased oxygen availability results in a significant increase in the rDOT value and concomitantly in an increasing contribution of the low-affinity cytochrome bo oxidase to respiration. rDOT values in this window do not alter significantly up to almost 100% aerobiosis. So here too it appears that specific respiratory activity increases with increasing oxygen availability due to a higher cellular content of cytochrome oxidase, but now of the bo type. Indeed, it has been reported before (20) that cytochrome bo oxidase expression increases with increasing oxygen input in semiaerobic cultures.
The net result of this regulation is that, in both “windows” of partial aerobiosis, the average rDOT levels do not increase in proportion to the increase of oxygen input. The rather abrupt upshift in the steady-state rDOT values in the transition between the windows coincides with a shift from the bd type to the bo type oxidase, which is in agreement with the differences in their affinities for oxygen (6, 12, 18).
The results presented in this paper show that small changes in oxygen availability, and not oxygen concentrations, are sensed by E. coli and result in a change in the composition of the respiratory chain both quantitatively (i.e., a change in the content of terminal oxidases) and qualitatively (i.e., a change in the nature of the terminal oxidases). It is noteworthy that a similar conclusion has recently been drawn for the N2-fixing Bradyrhizobium japonicum (15). Moreover, the adaptive response, which we now have quantified, is in agreement with our previous suggestion that the regulation of the cytochrome content in E. coli cells serves to maintain an internal oxygen concentration that is sufficiently low to allow proper functioning of the oxygen-sensitive pyruvate formate lyase (19) under conditions where pyruvate dehydrogenase is inhibited by a high NADH/NAD+ ratio in the cytoplasm (1).
REFERENCES
- 1.Alexeeva, S., B. de Kort, G. Sawers, K. Hellingwerf, and M. J. Teixeira de Mattos. 2000. Effects of limited aeration and of the ArcAB system on intermediary pyruvate catabolism in Escherichia coli. J. Bacteriol. 182:4934-4940. [DOI] [PMC free article] [PubMed] [Google Scholar]
- 2.Becker, S., G. Holighaus, T. Gabrielczyk, and G. Unden. 1996. O2 as the regulatory signal for FNR-dependent gene regulation in Escherichia coli. J. Bacteriol. 178:4515-4521. [DOI] [PMC free article] [PubMed] [Google Scholar]
- 3.Becker, S., D. Vlad, S. Schuster, P. Pfeiffer, and G. Unden. 1997. Regulatory O2 tensions for the synthesis of fermentation products in Escherichia coli and relation to aerobic respiration. Arch. Microbiol. 168:290-296. [DOI] [PubMed] [Google Scholar]
- 4.Cotter, P. A., and R. P. Gunsalus. 1992. Contribution of the fnr and arcA gene products in coordinate regulation of cytochrome o and cytochrome d oxidase (cyoABCDE and cydAB) in Escherichia coli. FEMS Microbiol. Lett. 70:31-36. [DOI] [PubMed] [Google Scholar]
- 5.de Graef, M. R., S. Alexeeva, J. L. Snoep, and M. J. Teixeira de Mattos. 1999. The steady-state internal redox state (NADH/NAD) reflects the external redox state and is correlated with catabolic adaptation in Escherichia coli. J. Bacteriol. 181:2351-2357. [DOI] [PMC free article] [PubMed] [Google Scholar]
- 6.D'Mello, R., S. Hill, and R. K. Poole. 1996. The cytochrome bd quinol oxidase in Escherichia coli has an extremely high oxygen affinity and two oxygen-binding haems: implications for regulation of activity in vivo by oxygen inhibition. Microbiology 142:755-763. [DOI] [PubMed] [Google Scholar]
- 7.Evans, C. G. T., D. Herbert, and D. W. Tempest. 1970. The continuous culture of microorganisms. 2. Construction of a chemostat, p. 277-327. In J. R. Norris and D. W. Ribbons (ed.), Methods in microbiology, vol. 2. Academic Press, London, United Kingdom. [Google Scholar]
- 8.Finn, R. K. 1954. Agitation-aeration in the laboratory and industry. Bacteriol. Rev. 18:254-274. [DOI] [PMC free article] [PubMed] [Google Scholar]
- 9.Harrison, D. E., and S. J. Pirt. 1967. The influence of dissolved oxygen concentration on the respiration and glucose metabolism of Klebsiella aerogenes during growth. J. Gen. Microbiol. 46:193-211. [DOI] [PubMed] [Google Scholar]
- 10.Herbert, D., P. J. Phipps, and R. E. Strange. 1971. Chemical analysis of microbial cells, p. 209-344. In J. R. Norris and D. W. Ribbons (ed.), Methods in microbiology, vol. 5b. Academic Press, London, United Kingdom. [Google Scholar]
- 11.Holms, H. 1996. Flux analysis and control of the central metabolic pathways in Escherichia coli. FEMS Microbiol. Rev. 19:85-116. [DOI] [PubMed] [Google Scholar]
- 12.Kita, K., K. Konishi, and Y. Anraku. 1984. Terminal oxidases of Escherichia coli aerobic respiratory chain. II. Purification and properties of cytochrome b558-d complex from cells grown with limited oxygen and evidence of branched electron-carrying systems. J. Biol. Chem. 259:3375-3381. [PubMed] [Google Scholar]
- 13.Lawford, H. G., and J. D. Rousseau. 1994. Effect of oxygen on ethanol production by a recombinant ethanologenic E. coli. Appl. Biochem. Biotechnol. 45-46:349-366. [DOI] [PubMed] [Google Scholar]
- 14.Li, X., J. W. Robbins, Jr., and K. B. Taylor. 1992. Effect of the levels of dissolved oxygen on the expression of recombinant proteins in four recombinant Escherichia coli strains. J. Ind. Microbiol. 9:1-9. [DOI] [PubMed] [Google Scholar]
- 15.Li, Y., L. S. Green, R. Holtzapffel, D. A. Day, and F. J. Bergensen. 2001. Supply of O2 regulates demand for O2 and uptake of malate by N2-fixing bacteroids from soybean nodules. Microbiology 147:663-670. [DOI] [PubMed] [Google Scholar]
- 16.Lynch, A. S., and E. C. C. Lin. 1996. Responses to molecular oxygen, p. 1526-1538. In F. C. Neidhardt, R. Curtiss III, J. L. Ingraham, E. C. C. Lin, K. B. Low, B. Magasanik, W. S. Reznikoff, M. Riley, M. Schaechter, and H. E. Umbarger (ed.), Escherichia coli and Salmonella: cellular and molecular biology, 2nd ed. American Society for Microbiology, Washington, D.C.
- 17.Pasteur, L. 1876. Etudes sur la biere. Gauthier-Villars, Paris, France.
- 18.Rice, C. W., and W. P. Hempfling. 1978. Oxygen-limited continuous culture and respiratory energy conservation in Escherichia coli. J. Bacteriol. 134:115-124. [DOI] [PMC free article] [PubMed] [Google Scholar]
- 19.Sawers, G., and A. Bock. 1988. Anaerobic regulation of pyruvate formate-lyase from Escherichia coli K-12. J. Bacteriol. 170:5330-5336. [DOI] [PMC free article] [PubMed] [Google Scholar]
- 20.Tseng, C. P., J. Albrecht, and R. P. Gunsalus. 1996. Effect of microaerophilic cell growth conditions on expression of the aerobic (cyoABCDE and cydAB) and anaerobic (narGHJI, frdABCD, and dmsABC) respiratory pathway genes in Escherichia coli. J. Bacteriol. 178:1094-1098. [DOI] [PMC free article] [PubMed] [Google Scholar]
- 21.Wimpenny, J. W. T., and D. K. Necklen. 1971. The redox environment and microbial physiology. I. The transition from anaerobiosis to aerobiosis in continuous culture of facultative anaerobes. Biochim. Biophys. Acta 253:352-359. [DOI] [PubMed] [Google Scholar]


