

Abstract
Several of the aspartic acid protease inhibitors used to treat HIV infection increase basal lipolysis in adipocytes, but the cellular mechanisms leading to this augmentation are not well understood. We therefore studied the effects of chronic exposure to the HIV protease inhibitor, ritonavir, on the lipolytic cascade in 3T3-L1 adipocytes.
Treatment of 3T3-L1 adipocytes with ritonavir for 14 d (during and after differentiation) enhanced basal, isoproterenol (Iso)-stimulated, and cAMP analog-stimulated lipolysis. Enhancement of lipolysis was observed after Iso at concentrations between 0.1 and 10 μm. Despite a significant decrease in cyclic nucleotide phosphodiesterase (PDE)3B activity and protein levels, there were no changes in Iso-stimulated intracellular cAMP, protein kinase A (PKA) expression, or PKA activity. Ritonavir-augmented lipolysis was also observed under conditions that reversed the effect on PDE3B activity via preincubation with 1 μm (-)-N6-(2-phenylisopropyl)adenosine. In ritonavir-treated cells, protein expression of the lipid droplet-protective protein, perilipin, was significantly decreased, whereas there was no change in hormone-sensitive lipase. Activation of ERK1/2 by Iso did not play a role in the augmentation. We conclude that ritonavir decreases PDE3B and perilipin protein expression and affects both basal and catecholamine-stimulated lipolysis in 3T3-L1 adipocytes primarily through actions at sites downstream of PKA.
Abbreviations: AP-2, Adipocyte fatty acid binding protein; cat-α, catalytic-α; DMSO, dimethylsulfoxide; FBS, fetal bovine serum; HAART, highly active antiretroviral therapy; HSL, hormone-sensitive lipase; IBMX, isobutylmethylxanthine; Iso, isoproterenol; KRH, Krebs/Ringer/HEPES; NEFA, nonesterified fatty acid; PDE, phosphodiesterase; Peri, perilipin; PIA, (-)-N6-(2-phenylisopropyl)adenosine; PKA, protein kinase A; PKI, protein kinase inhibitor; SDS, sodium dodecyl sulfate
IN RESPONSE TO the epidemic of HIV infection in the 1980s, a class of protease-inhibitor compounds were designed to inhibit the activity of an aspartic viral protease involved in HIV replication (1, 2). The direct result of this inhibition is production of noninfectious virions, thereby lowering the viral load in patients with HIV (3, 4). The introduction of protease inhibitors for the treatment of HIV infection dramatically decreased HIV’s morbidity and mortality (5). Among the protease inhibitors employed in clinical practice are ritonavir, indinavir, amprenavir, nelfinavir, and saquinavir (6).
Highly active antiretroviral therapy (HAART) for HIV, particularly when it includes protease inhibitor therapy, has been associated with a number of side effects, including hyperlipidemia, hyperglycemia, insulin resistance, and redistribution of adipose tissue (7–15) that together have been termed the HIV-associated lipodystrophy syndrome (16–18). It has been suggested that the loss of peripheral adipose tissue in the HIV-associated lipodystrophy syndrome can be, at least in part, ascribed to the increased rates of lipolysis in HIV-infected individuals receiving HAART therapy (19–23). The importance of protease inhibitors as a cause of increased lipolysis is further suggested by the observation that in HIV-infected subjects with lipodystrophy syndrome, replacement of protease inhibitor therapy with a nucleoside reverse transcriptase inhibitor reverses elevated rates of lipolysis (24). Investigators have proposed that increased lipolysis may be related to increased sympathetic activity (25, 26) or to the development of insulin resistance (22, 27) in individuals with HIV-associated lipodystrophy. However, the mechanisms that may explain the increased lipolysis observed in clinical studies remain unclear.
Subsequently, in vitro model systems have been employed to study the potential role of the adipocyte in the increased lipolysis observed in humans treated with protease inhibitor-containing HAART regimens. Interpretation of these studies is made difficult because of differences in experimental design, which include the dose, duration of exposure, and type of protease inhibitor studied. There have been conflicting reports of the effects of protease inhibitors on preadipocyte differentiation (28–30) and adipogenesis (31). In model adipocyte cell culture systems, short-term exposure to nelfinavir, ritonavir, or saquinavir (31–34) and longer-term (6 d) (35) exposure to nelfinavir at concentrations similar to those used clinically, augmented basal lipolysis. Studies examining the effects of short-term protease inhibitor exposure on glucose transport have suggested that protease inhibitors may cause decreased glucose transport in adipocytes and other cell types (34, 36–38), but the increased basal lipolysis induced by protease inhibitors does not appear to be related to these changes in GLUT4-mediated glucose uptake (34, 39). Thus, the mechanisms underlying the increased lipolysis observed with protease inhibitor treatment are not well understood. We therefore examined the effects of the protease inhibitor, ritonavir, on basal and catecholamine-stimulated lipolysis in murine 3T3-L1 cells.
Materials and Methods
Cell culture and protease inhibitor treatment
Murine 3T3-L1 cells (ATCC, Manassas, VA) were grown on Corning/Costar dishes (Corning, Inc., Corning, NY) in a 5% CO2 atmosphere at 37 C and maintained in DMEM (4500 mg glucose/liter) supplemented with 10% fetal bovine serum (FBS), 2 mm glutamine, 8 μg/ml biotin, 110 μg/ml pyruvate, 100 U/ml penicillin, and 100 μg/ml streptomycin. Confluent cells were differentiated by addition of 10−6 m dexamethasone, 0.5 mm isobutylmethylxanthine (IBMX), and 5 μg/ml insulin to DMEM medium with 10% FBS for 3 d, with medium changed once every 24 h. Cells were incubated with differentiation medium containing a final concentration of 10 μm ritonavir in 0.1% ethanol. Purified ritonavir was graciously provided by Abbott Laboratories (Chicago, IL) under a material transfer agreement. Purified ritonavir was dissolved in 100% ethanol at a concentration of 10 mm and subsequently diluted 1:1000 in either differentiation cocktail or DMEM maintenance medium as specified below. Control cells were given 0.1% ethanol-containing medium without ritonavir. After 3 d, the differentiation medium was withdrawn, and cells were maintained in DMEM with 10% FBS plus either 0.1% ethanol or 10 μm ritonavir for a total of 14 d, with addition of fresh medium every 24 h containing either 0.1% ethanol or 10 μm ritonavir. Cells were harvested at 14 d after the initiation of differentiation for Western, DNA, and protein analyses. Total cellular protein was determined using the Bradford protein assay method (Bio-Rad, New York, NY).
Immunoblotting
3T3-L1 cells were prepared for Western blot analyses by harvesting whole-cell lysates using the following procedure: cells were washed one time with ice-cold Krebs/Ringer/HEPES (KRH) buffer, at pH 7.4, containing 5 mm glucose (cell culture grade; Sigma, St. Louis, MO) and either 0.1% ethanol or 10 μm ritonavir. Cells were lysed on ice for 10 min with buffer containing 25 mm HEPES (pH 7.5), 1 mm EDTA, 150 mm NaCl, 10 mm sodium pyrophosphate, 5 mm sodium fluoride, 1 mm phenylmethylsulfonylfluoride, 1 mm sodium orthovanadate, 10 μg/ml aprotinin, 10 μg/ml leupeptin, and 10 μg/ml pepstatin A. Cells were then sonicated and vortexed on ice until the solution was homogeneous. Aliquots of whole-cell lysates were extracted in Laemmli sample buffer (40) containing a final concentration of 10% sodium dodecyl sulfate (SDS). Fresh dithiothreitol (final concentration, 55 mm) was added to the samples just before boiling and loading. Equivalent amounts of whole-cell lysates (based on measurements of total cellular DNA or protein) were loaded. Proteins were electrophoretically separated on SDS polyacrylamide gels followed by electrophoretic transfer to nitrocellulose membranes as previously described (41). Immunoblots were probed with either antiperilipin serum raised against the amino terminus of perilipin (Peri) (42), affinity-purified hormone-sensitive lipase (HSL) immunoglobulin (43), phosphodiesterase (PDE)3B (44), protein kinase A (PKA) catalytic-α (cat-α) (partially cross-reactive with β and γ), PKA RIIα and RIIβ (Santa Cruz Biotechnology, Inc., Santa Cruz, CA), phosphorylated ERK1/2 and total ERK1/2 (Cell Signaling Technology, Inc., Beverly, MA), or adipocyte fatty acid binding protein (AP-2) antibodies (generously donated by Dr. David Bernlohr, University of Minnesota, Minneapolis, MN). Signal was detected with secondary antibodies conjugated to horseradish peroxidase, an enhanced chemiluminescent substrate (Amersham Biosciences, Piscataway, NJ). The linear range of detection by the enhanced chemiluminescent method was determined for each protein before quantitation of immunoblots. Signal intensities on film for PDE3B, HSL, Peri, and PKA proteins were quantitated using laser scanning densitometry (PDSI; Amersham Biosciences). AP-2 signal was quantitated using a Kodak Image Station (Eastman Kodak Co., Rochester, NY).
DNA analysis
Estimation of DNA content in whole-cell lysates was determined using bisbenzamide dye (45). Briefly, DNA standards in the range of 0.05–1 μg were solubilized in lysing medium (as described above), and 50-μl aliquots of standard or cell lysates from each experiment were mixed with 3.0 ml of 1 μg/ml bisbenzamide dye reagent in 50 mm sodium phosphate buffer (pH 7.4) containing 2 m sodium chloride, 2 mm EDTA, and 0.02% sodium azide. Fluorescence of samples was measured at an excitation wavelength of 356 nm and emission wavelength of 458 nm (Fluorometer, Model LS 55; PerkinElmer, Shelton, CT).
Triglyceride analysis
Neutral lipids were extracted from aliquots of sonicated whole-cell lysates by the Folch method (46). Extracts were dried under nitrogen and resuspended in 10 mm Tris/1 mm EDTA/1% Triton-X-100. The quantity of triglyceride in each extract was determined using the GPO-Trinder kit (Sigma, St. Louis, MO). Total triglyceride in each sample was calculated as per kit instructions, and data were expressed as micrograms of triglyceride per microgram of DNA.
Lipolysis experiments
All in vitro lipolysis experiments were performed with 14-d postcon-fluent 3T3-L1 adipocytes that had been exposed to 10 μm ritonavir or to 0.1% ethanol for 14 d. Before beginning each experiment, fresh DMEM with 10% FBS and either 0.1% ethanol or 10 μm ritonavir was added, and cells were allowed to equilibrate for 0.5–1 h at 37 C before initiation of the lipolysis experiments. Adipocytes were subsequently washed two times with PBS (prewarmed to 37 C). To initiate lipolysis, PBS was removed, and 0.5 ml KRH buffer containing 3% fatty acid-free BSA (Intergen, Purchase, NY), 5 mm glucose (cell culture grade; Sigma), 0.1% ethanol or 10 μm ritonavir, and either isoproterenol (Iso) in the range of 0.001–10 μm, or 375 μm N6-benzoyl-cAMP (N6cAMP; Sigma) was added. Stimulation was carried out at 37 C in a 5% CO2 atmosphere for periods ranging between 10 min and 2 h. When stimulation was done for 2 h, fresh Iso in the appropriate concentration was added at 1 h. At the end of the stimulation period, media were collected for glycerol and non-esterified fatty acid (NEFA) analyses. In some experiments, before addition of Iso, 3T3-L1 adipocytes were incubated with 50 μm PD 98059 (Sigma) or 1 μm (-)-N6-(2-phenylisopropyl)adenosine (PIA; Sigma) for times indicated in the figure legends. Whole-cell lysates were collected for DNA and cAMP analyses using the same lysis buffer as described above, except that whole-cell lysates collected for cAMP analyses were harvested in lysing buffer plus 0.25 mm IBMX. Intracellular cAMP content was determined using a direct EIA immunoassay kit from Assay Designs, Inc. (Ann Arbor, MI). Glycerol content was determined by radiometric assay as described previously (47), and NEFA was determined with the Free Fatty Acids, NEFA C kit (Wako Chemicals USA, Inc., Richmond, VA). Glycerol, NEFA, and cAMP estimates were normalized for total cellular DNA.
Assay of cAMP PDE3B activity
PDE3B activity was assayed using a modification of a method by Davis and Daly (48). Briefly, reactions were carried out in the presence or absence of 1 μm cilostamide (a PDE3B-selective inhibitor) for 30 min at 30 C in 100 μl assay buffer containing 50 mm Tris-HCl (pH 7.4), 5 mm MgCl2, 0.1 mm EGTA, and 1 μm [3H]cAMP (50,000 dpm/assay tube). Reactions were terminated by addition of 50 μl of 0.5-m ice-cold EDTA (pH 7.4). Samples were diluted with 0.3 ml HEPES-NaCl buffer (0.1 m NaCl, 0.1 m HEPES, pH 8.5) before purification of the reaction product, 5′-[3H]AMP, by chromatography using a polyacrylamide-boronate gel column (Affi-Gel 601, Bio-Rad, Hercules, CA; 1-ml bed vol). The purified 5′-[3H]AMP was quantified by liquid scintillation counting. PDE3B activity was determined by subtracting activity in the presence of 1 μm cilostamide from activity in the absence of 1 μm cilostamide. Protein concentration was determined using the BCA Protein Assay system (Pierce Chemical Co., Rockford, IL) according to the manufacturer’s protocol, with BSA as standard. Data were expressed as picomoles of 5′AMP per minute per milligram of protein. For in vitro assays of PDE3B activity, human recombinant PDE3B protein was expressed in SF-21 insect cells and assayed, as previously described (44), with either 0.1% ethanol or 10 μm ritonavir added to the assay mixture. Equivalent concentrations of recombinant human PDE3B were assayed for activity.
In vivo 32P loading of 3T3-L1 adipocytes and subcellular fractionation for determination of phosphorylated PDE3B
After 14 d exposure to 10 μm ritonavir or 0.1% ethanol, 3T3-L1 adipocytes were incubated for 2.5 h at 37 C in a 5% CO2 atmosphere with 75 μCi phosphorous-32 as H332PO4 (specific activity, 285.6 Ci/mmol; PerkinElmer) in KRH buffer with 0.1% fatty acid free BSA, 5 mm glucose, and 300 μm sodium phosphate (pH 7.4). After 2.5 h, loading buffer was removed, and adipocytes were washed two times with KRH without BSA. Subsequently, adipocytes were incubated for an additional 15 min in KRH without BSA but containing 5 mm glucose and 300 μm sodium phosphate (pH 7.4) in the presence of 1 μm PIA or 10 μm Iso at 37 C in a 5% CO2 atmosphere. Cells were lysed on ice for 10 min in ice-cold lysis medium as described above. After lysis, 10% glycerol was added to the wells, and cells were scraped from the wells and homogenized in a Dounce tissue homogenizer with 20 strokes of a loose fitting pestle (Kontes Instruments, Vineland, NJ). Adipocyte membrane fractions were prepared after centrifuging 1,000 × g supernatant at 175,000 × g for 30 min at 4 C. Membrane fractions were solubilized by homogenization (20 strokes in a homogenization vessel) and sonicated (2 × 5 pulses, output 2, 30% cycle) in homogenization buffer supplemented with 1% (vol/vol) Nonidet P-40. After centrifugation of solubilized membrane fractions, supernatants were removed and assayed for protein content. For immunoprecipitation, approximately 200 μg of solubilized membrane fractions was first precleared by incubating with 1 μg rabbit IgG for 1 h at room temperature before addition of 30 μl protein G-Sepharose (Pharmacia Biotech, Uppsala, Sweden) for 30 min before centrifugation (2800 × g, 4 C, 5 min). Precleared membrane fractions were incubated with 20 μl affinity purified polyclonal mouse PDE3B regulatory domain (amino acids 284–299, GYYGSGKMFRRPSLPC) antibody overnight at 4 C, followed by incubation with fresh protein G-Sepharose (30 μl) for 1 h before centrifugation (2800 × g, 4 C, 5 min). Immunoprecipitates were washed three times with PBS and boiled in 60 μl Laemmli buffer, and a 25-μl aliquot was subjected to SDS-PAGE. Proteins were transferred to nitrocellulose membranes (Invitrogen, Carlsbad, CA) in Trisglycine buffer (25 mm Tris-base and 192 mm glycine at pH 8.3), containing 20% methanol. Membranes were incubated in blocking buffer (150 mm NaCl; 0.05% (vol/vol) Nonidet P-40; and 10 mm Tris, pH 7.4, containing 5% nonfat dry milk) overnight at 4 C with rocking, and then for an additional 2 h in the same solution containing the mouse PDE3B C-terminal (amino acids 1070–1084, NKLQVDNASLPQADE) antibody. Membranes were washed three times (10 min/wash) in Tris/saline buffer and then incubated for 1 h with horseradish peroxidase-labeled goat antirabbit IgG (Pierce Chemical Co.) in blotting buffer and washed again three times (10min/wash) in Tris/saline buffer. Immunoblots were developed using SuperSignal(R) West Pico chemiluminescent substrate (Pierce Chemical Co.) for detection of PDE3B. Amounts of PDE3B protein and 32P-PDE3B signal were determined by autoradiography, and intensities of both signals were measured by laser scanning densitometry. PDE3B protein signal was normalized for the amount of IgG pulled down by the immunoprecipitation procedure.
Assay of PKA activity
PKA activity was determined using a kemptide assay as previously described (49). Briefly, 14-d 3T3-L1 adipocytes were grown in 60-mm dishes, differentiated, and maintained in 0.1% ethanol or 10 μm ritonavir media as stated above. Fourteen-day cells were treated with either 10 μm Iso or medium alone for 10, 20, or 30 min; and 12,000 × g cytosolic fractions were collected from whole-cell lysates and snap frozen (50) for kemptide assays and total protein analysis. Assay tubes with cytosol contained final concentrations of the following components: 7 mm N-[Tris(hydroxymethyl)methyl]-2-aminoethanesulfonic acid (pH 7.4), 83 mm sucrose, 17 mm Mg2SO4, 5 mm dithiothreitol, 67 μm ATP, 667 μg kemptide (Sigma), and 1 μCi of μ32P-ATP (6000 Ci/mmol; PerkinElmer). Activities were determined with or without 16 μm cAMP and with or without 25 μm protein kinase inhibitor (PKI). Assay tubes were incubated for a total of 20 min at 30 C. Reaction was stopped by placing assay tubes on ice and adding a final concentration of 0.3% BSA/285 μm ATP (pH 3.0) and 3.6% trichloroacetic acid. Samples were centrifuged at 4 C at 12,000 × g for 5 min. Supernatants were spotted on P-81 filters (phosphocellulose; Whatman, Clifton, NJ), and filters were washed three times for 15 min/wash with 75 mm H3PO4 followed by one 15-min wash with 100% acetone. Because phosphorylation of kemptide could be mediated by multiple kinases, phosphate transfer specifically due to PKA was estimated by subtraction of activity in the presence of PKI from activity without PKI. Because cAMP-induced disassociation of regulatory and catalytic subunits is associated with activation of PKA, total PKA catalytic activity was assessed by assays carried out in the presence of 16 μm cAMP. The fraction of active PKA present in the supernatant, relative to the total PKA catalytic capacity, was calculated by dividing the picomoles of inorganic phosphate transfer from 32P-ATP to kemptide in the absence of added cAMP by the picomoles of phosphate transfer to kemptide in the presence of 16 μm cAMP. This ratio was then multiplied by 100, and mean percent activations with their sem levels are reported.
Statistical analysis
Data were examined by ANOVA followed by Fisher protected least-significant difference tests when the overall treatment effect was significantly different (P < 0.05) by ANOVA. Means were considered significantly different at P < 0.05. For analysis of intracellular cAMP data and PKA activities from the time course experiments, analysis of covariance was performed to account for experimental variation in the estimates, and least-square means are reported from four independent experiments and three independent experiments, respectively. Means ± sem values are given in graphs. Sample sizes are indicated in the figure legends.
Results
Ritonavir treatment of confluent 3T3-L1 cells does not affect differentiation
To verify that ritonavir-treated 3T3-L1 cells differentiated similarly to control cells, total triglyceride and AP-2 protein expression (a terminal differentiation marker) were measured. Both measurements were normalized for total cellular DNA, the closest estimate of adipocyte cell number in this model system. There were no differences in ritonavir-treated cells, when compared with ethanol controls in total micrograms of triglyceride per microgram of DNA, between 1–14 d post confluence (Fig. 1A). Further, there were no differences due to ritonavir in AP-2 protein expression at any time point studied (Fig. 1, B and C).
Fig. 1.

Total cellular triglyceride (A) and AP-2 protein expression (B and C) in 3T3-L1 adipocytes treated with ritonavir (Rit) or control medium (0.1% ethanol) for 14 d. Cells were grown in 100-mm dishes. AP-2 protein expression by Western blot was measured in whole-cell lysates collected at 6, 10, and 14 d after initiation of differentiation (as described in Materials and Methods). A, n = 5–6 from two independent experiments. B and C, n = 6 from two independent experiments.
Ritonavir treatment of 3T3-L1 adipocytes increases basal and Iso-stimulated lipolysis
To examine the mechanisms underlying ritonavir’s effect on lipolysis, 3T3-L1 adipocytes exposed to ritonavir or 0.1% ethanol for 14 d were incubated with 10 μm Iso for 2 h, and glycerol and NEFA release were measured. Both basal and Iso-stimulated glycerol release were enhanced by 25–30% in ritonavir-treated cells compared with ethanol controls (Fig. 2A). An even larger response was found for NEFA release (Fig. 2B). To assess whether the augmented response occurred in the range of physiological concentrations for catecholamine action in vivo, we examined the effects of Iso between 0.001 and 10 μm. At a dose as low as 0.1 μm, both glycerol and NEFA release were significantly increased in ritonavir-treated cells (Fig. 2, C and D).
Fig. 2.
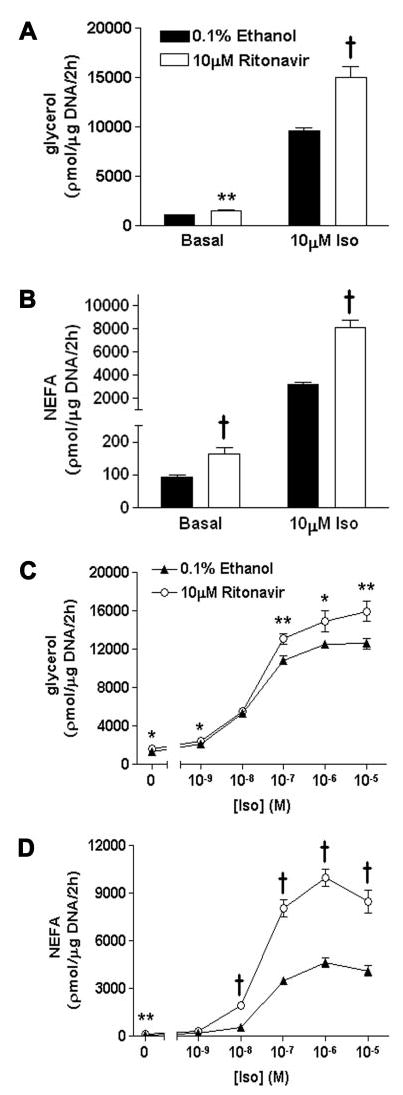
Basal and Iso-stimulated lipolysis in 3T3-L1 adipocytes treated with ritonavir or control medium (0.1% ethanol) for 14 d. Release of glycerol (A) and NEFA (B) in response to stimulation with 10 μm Iso for 2 h. Glycerol and NEFA released into the media were normalized for total cellular DNA; n = 15 from three independent experiments for A and B. Release of glycerol (C) and NEFA (D) in response to 0.001–10 μm Iso; n = 11–17 from four independent experiments for C and D. *, P < 0.05; **, P < 0.01; †, P < 0.001 for ritonavir vs. ethanol.
The roles of PDE3B and PKA in the ritonavir-mediated enhancement of lipolysis
To attempt to elucidate the mechanisms for the enhanced lipolysis observed in ritonavir-treated cells, we first studied expression and activity of PDE3B, which is involved in terminating catecholamine-stimulated lipolysis in adipocytes (49, 51–54). We hypothesized that if PDE3B activity were decreased in ritonavir-treated adipocytes, higher cAMP concentrations might be achieved both in the basal state and following β-adrenergic activation. Ritonavir-treated adipocytes had significantly lower basal PDE3B activity (P < 0.02) and a blunted Iso-mediated increase in PDE3B activity when compared with ethanol controls (Fig. 3A). To determine whether the effect on activity was a direct effect on PDE3B itself, the activity of recombinant human PDE3B (44) in the presence or absence of 10 μm ritonavir was measured in vitro. There were no differences in recombinant PDE3B activity due to ritonavir (ethanol control 6044.7 ± 211.2 vs. ritonavir 6215.5 ± 149.4 pmol 3H-5′AMP/min·mg protein; n = 6). Because there was no direct inhibition of PDE3B activity by ritonavir in vitro, PDE3B protein expression and phosphorylation were examined. Ritonavir-treated adipocytes expressed approximately 40% less PDE3B protein (P < 0.01; Fig. 3, B and C). However, despite the lower protein expression in ritonavir-treated cells, the amount of 32P-labeled PDE3B in Iso-stimulated 3T3-L1 adipocytes was equivalent in ritonavir- and ethanol-treated cells (Fig. 3D). These data suggested that the blunted activation of PDE3B in response to Iso was due to less protein expression in ritonavir-treated cells without any change in the ability to phosphorylate the enzyme.
Fig. 3.

PDE3B protein expression and enzymatic activity in 3T3-L1 adipocytes treated with ritonavir for 14 d. A, PDE3B enzyme activity measured after 2 h incubations; n = 13–15 from three independent experiments. B–D, PDE3B protein expression and phosphorylation in adipocytes that were 32P loaded for 2.5 h and subsequently treated with 1 μm PIA or 10 μm Iso for 15 min. Membrane fractions were isolated and immunoprecipitated with PDE3B antibody as described in Materials and Methods. Immunoprecipitated proteins were analyzed by Western blot followed by autoradiography. A representative Western blot is shown in B, followed by quantitation of total PDE3B protein (C) and phosphorylated PDE3B (D); n = 6 from two independent experiments. *, P < 0.05; **, P < 0.01; †, P < 0.001 for ritonavir vs. ethanol.
Subsequently, we wanted to determine whether decreased PDE3B protein expression and activity might explain the enhancement of lipolysis observed in ritonavir-treated cells. 3T3-L1 adipocytes were preincubated with 1 μm PIA (adenylate cyclase inhibitor/PDE activator) for 2 h, followed by stimulation for 1 h with 10 μm Iso or 375 μm N6cAMP, a cAMP analog that is not hydrolyzed by PDE3B (55). For cells not exposed to PIA, PDE3B activities in ritonavir-treated adipocytes were significantly lower than those observed in ethanol-treated cells for basal (P < 0.001), Iso (P < 0.01), and N6cAMP (P < 0.01) conditions (Fig. 4A). However, there were no differences due to ritonavir in intracellular cAMP levels (Fig. 4B) despite the significant enhancement in glycerol release found in Iso (P < 0.05)- and N6cAMP (P < 0.001)-treated cells given ritonavir (Fig. 4C). After pretreatment with PIA followed by stimulation with Iso and N6cAMP, which resulted in ritonavir- and ethanol-treated adipocytes having equivalent PDE3B activities (Fig. 4A), ritonavir-treated cells still released significantly more glycerol (Fig. 4C) following stimulation with Iso (P < 0.001) or N6cAMP (P < 0.001). Furthermore, pretreatment with 1 μm PIA significantly decreased intracellular cAMP (P < 0.001) and glycerol release (P < 0.0006) in ethanol-treated cells stimulated with Iso when compared with ethanol-treated cells not pretreated with PIA, in contrast to ritonavir-treated cells, where there was little change in cAMP levels and no change in glycerol release due to PIA (Fig. 4, B and C). All of these data suggested that the decreases in PDE3B protein expression and activity that we observed were not solely responsible for the ritonavir-related enhancement of lipolysis found under basal conditions or during Iso stimulation.
Fig. 4.
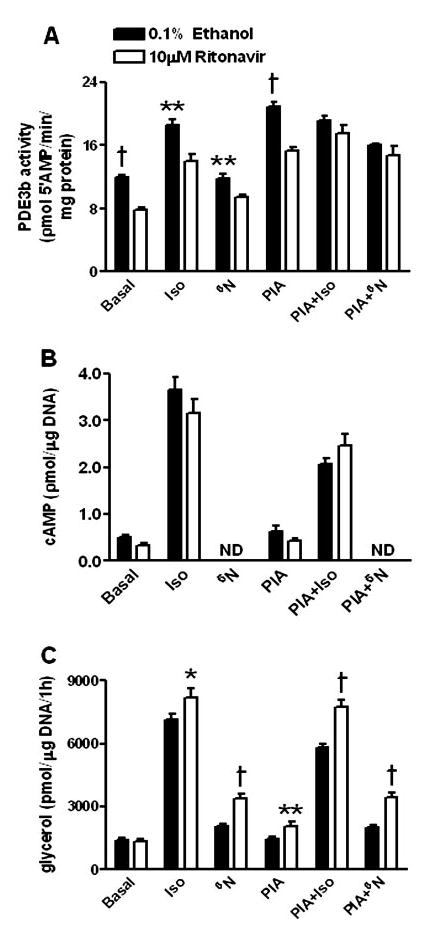
PDE3B activity (A), intracellular cAMP (B), and glycerol release (C) in 3T3-L1 adipocytes treated with ritonavir for 14 d and preincubated with 1 μm PIA for 2 h followed by stimulation for 1 h. Intracellular cAMP was not determined (ND) in cells treated with N6cAMP (N6), because the analog interfered with the cAMP assay. Data are from three independent experiments. For A, n = 8; for B, n = 10–12; for C, n = 15–19. *, P < 0.05; **, P < 0.01; †, P < 0.001 for ritonavir vs. ethanol.
To understand further the possible consequences of the lower PDE3B protein expression observed in ritonavir-treated cells, we examined intracellular cAMP after Iso stimulation at earlier times varying from 10–60 min (56, 57). The amount of cAMP rose significantly (P < 0.001) in response to Iso stimulation (Fig. 5A). However, there were no relative differences in the intracellular cAMP levels achieved in ritonavir-treated cells when compared with ethanol controls. In contrast, the difference in the amount of glycerol released in ritonavir-treated cells vs. ethanol controls progressively increased between 30 and 60 min with Iso-stimulation (Fig. 5B). These data suggested that the enhancement observed in ritonavir-treated adipocytes was not related to changes in intracellular cAMP but rather was related to changes in downstream effectors.
Fig. 5.
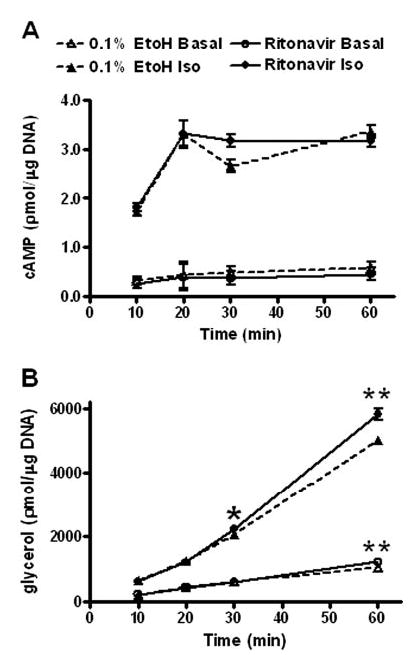
Time course of Iso-activated lipolysis in 3T3-L1 adipocytes treated with ritonavir for 14 d. A, Intracellular cAMP from four independent experiments. Data points are least-square means ± sem; n = 20. B, Glycerol release from four independent experiments; n = 13–21. *, P < 0.05; **, P < 0.01 for ritonavir vs. 0.1% ethanol (EtoH).
Data from Fig. 4C suggested that one possible candidate might be PKA, because enhanced lipolysis was observed in ritonavir-treated cells stimulated with the non-PDE hydrolysable cAMP analog, N6cAMP, which activates PKA directly (58). There were, however, no differences in expression of PKA subunits RIIα, RIIβ, or cat-α in ritonavir-treated cells when compared with ethanol controls (Fig. 6, A and B). Further, although PKA activity was increased by Iso in both groups (P < 0.03), there were no relative differences between ritonavir-treated cells and ethanol controls (Fig. 6C). The observation of no significant change in PKA activity due to ritonavir was consistent with our findings of no or little change in intracellular cAMP levels in ritonavir-treated adipocytes when compared with ethanol controls (Figs. 4B and 5A). Therefore, the ritonavir-induced augmentation of lipolysis could not be accounted for by altered expression of RIIα, RIIβ, or cat-α or increased activation of cat-α.
Fig. 6.

PKA protein expression and activity in 3T3-L1 adipocytes treated with ritonavir for 14 d. A, Whole-cell lysates were collected from cells treated with 10 μm Iso or medium alone for 2 h at 37 C, and blotted as specified in Materials and Methods. B, 14-d cells were treated with either 10 μm Iso or medium alone for 10, 20, or 30 min at 37 C, and 12,000 × g cytosolic fractions were used for kemptide assays. A, Representative Western blot for RIIβ (PKA regulatory subunit IIα, RIIβ (PKA regulatory subunit IIβ), and cat-α. B, Quantitation of signal intensity from Western blots. C, Endogenous PKA activity, expressed as percentage of maximal potential PKA activity. All data are from three independent experiments. For A and B, n = 12–15; for C, n = 8–9.
Chronic ritonavir treatment results in decreased Peri protein expression but does not change HSL expression
Other potential mediators of lipolysis downstream of PKA in adipocytes that might be affected by long-term ritonavir treatment include HSL and the lipid droplet-associated protein, Peri (43, 59–64). Although we observed no difference in HSL protein expression, there was a significant (P < 0.001) reduction in Peri expression after ritonavir treatment (Fig. 7).
Fig. 7.
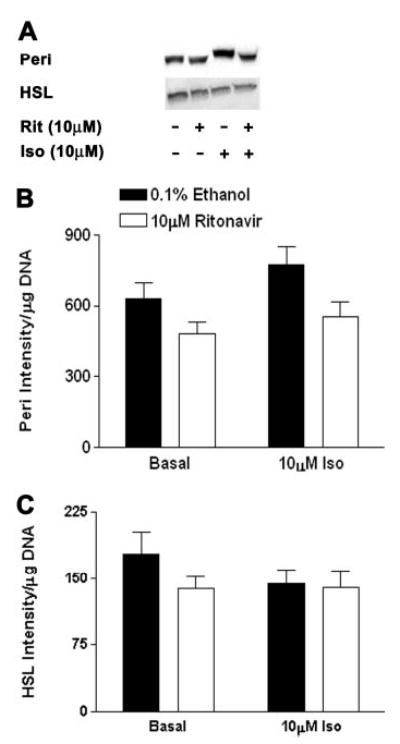
Peri and HSL protein expression in 3T3-L1 adipocytes treated with ritonavir for 14 d. Whole-cell lysates were collected from cells treated with 10 μm Iso or medium alone for 2 h at 37 C, and blotted as specified in Materials and Methods. A, Representative Western blots; B, quantitation of signal intensity from Western blots for Peri; C, HSL; n = 13–15 from three independent experiments. For Peri, P < 0.01 for ritonavir vs. ethanol groups; for HSL, no significant differences.
Inactivation of the ERK signaling pathway does not alter the ritonavir-induced augmentation of lipolysis
MAPK pathways have recently been shown to activate lipolysis (65). We therefore studied the possibility that the ERKs might be involved in the enhancement seen in ritonavir-treated adipocytes. When ritonavir-treated 3T3-L1 cells were preincubated with 50 μm PD 98059, a dose that markedly inhibits ERK1/2 phosphorylation (Fig. 8A), the ritonavir-associated augmentation was still demonstrated both for glycerol and NEFA release (Fig. 8, B and C).
Fig. 8.
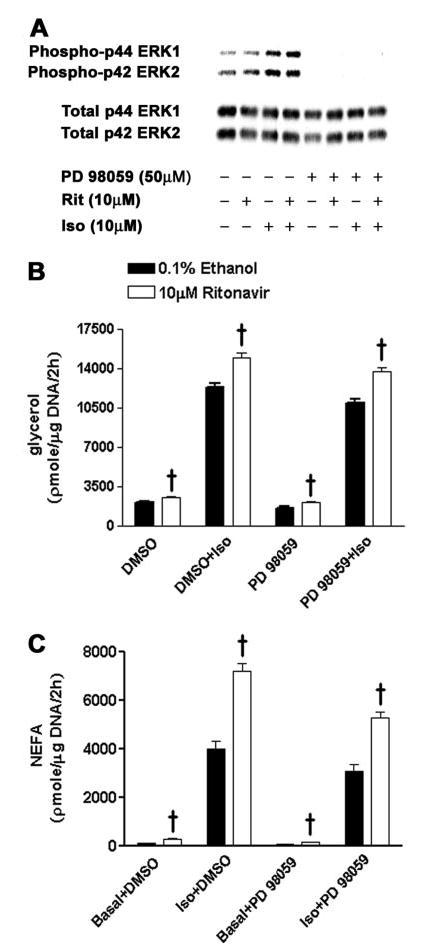
Activation of ERK 1 and 2 in 3T3-L1 adipocytes treated with ritonavir for 14 d. Samples from 2-h incubations were collected after 1-h preincubation with the ERK inhibitor PD 98059 [dissolved in 0.1% dimethylsulfoxide (DMSO)] or 0.1% DMSO. A, Representative Western blot; B, glycerol release; C, NEFA release; n = 14–15 from three independent experiments. †, P < 0.001, ritonavir vs. ethanol.
Discussion
Before studying lipolysis in 3T3-L1 adipocytes, we verified that, after chronic administration of ritonavir at a concentration commonly achieved in humans treated for HIV infection who develop lipodystrophy, ritonavir treatment did not affect differentiation of 3T3-L1 preadipocytes into adipocytes. We measured two markers of terminal differentiation: triglyceride accumulation and AP-2 protein expression. Our results agree with those reported by Dowell et al. (28), who found that treatment of 3T3-L1 cells for 6 d with ritonavir did not significantly affect triglyceride accumulation, although two prior studies using different cell culture model systems (31, 66) found less cellular triglyceride when cells were given 10 μm ritonavir. Several studies have reported inhibition of differentiation by protease inhibitors when 3T3-L1 cells and human adipocytes were treated with greater ritonavir concentrations (29, 67, 68). Importantly, Janneh et al. (35) reported that significant cytotoxicity occurs in 3T3-L1 confluent preadipocytes and differentiating adipocytes at doses of ritonavir above 10 μm. Consequently, it is not surprising that less differentiation has been reported under conditions where a higher dose of ritonavir was used. We therefore accounted for cell survival in all experiments by adjusting for total cellular DNA in each sample.
In the current study, 3T3-L1 adipocytes treated for 14 d with 10 μm ritonavir had significantly enhanced basal and Iso-stimulated lipolysis compared with ethanol controls. This enhancement was observed at Iso concentrations believed to be in the physiological range. Our results are consistent with prior studies using other aspartic acid protease inhibitors (34, 39), suggesting that alterations in lipolysis may be a general effect of many members of this class of compounds. To understand the mechanism for the enhancement, the potential role of PDE3B, a protein involved in inhibiting lipolysis (49, 51, 54), was studied. We found significantly less PDE3B activity in ritonavir-treated adipocytes in both basal and Iso-stimulated cells. This change could be explained by significantly lower PDE3B protein expression in ritonavir-treated cells, because the ability to phosphorylate PDE3B appeared unaffected by ritonavir. However, the decrease in PDE3B protein could not completely account for the effects of ritonavir on Iso-stimulated lipolysis, because when PDE3B activities of ritonavir- and ethanol-treated cells were made equivalent by pretreatment with PIA, the enhancement of lipolysis was not affected and was accompanied by little change in intracellular cAMP. Further, stimulation of ritonavir-treated adipocytes with N6cAMP, a nonhydrolysable cAMP analog that directly activated PKA (55, 58), resulted in augmented lipolysis. These data suggested that the potential mediator of ritonavir’s prolipolytic effect was downstream of PDE3B.
Because translocation of HSL and subsequent glycerol release are evident as early as 5 min after Iso stimulation in 3T3-L1 adipocytes (43), the phenomenon was studied at earlier time points. There were no changes in intracellular cAMP due to ritonavir treatment at any time point between 10 and 60 min after Iso stimulation, despite a progressive enhancement in glycerol release between 30 and 60 min These data are consistent with the notion that modulation of intracellular cAMP by PDE3B was not the key event in the observed effects of ritonavir.
Stimulation of ritonavir-treated 3T3-L1 adipocytes with N6cAMP resulted in a significant augmentation of lipolysis irrespective of pretreatment with PIA. These data suggested the possible involvement of PKA in the stimulatory effects of ritonavir. Because N6cAMP is known to preferentially activate type II PKA (58, 69), we determined whether there were any differences in protein expression of RIIα, RIIβ, and cat-α subunits. We found no differences due to ritonavir treatment in expression of any of these PKA subunits. In addition, despite the overall significant effect of Iso stimulation on percent PKA activation, there were no differences between ritonavir- and ethanol-treated cells in the extent of PKA activation at any of the time points studied.
The enhancement in lipolysis observed in ritonavir-treated cells did not begin until 30 min, and it became progressively larger between 60–120 min. This observation led us to consider the possibility that ritonavir might affect the interaction of lipid droplet surface proteins downstream of PKA. Subsequently, we examined two proteins that are phosphorylated by PKA during catecholamine-stimulated lipolysis and are involved in regulating lipolysis at the droplet surface: Peri and HSL (70–72). We observed an overall reduction in Peri protein expression of approximately 25% in ritonavir-treated cells, with no change in HSL expression. Lower Peri protein expression has also been observed after fully differentiated 3T3-L1 cells were exposed to increasing doses of the protease inhibitor nelfinavir for 18 h (34). Lower Peri expression may, in part, explain the enhanced basal lipolysis seen in ritonavir-treated adipocytes. Mice lacking Peri protein are lean and have elevated basal lipolysis (61, 64). However, primary adipocytes from mice lacking Peri appear to have attenuated catecholamine-stimulated lipolysis (61, 64). Thus, decreased Peri expression in ritonavir-treated cells does not appear likely to account for enhanced Iso-stimulated lipolysis.
It has been shown that phosphorylation of Peri A is necessary for maximal Iso-activated lipolysis in adipocytes (61–64). Interestingly, there is a 30-min lag period before fatty acid release is significantly increased above basal levels by Iso- or forskolin stimulation in CHO cells that are stably transfected with Peri and HSL (62, 63). In these cells, Sztalryd et al. (63) demonstrated that HSL and Peri work cooperatively in mediating forskolin- and IBMX-stimulated fatty acid release after the same 30-min lag period reported by Tansey et al. (62, 63). These data demonstrate that interactions of HSL and Peri at the droplet surface occur later in the time course of activated lipolysis, and their interactions are critical for catecholamine-mediated lipolysis. The degree to which HSL and Peri are phosphorylated during Iso-stimulated lipolysis may also be important in the ritonavir-mediated enhancement. Since we show enhanced Iso-stimulated lipolysis between 30 and 120 min, we hypothesize that changes in the phosphorylation and/or interactions of lipid droplet proteins in ritonavir-treated cells may possibly explain the enhancement observed upon Iso stimulation.
Activation of the MAPK pathway via the β3-receptor and subsequent phosphorylation of ERK1/2 by catecholamine stimulation have been reported to increase lipolysis in adipocytes (65, 69, 73) and may account for a significant percentage of the total lipolysis due to Iso stimulation (65, 74). Consequently, we examined the possibility that activation of the MAPK pathway might be responsible for some of the effects of ritonavir. However, after preincubation with a concentration of PD 98059 that virtually eliminated phosphorylation of ERK1/2, ritonavir-treated cells still showed enhanced basal and Iso-stimulated lipolysis. These data suggest that this MAPK pathway is not involved in the augmentation of lipolysis found in ritonavir-treated cells.
Limitations of the present study include the use of a murine fibroblast cell culture model system, which may not necessarily reflect the complexity of human adipocyte physiology and the study of only one HIV-treatment medication rather than the combination therapy often employed in the treatment of AIDS. Of particular relevance for the development of HIV-associated lipodystrophy, study of 3T3-L1 cells does not allow exploration of fat depot-specific differences, such as may be observed in the visceral compartment of whole animals, and thus cannot examine the contribution of differential lipolytic rates from various adipose depots to fatty acid flux in vivo. The interactions between different HIV medications that may affect lipolysis, such as protease inhibitors and nucleoside reverse transcriptase inhibitors (21), may be particularly important for a full understanding of the HIV-associated lipodystrophy syndrome. Although not done in the present study, it would also be of interest to examine the role of altered adipocytokine secretion in the augmented lipolysis seen with ritonavir, because there are newly reported data (75) showing increased IL-6 and IL-1β secretion in 11-d 3T3-L1 adipocytes after treatment with several protease inhibitors (including ritonavir) and nuclear reverse transcriptase inhibitors.
In summary, our data demonstrate that chronic treatment of 3T3-L1 adipocytes with 10 μm ritonavir leads to an increase in basal lipolysis and a progressive augmentation in Iso-stimulated lipolysis between 30–120 min, independent of any changes in intracellular cAMP. Further, when examining the potential roles of PDE3B and PKA in the Iso-stimulated augmentation, the data suggest that the mediator is downstream of these two proteins. Although the decrease in Peri protein expression may contribute to the augmentation of basal lipolysis observed, the etiology of the Iso-stimulated augmentation of lipolysis remains unclear. One pathway that might conceivably explain these findings involves activation of AMP-activated protein kinase during Iso stimulation. AMP-activated protein kinase has recently been shown to play a major role in maximal activation of Iso-stimulated lipolysis in 3T3-L1 adipocytes (76). Another possibility is that ritonavir changes the interaction of proteins at the lipid droplet surface that are considered important for catecholamine-stimulated lipolysis, such as Peri, HSL, caveolin-1, or CGI-58 (63, 77, 78).
Although the in vivo effects of protease inhibitors on lipolysis may involve interactions with other factors (e.g. insulin resistance, other therapeutic drugs, etc.), these data suggest that at least part of the lipodystrophic phenotype observed in HIV patients receiving protease inhibitor HAART regimens may be due to alterations in basal and catecholamine-stimulated lipolysis. Further studies are needed to confirm these findings with other protease inhibitors and in human adipocytes, both alone and in combination with other components of HAART.
Acknowledgments
We thank Dr. David Bernlohr from the University of Minnesota for generously donating AP-2 antibodies.
Footnotes
This work was supported by National Institutes of Health Grant Z01-HD-00641 (to J.A.Y.). Ritonavir was supplied under a material transfer agreement with Abbott Laboratories, Inc. J.A.Y. is a commissioned officer in the United States Public Health Service.
References
- 1.Eron JJ., Jr HIV-1 protease inhibitors. Clin Infect Dis. 2000;30(Suppl 2):S160–S170. doi: 10.1086/313853. [DOI] [PubMed] [Google Scholar]
- 2.Wlodawer A, Gustchina A. Structural and biochemical studies of retro-viral proteases. Biochim Biophys Acta. 2000;1477:16–34. doi: 10.1016/s0167-4838(99)00267-8. [DOI] [PubMed] [Google Scholar]
- 3.Rana KZ, Dudley MN. Human immunodeficiency virus protease inhibitors. Pharmacotherapy. 1999;19:35–59. doi: 10.1592/phco.19.1.35.30513. [DOI] [PubMed] [Google Scholar]
- 4.Wlodawer A, Vondrasek J. Inhibitors of HIV-1 protease: a major success of structure-assisted drug design. Annu Rev Biophys Biomol Struct. 1998;27:249–284. doi: 10.1146/annurev.biophys.27.1.249. [DOI] [PubMed] [Google Scholar]
- 5.Palella FJ, Jr, Delaney KM, Moorman AC, Loveless MO, Fuhrer J, Satten GA, Aschman DJ, Holmberg SD. Declining morbidity and mortality among patients with advanced human immunodeficiency virus infection. HIV Out-patient Study Investigators. N Engl J Med. 1998;338:853–860. doi: 10.1056/NEJM199803263381301. [DOI] [PubMed] [Google Scholar]
- 6.Acosta EP, Kakuda TN, Brundage RC, Anderson PL, Fletcher CV. Pharmacodynamics of human immunodeficiency virus type 1 protease inhibitors. Clin Infect Dis. 2000;30(Suppl 2):S151–S159. doi: 10.1086/313852. [DOI] [PubMed] [Google Scholar]
- 7.Miller KD, Jones E, Yanovski JA, Shankar R, Feuerstein I, Falloon J. Visceral abdominal-fat accumulation associated with use of indinavir. Lancet. 1998;351:871–875. doi: 10.1016/S0140-6736(97)11518-5. [DOI] [PubMed] [Google Scholar]
- 8.Tsiodras S, Mantzoros C, Hammer S, Samore M. Effects of protease inhibitors on hyperglycemia, hyperlipidemia, and lipodystrophy: a 5-year cohort study. Arch Intern Med. 2000;160:2050–2056. doi: 10.1001/archinte.160.13.2050. [DOI] [PubMed] [Google Scholar]
- 9.Vigouroux C, Gharakhanian S, Salhi Y, Nguyen TH, Adda N, Rozenbaum W, Capeau J. Adverse metabolic disorders during highly active antiretroviral treatments (HAART) of HIV disease. Diabetes Metab. 1999;25:383–392. [PubMed] [Google Scholar]
- 10.Christeff N, Melchior JC, de Truchis P, Perronne C, Nunez EA, Gougeon ML. Lipodystrophy defined by a clinical score in HIV-infected men on highly active antiretroviral therapy: correlation between dyslipidaemia and steroid hormone alterations. AIDS. 1999;13:2251–2260. doi: 10.1097/00002030-199911120-00007. [DOI] [PubMed] [Google Scholar]
- 11.Domingo P, Matias-Guiu X, Pujol RM, Francia E, Lagarda E, Sambeat MA, Vazquez G. Subcutaneous adipocyte apoptosis in HIV-1 protease inhibitor-associated lipodystrophy. AIDS. 1999;13:2261–2267. doi: 10.1097/00002030-199911120-00008. [DOI] [PubMed] [Google Scholar]
- 12.Carr A, Samaras K, Burton S, Law M, Freund J, Chisholm DJ, Cooper DA. A syndrome of peripheral lipodystrophy, hyperlipidaemia and insulin resistance in patients receiving HIV protease inhibitors. AIDS. 1998;12:F51–F58. doi: 10.1097/00002030-199807000-00003. [DOI] [PubMed] [Google Scholar]
- 13.Bastard JP, Caron M, Vidal H, Jan V, Auclair M, Vigouroux C, Luboinski J, Laville M, Maachi M, Girard PM, Rozenbaum W, Levan P, Capeau J. Association between altered expression of adipogenic factor SREBP1 in lipoatrophic adipose tissue from HIV-1-infected patients and abnormal adipocyte differentiation and insulin resistance. Lancet. 2002;359:1026–1031. doi: 10.1016/S0140-6736(02)08094-7. [DOI] [PubMed] [Google Scholar]
- 14.Behrens GM, Boerner AR, Weber K, van den Hoff J, Ockenga J, Brabant G, Schmidt RE. Impaired glucose phosphorylation and transport in skeletal muscle cause insulin resistance in HIV-1-infected patients with lipodystrophy. J Clin Invest. 2002;110:1319–1327. doi: 10.1172/JCI15626. [DOI] [PMC free article] [PubMed] [Google Scholar]
- 15.Calza L, Manfredi R, Farneti B, Chiodo F. Incidence of hyperlipidaemia in a cohort of 212 HIV-infected patients receiving a protease inhibitor-based antiretroviral therapy. Int J Antimicrob Agents. 2003;22:54–59. doi: 10.1016/s0924-8579(03)00100-6. [DOI] [PubMed] [Google Scholar]
- 16.Carr A. HIV protease inhibitor-related lipodystrophy syndrome. Clin Infect Dis. 2000;30(Suppl 2):S135–S142. doi: 10.1086/313854. [DOI] [PubMed] [Google Scholar]
- 17.Carr A, Samaras K, Thorisdottir A, Kaufmann GR, Chisholm DJ, Cooper DA. Diagnosis, prediction, and natural course of HIV-1 protease-inhibitor-associated lipodystrophy, hyperlipidaemia, and diabetes mellitus: a cohort study. Lancet. 1999;353:2093–2099. doi: 10.1016/S0140-6736(98)08468-2. (Comments) [DOI] [PubMed] [Google Scholar]
- 18.Carr A, Samaras K, Chisholm DJ, Cooper DA. Pathogenesis of HIV-1-protease inhibitor-associated peripheral lipodystrophy, hyperlipidaemia, and insulin resistance. Lancet. 1998;351:1881–1883. doi: 10.1016/S0140-6736(98)03391-1. [DOI] [PubMed] [Google Scholar]
- 19.Sekhar RV, Jahoor F, White AC, Pownall HJ, Visnegarwala F, Rodriguez-Barradas MC, Sharma M, Reeds PJ, Balasubramanyam A. Metabolic basis of HIV-lipodystrophy syndrome. Am J Physiol Endocrinol Metab. 2002;283:E332–E337. doi: 10.1152/ajpendo.00058.2002. [DOI] [PubMed] [Google Scholar]
- 20.Kotler DP, Ionescu G, Johnson JA, Inada Y, He Q, Engelson ES, Albu JB. Studies of adipose tissue metabolism in human immunodeficiency virus-associated lipodystrophy. Clin Infect Dis. 2003;37(Suppl 2):S47–S51. doi: 10.1086/375891. [DOI] [PubMed] [Google Scholar]
- 21.Hadigan C, Borgonha S, Rabe J, Young V, Grinspoon S. Increased rates of lipolysis among human immunodeficiency virus-infected men receiving highly active antiretroviral therapy. Metabolism. 2002;51:1143–1147. doi: 10.1053/meta.2002.34704. [DOI] [PubMed] [Google Scholar]
- 22.van der Valk M, Bisschop PH, Romijn JA, Ackermans MT, Lange JM, Endert E, Reiss P, Sauerwein HP. Lipodystrophy in HIV-1-positive patients is associated with insulin resistance in multiple metabolic pathways. AIDS. 2001;15:2093–2100. doi: 10.1097/00002030-200111090-00004. [DOI] [PubMed] [Google Scholar]
- 23.Meininger G, Hadigan C, Laposata M, Brown J, Rabe J, Louca J, Aliabadi N, Grinspoon S. Elevated concentrations of free fatty acids are associated with increased insulin response to standard glucose challenge in human immunodeficiency virus-infected subjects with fat redistribution. Metabolism. 2002;51:260–266. doi: 10.1053/meta.2002.29999. [DOI] [PubMed] [Google Scholar]
- 24.van der Valk M, Allick G, Weverling GJ, Romijn JA, Ackermans MT, Lange JM, van Eck-Smit BL, van Kuijk C, Endert E, Sauerwein HP, Reiss P. Markedly diminished lipolysis and partial restoration of glucose metabolism, without changes in fat distribution after extended discontinuation of protease inhibitors in severe lipodystrophic human immunodeficient virus-1-infected patients. J Clin Endocrinol Metab. 2004;89:3554–3560. doi: 10.1210/jc.2003-030985. [DOI] [PubMed] [Google Scholar]
- 25.Reeds DN, Mittendorfer B, Patterson BW, Powderly WG, Yarasheski KE, Klein S. Alterations in lipid kinetics in men with HIV-dyslipidemia. Am J Physiol Endocrinol Metab. 2003;285:E490–E497. doi: 10.1152/ajpendo.00118.2003. [DOI] [PubMed] [Google Scholar]
- 26.van der Valk M, Reiss P, van Leth FC, Ackermans MT, Endert E, Romijn JA, Heijligenberg R, Sauerwein H. Highly active antiretroviral therapy-induced lipodystrophy has minor effects on human immunodeficiency virus-induced changes in lipolysis, but normalizes resting energy expenditure. J Clin Endocrinol Metab. 2002;87:5066–5071. doi: 10.1210/jc.2002-020892. [DOI] [PubMed] [Google Scholar]
- 27.Hadigan C, Rabe J, Meininger G, Aliabadi N, Breu J, Grinspoon S. Inhibition of lipolysis improves insulin sensitivity in protease inhibitor-treated HIV-infected men with fat redistribution. Am J Clin Nutr. 2003;77:490–494. doi: 10.1093/ajcn/77.2.490. [DOI] [PubMed] [Google Scholar]
- 28.Dowell P, Flexner C, Kwiterovich PO, Lane MD. Suppression of preadipocyte differentiation and promotion of adipocyte death by HIV protease inhibitors. J Biol Chem. 2000;275:41325–41332. doi: 10.1074/jbc.M006474200. [DOI] [PubMed] [Google Scholar]
- 29.Zhang B, MacNaul K, Szalkowski D, Li Z, Berger J, Moller DE. Inhibition of adipocyte differentiation by HIV protease inhibitors. J Clin Endocrinol Metab. 1999;84:4274–4277. doi: 10.1210/jcem.84.11.6234. [DOI] [PubMed] [Google Scholar]
- 30.Gagnon A, Angel JB, Sorisky A. Protease inhibitors and adipocyte differentiation in cell culture. Lancet. 1998;352:1032. doi: 10.1016/S0140-6736(05)60074-8. (Letter) [DOI] [PubMed] [Google Scholar]
- 31.Lenhard JM, Furfine ES, Jain RG, Ittoop O, Orband-Miller LA, Blanchard SG, Paulik MA, Weiel JE. HIV protease inhibitors block adipogenesis and increase lipolysis in vitro. Antiviral Res. 2000;47:121–129. doi: 10.1016/s0166-3542(00)00102-9. [DOI] [PubMed] [Google Scholar]
- 32.Lenhard JM, Weiel JE, Paulik MA, Furfine ES. Stimulation of vitamin A(1) acid signaling by the HIV protease inhibitor indinavir. Biochem Pharmacol. 2000;59:1063–1068. doi: 10.1016/s0006-2952(00)00246-x. [DOI] [PubMed] [Google Scholar]
- 33.Ranganathan S, Kern PA. The HIV protease inhibitor saquinavir impairs lipid metabolism and glucose transport in cultured adipocytes. J Endocrinol. 2002;172:155–162. doi: 10.1677/joe.0.1720155. [DOI] [PubMed] [Google Scholar]
- 34.Rudich A, Vanounou S, Riesenberg K, Porat M, Tirosh A, Harman-Boehm I, Greenberg AS, Schlaeffer F, Bashan N. The HIV protease inhibitor nelfinavir induces insulin resistance and increases basal lipolysis in 3T3–L1 adipocytes. Diabetes. 2001;50:1425–1431. doi: 10.2337/diabetes.50.6.1425. [DOI] [PubMed] [Google Scholar]
- 35.Janneh O, Hoggard PG, Tjia JF, Jones SP, Khoo SH, Maher B, Back DJ, Pirmohamed M. Intracellular disposition and metabolic effects of zidovudine, stavudine and four protease inhibitors in cultured adipocytes. Antivir Ther. 2003;8:417–426. [PubMed] [Google Scholar]
- 36.Germinario RJ, Colby-Germinario SP, Cammalleri C, Wainberg MA. The long-term effects of anti-retroviral protease inhibitors on sugar transport in L6 cells. J Endocrinol. 2003;178:449–456. doi: 10.1677/joe.0.1780449. [DOI] [PubMed] [Google Scholar]
- 37.Cammalleri C, Germinario RJ. The effects of protease inhibitors on basal and insulin-stimulated lipid metabolism, insulin binding, and signaling. J Lipid Res. 2003;44:103–108. doi: 10.1194/jlr.m200245-jlr200. [DOI] [PubMed] [Google Scholar]
- 38.Murata H, Hruz PW, Mueckler M. The mechanism of insulin resistance caused by HIV protease inhibitor therapy. J Biol Chem. 2000;275:20251–20254. doi: 10.1074/jbc.C000228200. [DOI] [PubMed] [Google Scholar]
- 39.Ben-Romano R, Rudich A, Torok D, Vanounou S, Riesenberg K, Schlaeffer F, Klip A, Bashan N. Agent and cell-type specificity in the induction of insulin resistance by HIV protease inhibitors. AIDS. 2003;17:23–32. doi: 10.1097/00002030-200301030-00005. [DOI] [PubMed] [Google Scholar]
- 40.Laemmli UK. Cleavage of structural proteins during the assembly of the head of bacteriophage T4. Nature. 1970;227:680–685. doi: 10.1038/227680a0. [DOI] [PubMed] [Google Scholar]
- 41.Servetnick DA, Brasaemle DL, Gruia-Gray J, Kimmel AR, Wolff J, Londos C. Perilipins are associated with cholesteryl ester droplets in steroidogenic adrenal cortical and Leydig cells. J Biol Chem. 1995;270:16970–16973. doi: 10.1074/jbc.270.28.16970. [DOI] [PubMed] [Google Scholar]
- 42.Brasaemle DL, Barber T, Wolins NE, Serrero G, Blanchette-Mackie EJ, Londos C. Adipose differentiation-related protein is an ubiquitously expressed lipid storage droplet-associated protein. J Lipid Res. 1997;38:2249–2263. [PubMed] [Google Scholar]
- 43.Brasaemle DL, Levin DM, Adler-Wailes DC, Londos C. The lipolytic stimulation of 3T3–L1 adipocytes promotes the translocation of hormone-sensitive lipase to the surfaces of lipid storage droplets. Biochim Biophys Acta. 2000;1483:251–262. doi: 10.1016/s1388-1981(99)00179-1. [DOI] [PubMed] [Google Scholar]
- 44.Ahmad F, Cong LN, Stenson Holst L, Wang LM, Rahn Landstrom T, Pierce JH, Quon MJ, Degerman E, Manganiello VC. Cyclic nucleotide phosphodiesterase 3B is a downstream target of protein kinase B and may be involved in regulation of effects of protein kinase B on thymidine incorporation in FDCP2 cells. J Immunol. 2000;164:4678–4688. doi: 10.4049/jimmunol.164.9.4678. [DOI] [PubMed] [Google Scholar]
- 45.Downs TR, Wilfinger WW. Fluorometric quantification of DNA in cells and tissue. Anal Biochem. 1983;131:538–547. doi: 10.1016/0003-2697(83)90212-9. [DOI] [PubMed] [Google Scholar]
- 46.Folch J, Lees M, Sloane Stanley GH. A simple method for the isolation and purification of total lipides from animal tissues. J Biol Chem. 1957;226:497–509. [PubMed] [Google Scholar]
- 47.Bradley DC, Kaslow HR. Radiometric assays for glycerol, glucose, and glycogen. Anal Biochem. 1989;180:11–16. doi: 10.1016/0003-2697(89)90081-x. [DOI] [PubMed] [Google Scholar]
- 48.Davis CW, Daly JW. A simple direct assay of 3′,5′-cyclic nucleotide phosphodiesterase activity based on the use of polyacrylamide-bononate affinity gel chromatography. J Cyclic Nucleotide Res. 1979;5:65–74. [PubMed] [Google Scholar]
- 49.Rahn Landstrom T, Mei J, Karlsson M, Manganiello V, Degerman E. Down-regulation of cyclic-nucleotide phosphodiesterase 3B in 3T3–L1 adipocytes induced by tumour necrosis factor α and cAMP. Biochem J. 2000;346(Pt 2):337–343. doi: 10.1042/bj3460337. [DOI] [PMC free article] [PubMed] [Google Scholar]
- 50.Honnor RC, Dhillon GS, Londos C. cAMP-dependent protein kinase and lipolysis in rat adipocytes. I. Cell preparation, manipulation, and predictability in behavior. J Biol Chem. 1985;260:15122–15129. [PubMed] [Google Scholar]
- 51.Degerman E, Belfrage P, Manganiello VC. Structure, localization, and regulation of cGMP-inhibited phosphodiesterase (PDE3) J Biol Chem. 1997;272:6823–6826. doi: 10.1074/jbc.272.11.6823. [DOI] [PubMed] [Google Scholar]
- 52.Mei J, Holst LS, Landstrom TR, Holm C, Brindley D, Manganiello V, Degerman E. C(2)-ceramide influences the expression and insulin-mediated regulation of cyclic nucleotide phosphodiesterase 3B and lipolysis in 3T3–L1 adipocytes. Diabetes. 2002;51:631–637. doi: 10.2337/diabetes.51.3.631. [DOI] [PubMed] [Google Scholar]
- 53.Elks ML, Jackson M, Manganiello VC, Vaughan M. Effect of N6-(L-2-phenylisopropyl)adenosine and insulin on cAMP metabolism in 3T3–L1 adipocytes. Am J Physiol. 1987;252:C342–C348. doi: 10.1152/ajpcell.1987.252.3.C342. [DOI] [PubMed] [Google Scholar]
- 54.Shakur Y, Holst LS, Landstrom TR, Movsesian M, Degerman E, Manganiello V. Regulation and function of the cyclic nucleotide phosphodiesterase (PDE3) gene family. Prog Nucleic Acid Res Mol Biol. 2001;66:241–277. doi: 10.1016/s0079-6603(00)66031-2. [DOI] [PubMed] [Google Scholar]
- 55.Beebe SJ, Redmon JB, Blackmore PF, Corbin JD. Discriminative insulin antagonism of stimulatory effects of various cAMP analogs on adipocyte lipolysis and hepatocyte glycogenolysis. J Biol Chem. 1985;260:15781–15788. [PubMed] [Google Scholar]
- 56.Nakada MT, Stadel JM, Crooke ST. Subtype-selective regulation of β adrenergic receptor-adenylyl cyclase coupling by phorbol esters in 3T3–L1 fibroblasts. J Pharmacol Exp Ther. 1990;253:221–229. [PubMed] [Google Scholar]
- 57.Xue B, Greenberg AG, Kraemer FB, Zemel MB. Mechanism of intracellular calcium ([Ca2+]i) inhibition of lipolysis in human adipocytes. FASEB J. 2001;15:2527–2529. doi: 10.1096/fj.01-0278fje. [DOI] [PubMed] [Google Scholar]
- 58.Beebe SJ, Holloway R, Rannels SR, Corbin JD. Two classes of cAMP analogs which are selective for the two different cAMP-binding sites of type II protein kinase demonstrate synergism when added together to intact adipocytes. J Biol Chem. 1984;259:3539–3547. [PubMed] [Google Scholar]
- 59.Sztalryd C, Komaromy MC, Kraemer FB. Overexpression of hormone-sensitive lipase prevents triglyceride accumulation in adipocytes. J Clin Invest. 1995;95:2652–2661. doi: 10.1172/JCI117967. [DOI] [PMC free article] [PubMed] [Google Scholar]
- 60.Zhang HH, Souza SC, Muliro KV, Kraemer FB, Obin MS, Greenberg AS. Lipase-selective functional domains of perilipin A differentially regulate constitutive and protein kinase A-stimulated lipolysis. J Biol Chem. 2003;278:51535–515342. doi: 10.1074/jbc.M309591200. [DOI] [PubMed] [Google Scholar]
- 61.Tansey JT, Sztalryd C, Gruia-Gray J, Roush DL, Zee JV, Gavrilova O, Reitman ML, Deng CX, Li C, Kimmel AR, Londos C. Perilipin ablation results in a lean mouse with aberrant adipocyte lipolysis, enhanced leptin production, and resistance to diet-induced obesity. Proc Natl Acad Sci USA. 2001;98:6494–6499. doi: 10.1073/pnas.101042998. [DOI] [PMC free article] [PubMed] [Google Scholar]
- 62.Tansey JT, Huml AM, Vogt R, Davis KE, Jones JM, Fraser KA, Brasaemle DL, Kimmel AR, Londos C. Functional studies on native and mutated forms of perilipins. A role in protein kinase A-mediated lipolysis of triacylglycerols. J Biol Chem. 2003;278:8401–8406. doi: 10.1074/jbc.M211005200. [DOI] [PubMed] [Google Scholar]
- 63.Sztalryd C, Xu G, Dorward H, Tansey JT, Contreras JA, Kimmel AR, Londos C. Perilipin A is essential for the translocation of hormone-sensitive lipase during lipolytic activation. J Cell Biol. 2003;161:1093–1103. doi: 10.1083/jcb.200210169. [DOI] [PMC free article] [PubMed] [Google Scholar]
- 64.Martinez-Botas J, Anderson JB, Tessier D, Lapillonne A, Chang BH, Quast MJ, Gorenstein D, Chen KH, Chan L. Absence of perilipin results in leanness and reverses obesity in Lepr(db/db) mice. Nat Genet. 2000;26:474–479. doi: 10.1038/82630. [DOI] [PubMed] [Google Scholar]
- 65.Greenberg AS, Shen WJ, Muliro K, Patel S, Souza SC, Roth RA, Kraemer FBl. Stimulation of lipolysis and hormone-sensitive lipase via the extracellular signal-regulated kinase pathway. J Biol Chem. 2001;276:45456–454561. doi: 10.1074/jbc.M104436200. [DOI] [PubMed] [Google Scholar]
- 66.Jain RG, Lenhard JM. Select HIV protease inhibitors alter bone and fat metabolism ex vivo. J Biol Chem. 2002;277:19247–192450. doi: 10.1074/jbc.C200069200. [DOI] [PubMed] [Google Scholar]
- 67.Vernochet C, Azoulay S, Duval D, Guedj R, Ailhaud G, Dani C. Differential effect of HIV protease inhibitors on adipogenesis: intracellular ritonavir is not sufficient to inhibit differentiation. AIDS. 2003;17:2177–2180. doi: 10.1097/01.aids.0000088160.01779.2b. [DOI] [PubMed] [Google Scholar]
- 68.Vernochet C, Azoulay S, Duval D, Guedj R, Cottrez F, Vidal H, Ailhaud G, Dani C. Human immunodeficiency virus protease inhibitors accumulate into cultured human adipocytes and alter expression of adipocytokines. J Biol Chem. 2004;280:2238–2243. doi: 10.1074/jbc.M408687200. [DOI] [PubMed] [Google Scholar]
- 69.Fricke K, Heitland A, Maronde E. Cooperative activation of lipolysis by PKA and PKC pathways in 3T3–L1 adipocytes. Endocrinology. 2004;145:4940–4947. doi: 10.1210/en.2004-0803. [DOI] [PubMed] [Google Scholar]
- 70.Greenberg AS, Egan JJ, Wek SA, Moos MC, Jr, Londos C, Kimmel AR. Isolation of cDNAs for perilipins A and B: sequence and expression of lipid droplet-associated proteins of adipocytes. Proc Natl Acad Sci USA. 1993;90:12035–12039. doi: 10.1073/pnas.90.24.12035. [DOI] [PMC free article] [PubMed] [Google Scholar]
- 71.Holm C, Osterlund T, Laurell H, Contreras JA. Molecular mechanisms regulating hormone-sensitive lipase and lipolysis. Annu Rev Nutr. 2000;20:365–393. doi: 10.1146/annurev.nutr.20.1.365. [DOI] [PubMed] [Google Scholar]
- 72.Greenberg AS, Egan JJ, Wek SA, Garty NB, Blanchette-Mackie EJ, Londos C. Perilipin, a major hormonally regulated adipocyte-specific phospho-protein associated with the periphery of lipid storage droplets. J Biol Chem. 1991;266:11341–11346. [PubMed] [Google Scholar]
- 73.Soeder KJ, Snedden SK, Cao W, Della Rocca GJ, Daniel KW, Luttrell LM, Collins S. The β3-adrenergic receptor activates mitogen-activated protein kinase in adipocytes through a Gi-dependent mechanism. J Biol Chem. 1999;274:12017–12022. doi: 10.1074/jbc.274.17.12017. [DOI] [PubMed] [Google Scholar]
- 74.Collins S, Cao W, Robidoux J. Learning new tricks from old dogs: β-adrenergic receptors teach new lessons on firing up adipose tissue metabolism. Mol Endocrinol. 2004;18:2123–2131. doi: 10.1210/me.2004-0193. [DOI] [PubMed] [Google Scholar]
- 75.Lagothu C, Bastard JP, Auclair M, Maachi M, Kornprobst M, Capeau J, Caron M. Antiretroviral drugs with adverse effects on adipocyte lipid metabolism and survival alter the expression and secretion of proinflammatory cytokines and adiponectin in vitro. Antivir Ther. 2004;9:911–920. [PubMed] [Google Scholar]
- 76.Yin W, Mu J, Birnbaum MJ. Role of AMP-activated protein kinase in cyclic AMP-dependent lipolysis in 3T3–L1 adipocytes. J Biol Chem. 2003;278:43074–43080. doi: 10.1074/jbc.M308484200. [DOI] [PubMed] [Google Scholar]
- 77.Subramanian V, Rothenberg A, Gomez C, Cohen AW, Garcia A, Bhattacharyya S, Shapiro L, Dolios G, Wang R, Lisanti MP, Brasaemle DL. Perilipin A mediates the reversible binding of CGI-58 to lipid droplets in 3T3–L1 adipocytes. J Biol Chem. 2004;279:42062–42071. doi: 10.1074/jbc.M407462200. [DOI] [PubMed] [Google Scholar]
- 78.Cohen AW, Razani B, Schubert W, Williams TM, Wang XB, Iyengar P, Brasaemle DL, Scherer PE, Lisanti MP. Role of caveolin-1 in the modulation of lipolysis and lipid droplet formation. Diabetes. 2004;53:1261–1270. doi: 10.2337/diabetes.53.5.1261. [DOI] [PubMed] [Google Scholar]