

Abstract
Surface properties of aerosols in the Mexico City metropolitan area have been measured in a variety of exposure scenarios related to vehicle emissions in 2002, using continuous, real-time instruments. The objective of these experiments is to describe ambient and occupational particulate polycyclic aromatic hydrocarbon (PAH) concentrations associated with vehicular traffic and facilities using diesel vehicles. Median total particulate PAH concentrations along Mexico City’s roadways range from 60 to 910 ng m−3, averaged over a minimum of 1 h. These levels are approximately 5 times higher than concentrations measured in the United States and among the highest measured ambient values reported in the literature. The ratio of particulate PAH concentration to aerosol active surface area is much higher along roadways and in other areas of fresh vehicle emissions, compared to ratios measured at sites influenced more by aged emissions or noncombustion sources. For particles freshly emitted by vehicles, PAH and elemental carbon (EC) concentrations are correlated because they both originate during the combustion process. Comparison of PAH versus EC and active surface area concentrations at different locations suggests that surface PAH concentrations may diminish with particle aging. These results indicate that exposure to vehicle-related PAH emissions on Mexico City’s roadways may present an important public health risk.
Introduction
A growing body of research is linking health effects such as lung cancer and cardiopulmonary mortality to fine particulate air pollution (1). Due to methodological constraints, the quantification of particulate matter has focused mainly on mass and number properties. However, surface properties of particles may be at least as important as mass in assessing their health effects (2, 3). Surface properties also affect hygroscopicity (4, 5) and heterogeneous chemistry—gas–particle reactions that could alter their chemical composition. New methods allow fast, continuous characterization of aerosol photoemission activity and active surface area using portable, battery-powered instruments. Particulate polycyclic aromatic hydrocarbons (PAHs) —combustion byproducts which include some potent carcinogens and mutagens—can be detected by photoemission induced by exposure to ultraviolet light (6).
The Mexico City metropolitan area (MCMA) is making progress in improving its air quality, but the city’s nearly 20 million inhabitants, 3.5 million vehicles, 35000 industries, semitropical latitude, ring of mountains, and 2200 m altitude all contribute to a challenging air quality problem. Ozone levels exceed the health-based standard, which is equivalent to the U.S. standard, on approximately 80% of all days; concentrations of particulate matter of diameter 10 μm and less (PM10) exceed the standard on more than 40% of all days in most years (7). While the literature on particulate matter properties in the MCMA is growing, PAHs have been quantified in only one study and one location in the area (8). Emissions from combustion sources are a major contributor to the MCMA’s air pollution (7), and we expect that PAH levels are high and might contribute to adverse health effects (9).
Here, we describe a series of three field studies conducted in 2002 that have added significantly to the characterization of particulate matter in the MCMA. In all three studies, we measured particulate PAH and active surface area concentrations, along with other mass properties, continuously. One investigation measured particles at three facilities where diesel emissions were expected to be high, another focused on the exposure of commuters to particulate pollution on different routes and modes of transportation, and the third employed a mobile laboratory to chase vehicles and measure pollution at many locations in the MCMA. The objective of this study is to describe ambient and occupational particulate PAH concentrations associated with vehicular traffic and facilities using diesel vehicles in the MCMA. We also characterize specific types of particles using the ratio of total PAH content to active surface area, and examine the relationship between PAH concentrations and other particulate and meteorological parameters.
Experimental Section
Diesel Exposure Study.
As part of a larger epidemiological study designed to characterize exposure to diesel-generated and other particles associated with roadway exposures in truck cabs and in urban and rural areas of North America (10), we focused on three facilities in the MCMA where high concentrations of diesel exhaust were expected: (i) a distribution center in Cuautitlán Izcalli in the northern industrial part of the city, (ii) a cargo terminal in the manufacturing sector of Vallejo, where locally made products were unloaded from small delivery vehicles and then loaded onto heavy-duty diesel trucks for transport throughout the country, and (iii) a major passenger bus terminal in San Lázaro. The study took place on Oct 21–26, 2002, with sampling at the distribution center and cargo terminal on the first 5 days and sampling at the bus terminal on the last day. Figure 1 shows the sampling locations of all studies.
FIGURE 1.
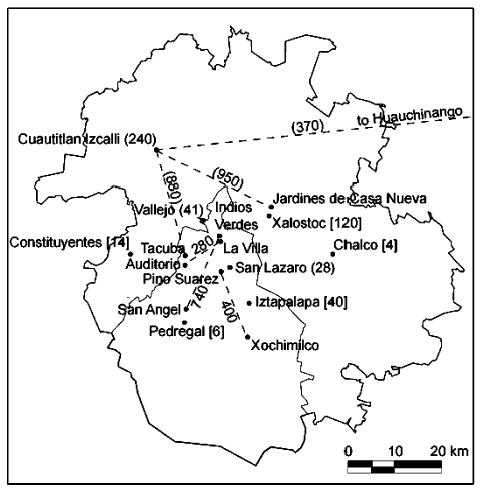
Map showing measurement locations in the Mexico City metropolitan area and arithmetic mean 9 a.m. to 12 p.m. ambient TPAH concentrations at fixed locations and along routes between locations (shown along dashed lines). Measurements from the diesel exposure study in October 2002 are shown in parentheses. Those from the commuter study in June to July 2002 are plain numbers, and those from the mobile laboratory study in February 2002 are shown in brackets. The interior boundary represents the limits of the Federal District.
The distribution center was located in a warehouse measuring approximately 140 m by 100 m by 10 m high. Four large warehouse doors were kept open during operating hours. The trucks idled their engines inside the warehouse for no more than a few minutes and were loaded by two forklifts powered by liquefied petroleum gas (LPG). Typically, 5–10 tractor trailers, all late model year, passed through the loading area during an 8 h daytime shift. We collected samples from a desk located within 20 m of most vehicle activity. For comparison, we also collected samples at a background site on the upwind side of the property. Each morning, we outfitted two of the delivery trucks with sampling equipment that was placed in the cab next to the driver for 5–8 h delivery trips to other distribution centers around the MCMA. Smoking was not allowed in the loading dock area, and all truck drivers were nonsmokers. In all cases, the truck’s windows were open during the sampling.
The cargo terminal consisted of two parallel 210 m by 30 m by 7 m high warehouses and a large, unpaved parking area on either side of the buildings. Goods were delivered through the open doors on one side of each warehouse, manually moved into the warehouse, and then loaded onto trailers parked along the opposite side of the warehouse. No vehicles were operated inside the warehouse. During work hours between 9 a.m. and 6 p.m., 100–250 vehicles per hour entered the terminal. The approximate vehicle mix included 5% diesel trucks with four or more axles, 5% gasoline and diesel trucks with three axles, 40% trucks with two axles and six tires, one-quarter of which were diesel-powered, 40% gasoline pickup trucks or vans, and 10% passenger cars. Background samplers were situated on the upwind side of the terminal area, at the edge of an unpaved parking lot and bounded by a rarely used gravel road just outside the terminal’s property. Smoking was not allowed inside the warehouses, but occasionally, smokers lingered just outside the buildings.
The bus terminal housed ~10 companies using ~30 departure and ~30 arrival gates. Monitoring equipment was installed near the departure and arrival gates of one of the largest bus companies, at an upwind site outside the main buildings, and inside a small booth where all buses passed upon exiting the terminal. About 2500 buses entered and exited the terminal each day. Smoking was allowed at this facility.
Commuter Study.
During six weeks in June and July 2002, we studied the exposure of commuters using different modes of transportation on three routes in the city: between Indios Verdes and San Angel, between Pino Suarez and Xochimilco, and between La Villa and Auditorio. Researchers carried portable sampling equipment on large diesel buses that followed established routes and stops, on gasoline-powered microbuses known as colectivos, which stopped along the route to pick up and drop off passengers, in gasoline-powered cars, and on the metro, electrically powered rail transit that runs both above and below ground, during the weekday morning and evening commutes. During each trip, we also noted whether the windows were open or closed and whether people were smoking inside the vehicle.
Mobile Laboratory Study.
On February 11–23, 2002, a van outfitted with air sampling equipment, designed and operated by Aerodyne Research, Inc., drove throughout the MCMA. It pursued specific vehicles to study their emissions, drove transects across the city to measure the spatial variation in pollutants, and parked at several locations in the city: Chalco, Constituyentes, Iztapalapa, Pedregal, and Xalostoc. Figure 1 shows the locations of these sites. The nine individual mobile episodes presented in Figure 3 each lasted 1–10 h, and the van drove through many parts of the city during these events. The particulate instruments were mounted on a shelf in the van, and they sampled ambient air through an inlet on the front of the van about 2 m above the ground. The stainless steel and Tygon sampling lines were designed to minimize particle deposition.
FIGURE 3.
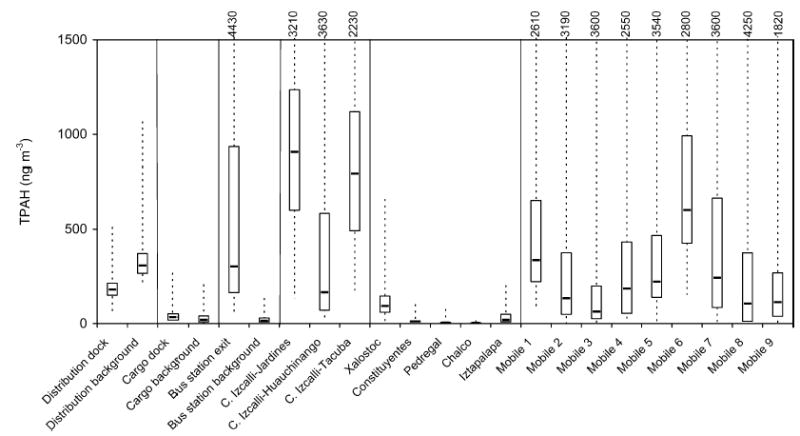
Box plots showing the minimum, 25th percentile, median, 75th percentile, and maximum TPAH concentrations measured during the diesel exposure and mobile laboratory experiments.
Seasonal Effects.
The diesel and mobile laboratory studies were conducted during Mexico City’s dry season, which runs from November to April. Clear skies and anticyclonic weather prevail with the formation of surface-based radiation inversions (11, 12). The commuter study was conducted during the wet season, when moist trade wind currents bring convective rain showers. Table 1 shows average meteorological and air quality parameters at Merced, a routine monitoring station located in central Mexico City, during the three experiments. Temperature and relative humidity are slightly lower, 15 °C and 50%, respectively, during the mobile laboratory experiment than during the other two experiments when these averages are 18 °C and 60%. PM10 concentration illustrates overall particulate concentrations, and ozone concentration indicates levels of photochemical activity. Although PM10 concentrations are highest in February, particulate concentrations measured during the mobile laboratory study in February are not necessarily higher than those measured during other times of the year. Ozone concentrations are similar during the mobile laboratory and diesel exposure experiments, so differences in the background particulate concentrations measured during these two experiments should not be strongly influenced by photochemistry. Due to the close proximity of the sampling equipment to sources of emissions in the diesel exposure and commuter studies, we expect measurements from these studies to be more strongly impacted by local sources of emissions and local dispersion patterns than by seasonal climatological variations.
TABLE 1.
Average Meteorological and Air Quality Parameters at Merced in Central Mexico City during the Three Experiments
| dates in 2002 | experiment | T(°C) | RH (%) | wind speed (m s−1) | wind directiona | daily max PM10concn (μg m−3) | daily max ozone concn (ppb) |
|---|---|---|---|---|---|---|---|
| Feb 11–23 | mobile laboratory | 15 | 51 | 1.4 | NE | 111 | 100 |
| Jun 3–Jul 19 | commuter | 18 | 60 | 1.5 | NW | 81 | 128 |
| Oct 21–26 | diesel exposure | 18 | 61 | 1.2 | NW | 92 | 91 |
Wind is blowing from the direction indicated.
Aerosol Measurements.
In all experiments, we measured aerosol surface properties using four pairs of a photoelectric aerosol sensor and a diffusion charger (PAS 2000 CE and DC 2000 CE, EcoChem), which quantify particulate PAHs (13–15) and aerosol active surface area (16), respectively. Aerosol active surface area affects condensation on particles, heterogeneous chemistry (e.g., reaction of gaseous species with particulate PAHs), and particle deposition (17). Normalizing the PAH concentration by active surface area provides information about the chemical composition of the particle (18) because particles from different combustion sources have different ratios of PAH concentration to surface area concentration. For example, the PAH concentration to surface area concentration ratio is nearly 3 times higher for candle soot versus diesel exhaust (16), and the ratio is much higher for diesel exhaust diluted at 24 versus 16 °C, due to the presence of nonphotoemitting nucleation mode particles at the lower temperature (19). We expect particles of noncombustion origin to have PAH concentration to surface area concentration ratios that are near zero.
The instruments logged data in either 10 s or 1 min intervals, and we later averaged all data over 1 min intervals to produce a uniform time series. The PAS quantifies photoemission activity of the aerosols, reporting results as “total” PAH (TPAH) concentration in nanograms per cubic meter. Henceforth, “TPAH concentration” will refer to the particulate PAH concentration as quantified by the EcoChem PAH analyzer, and “PAH” will continue to refer to the class of compounds more generally. The method is specific to particles with diameters ~1–2 μm or less. The instruments are factory-calibrated using a variety of soot sources for TPAH concentrations up to 1000 ng m−3 and active surface area concentrations up to 1000 mm2 m−3, and the sensors are expected to give a linear response up to 5000 ng m−3 or 5000 mm2 m−3. Previous studies have shown a strong correlation between photoelectric charging and TPAH concentrations for a variety of aerosols: oil burner exhaust, cigarette smoke, parking garage air, and ambient urban air in different cities (17). The slopes of the plots of the 1 min averages of TPAH and active surface area concentrations were also calculated to assess whether differences existed among the various exposure scenarios.
The PAS output is an indicator of the total surface-associated PAH concentration (typically found in soot) against which the photoemission aerosol sensor has been calibrated, but it is not an absolute total. The exact response of the PAS depends on particle size and geometry, surface coating characteristics, PAH speciation, and other properties; nevertheless, it can be used as a semiquantitative indication of particulate PAH concentrations. We calibrated the four portable photoelectric aerosol sensors against a full-size EcoChem PAS 2000 analyzer during the diesel study, and we cross-corrected three diffusion chargers against the fourth to allow for meaningful comparisons of data collected by different instruments. The tests, during which we colocated all instruments and operated them simultaneously, employed ambient air at the bus station that was heavily polluted by diesel exhaust and ambient air at ~10 m above ground level in central Mexico City. The limits of detection were 1 ng m−3 and 1 mm2 m−3 for TPAH and active surface area concentrations, respectively. Because measured concentrations were typically at least an order of magnitude higher, we retained all zero concentration values in calculation of our summary statistics.
We measured the mass concentration of PM2.5 using several particle photometers (DustTrak 8520, TSI Inc.) equipped with size-selective impactors and recording at 1 min intervals. We calibrated the photometers against concurrent gravimetric PM2.5 measurements. As an additional method of particle characterization, we calculated the ratio of mass to surface area, which equals one-sixth the product of the mass density and particle diameter if the aerosol is represented as monodisperse and spherical.
Other measurements made during the diesel exposure study include PM1.0 elemental (EC) and organic (OC) carbon using the National Institute for Occupational Safety and Health thermal optical method (NIOSH 5040), and temperature and humidity readings recorded every minute (HOBO, Onset Computer Corp., Bourne, MA).
Results
One minute TPAH concentrations fluctuate widely on roadways, as shown in Figure 2. The time series shows TPAH, active surface area, and PM2.5 concentration measurements from inside the cab of a delivery truck with its windows open during a trip between the distribution center in Cuautitlán Izcalli and a warehouse in Tacuba. High and widely varying concentrations clearly indicate when the vehicle was on the road versus parked. The truck left the distribution center at 8:49 a.m., at which point all measures of particle characteristics sharply increased. The drop in concentrations at approximately 9:00 a.m. occurred when the truck stopped to refuel. Particle concentrations were high and variable while the truck was driving to Tacuba and on the return trip. The truck arrived at the Tacuba warehouse at 10:14 a.m., unloaded its cargo, and left at 10:58 a.m.; particle concentrations were lower and more stable during this period. The three measures of particle characteristics are generally correlated, except for a few spikes of high PM2.5 concentrations. These events may indicate plumes of particles larger than 1 μm, which are not detected by the other two instruments.
FIGURE 2.
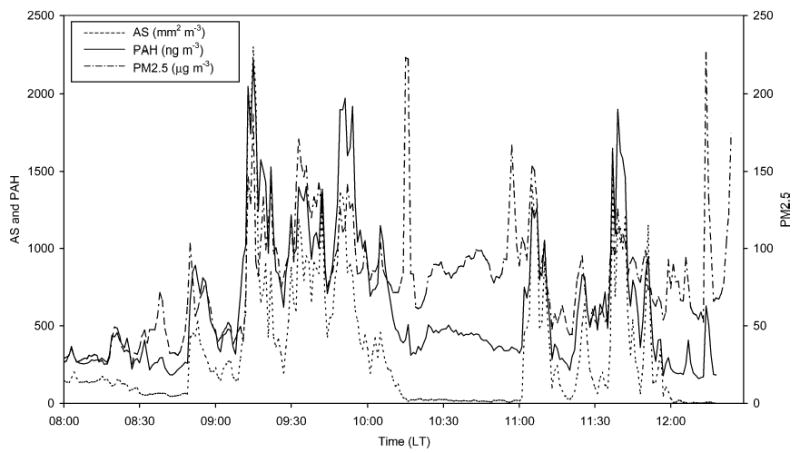
Time series showing active surface, TPAH, and PM2.5 concentrations during the truck trip between Cuautitlán Izcalli and Tacuba. The truck was parked at a warehouse between approximately 10:15 and 11:00 a.m.
Figure 3 shows box plots of TPAH concentrations for the three diesel vehicle terminals and the three trips originating from them, and for stationary sites and mobile events monitored during the mobile laboratory study. All events lasted at least 1 h and therefore contain at least 60 1 min data points. Among the three terminals, the highest TPAH concentrations are found at the distribution center and the bus station exit booth, with median TPAH concentrations of 180–310 ng m−3. Concentrations at the stationary sites of Xalostoc, Constituyentes, Pedregal, Chalco, and Iztapalapa are relatively low, with medians of 4–90 ng m−3. At most locations, the distribution of concentrations is log-normal, with most values clustered at the low end and some extremely high values. In general, we observe much higher concentrations on the roadways with medians of 60–910 ng m−3 during the three delivery trips originating from Cuautitlán Izcalli and the nine mobile laboratory events.
Figure 1 shows the mean ambient TPAH concentrations measured at stationary sites between 9 a.m. and 12 p.m. in the three studies. We show this time period because it captures the diluted effects of the morning rush hour, and the most data are available for site-to-site intercomparison during these hours. At the ambient sites visited by the mobile laboratory, mean TPAH concentrations range from 4 ng m−3 at Chalco to 120 ng m−3 at Xalostoc, which is in the northern industrial part of the region. The mean late-morning TPAH concentrations at all other stationary sites are less than 50 ng m−3.
The premise of the diesel exposure study was that high particle concentrations would be observed in occupational settings: the loading dock areas of warehouses with diesel truck traffic. However, the highest TPAH concentrations, sometimes by an order of magnitude, were observed along the roadways. Figure 3 shows the range of TPAH concentrations measured inside the cabs of delivery trucks on routes originating from and returning to the distribution center. The truck samples reflect roadway concentrations that are influenced by the exhaust of all nearby vehicles. The samples are unlikely to be strongly influenced by exhaust specifically from the diesel truck carrying them, as the tailpipe directs exhaust from these trucks upward and behind the cab containing the sampling equipment. On the routes between the distribution center and Jardines and Tacuba, the median TPAH concentrations are 910 ng m−3. Median concentrations are lower, 170 ng m−3, on the route to Huauchinango, a 3 h drive from Mexico City, because traffic along this highway is less dense and other sources of particulate matter less prevalent than in the MCMA. Extremely high maximum concentrations of several thousand nanograms per cubic meter occur at the bus station exit and along the roadways traveled by the delivery trucks.
Results from the commuter and mobile laboratory studies show that high exposures to PAHs in the MCMA are not limited to drivers of diesel trucks, but can in fact be experienced by any driver or passenger on Mexico City’s roadways. TPAH concentrations are also very high in other modes of transit. Figure 4 shows the median TPAH concentration by mode of transit and route, and Figure 1 shows mean concentrations along each route. TPAH concentrations are slightly higher in microbuses compared to buses and cars, but concentrations vary more by route than by mode of transit. We did not detect a significant relationship between TPAH concentrations and window position—open or closed— for any vehicle type in these experiments. Median TPAH concentrations (not shown) on the metro system are lower, around 200 ng m−3, on all routes. Roadway TPAH concentrations vary by route, with the highest values found along the Indios Verdes–San Angel route and the lowest found along the La Villa–Auditorio route, where roadway and metro concentrations are similar.
FIGURE 4.
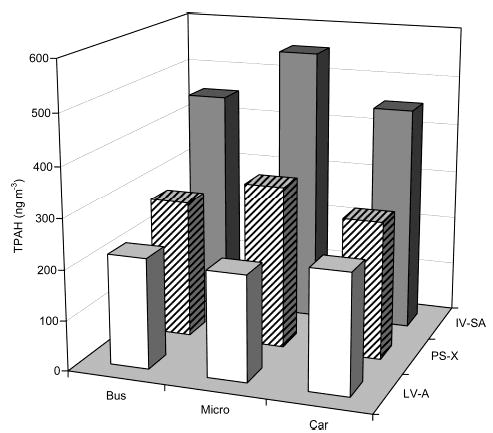
Median TPAH concentrations measured on three routes and four different modes of transportation during the commuter study. The routes travel between Indios Verdes and San Angel (IV–SA), between Pino Suarez and Xochimilco (PS–X), and between La Villa and Auditorio (LV–A).
The ratio of TPAH concentration to active surface area concentration varies by measurement location. Figure 5 shows plots of TPAH versus active surface area concentrations for several of the measurement sessions during the diesel exposure and commuter studies, with the least-squares regression slope indicated on each plot. The upper panels show particle measurements for the morning of Oct 22, upwind of the distribution center and inside its loading dock. The upwind data show a strong correlation between TPAH and surface area concentrations (R 2 = 0.88) with a least-squares linear regression slope of 0.46 ng mm−2. Measurements from inside the dock area show lower surface area but higher TPAH concentrations, and the correlation is not as strong. As shown in the middle panels of Figure 5 (different scale), particle characteristics are quite different at the cargo terminal in Vallejo. TPAH concentrations are lower, most active surface concentrations are higher, and the correlation between the two is weaker. Along the roadways, shown in the lower panels of the figure, we observe much higher TPAH and active surface concentrations, and the slopes of the regression line are 1.09 ng mm−2 (R 2 = 0.89) and 2.15 ng mm−2 (R 2 = 0.63), for the Cuautitlán Izcalli–Jardines and Pino Suarez–Xochimilco routes, respectively. These slopes are higher than found at the distribution center.
FIGURE 5.
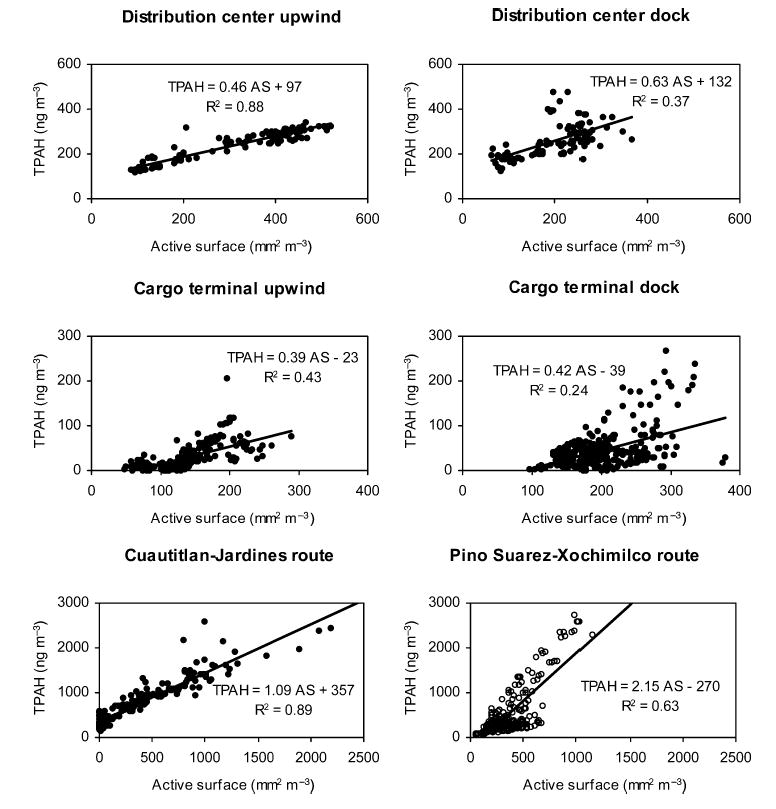
TPAH vs active surface (AS) area concentrations upwind and in the loading dock area of two diesel truck terminals and along two roadway routes. Solid and open circles represent data collected in October and June 2002, respectively. The Cuautitlán Izcalli–Jardines route was monitored on October 22, 2002, from inside a diesel truck cab, and the Pino Suarez–Xochimilco route was monitored during the morning commute on June 20 and 21, 2002, from inside an automobile.
Table 2 compares elemental and organic carbon concentrations to TPAH concentrations at the various diesel truck terminal sampling sites, on the basis of the data shown in Figure 3. The highest EC, OC, and TPAH concentrations are found in the delivery trucks that traveled on Mexico City roadways and at the bus station exit. For all measurements shown in Table 2, TPAH concentrations measured by the PAS are correlated with EC (R 2 = 0.89) but only weakly correlated with OC (R 2 = 0.21) concentrations. The two data points from the delivery trucks and bus station exit dominate the correlation, and at sites with lower EC concentrations, a relationship between EC and TPAH is not evident. Although EC and OC concentrations are lower in the distribution center yard than in the distribution center loading dock area, TPAH concentrations are higher in the yard. Even though EC and OC concentrations in the cargo terminal loading dock area are comparable to those in the distribution center loading dock area, TPAH concentrations are much lower at the cargo terminal. This discrepancy suggests that differences exist in source types or processes affecting particle composition at the two locations.
TABLE 2.
Concentrations (Arithmetic Mean ± Standard Deviation, at Sites with More than One Sample) of PM1.0 (Elemental and Organic Carbon) and TPAH at Each of the Diesel Vehicle Sites
| location | [EC] (μg m−3) | [OC] (μg m−3) | [TPAH] (ng m−3) |
|---|---|---|---|
| distribution center dock | 4 ± 1 | 22 ± 4 | 212 ± 33 |
| distribution center background | 4 ± 1 | 13 ± 2 | 312 ± 66a |
| distribution center delivery truck trips | 16 ± 3 | 35 ± 8 | 596 ± 204 |
| cargo terminal dock | 5 ± 2 | 25 ± 5 | 32 ± 12a |
| cargo terminal background | 3 | 17 | 29 |
| bus terminal exit | 22 | 22 | 834 |
| bus terminal background | 3 | 15 | 22 |
The sampling period of the PAS measurements is significantly shorter than for the filter samples.
Discussion
PAH Concentrations.
The measurements in this study add significantly to the database of PAH concentrations measured in the MCMA. The only previous measurements of particulate PAH concentration in the MCMA reported concentrations of individual PAHs of 0.2–13 μg/g of total suspended particulate matter (TSP) (8), which correspond to 0.05–3 ng m−3, assuming an annual average TSP concentration of 250 μg m−3. These measurements took place on a hillside in northwest Mexico City in 1989. Summed over all 11 PAHs that were analyzed, these concentrations are of the same order of magnitude as the values that we observed at most sites in 2002, as shown in Figure 1. A direct comparison between PAH concentrations in 1989 and 2002 is not possible because of the different methods and measurement locations.
The variation in TPAH and active surface area concentrations and the ratio between the two at different truck terminals and on the roadways may reflect variation in the emissions sources. At the distribution center, it is possible that the observed TPAH concentrations stem from the diesel trucks and LPG forklifts inside the loading dock or from elevated ambient concentrations, as the upwind concentrations are actually higher than those found in the loading dock area. The center is located in the northern industrial area of the city, where extensive diesel truck activity and factories may contribute to elevated background TPAH concentrations. Additionally, the upwind sampling site was located near a road with moderate diesel truck activity. Frequent washing of the loading dock area may have contributed to lower particulate concentrations inside the distribution center than outside. The spraying of water could remove some suspended particles and make resuspension of deposited particles less likely.
The bus station exhibits a range of concentrations, depending on location. The high concentrations at the bus station exit booth are not surprising. The sampler was located less than 1 m from the exit road, where an average of two large diesel buses per minute stopped at the booth and then accelerated toward the main road. Median concentrations in the departure and arrival areas are lower than at the exit booth. However, occasionally we observe very high concentrations, probably when buses are idling at the gates or cigarette smoke is influencing the measurements.
TPAH concentrations at the cargo terminal in Vallejo are much lower than those found at the distribution center in Cuautitlán Izcalli, and indoor concentrations are only slightly higher than upwind ones. At the cargo terminal, dust from the unpaved parking lot appeared to be the largest source of particles. Median active surface concentrations, shown as individual values in Figure 5, are about 4 times higher at this dock than at the other two, resulting in a low ratio of TPAH concentration to active surface area concentration.
As shown in Table 3, roadway PAH concentrations in Mexico are significantly higher than those measured in the United States and among the highest of those measured in other parts of the world. All roadway data presented in Table 3 were measured inside vehicles and used the same type of PAH analyzer. The extremely high concentrations measured in Mexico City do not appear to be simply a result of elevated in-vehicle versus roadway concentrations because we found no relationship between in-vehicle concentrations and window position. Furthermore, other studies have shown no consistent relationship between pollutant concentrations measured inside vehicles versus along roadways or at ambient monitoring sites (20–22). Mean roadway concentrations in the MCMA range from 210 ng m−3 along roads around Iztapalapa to 950 ng m−3 in the more polluted industrial northern part of the city. In the United States, roadway concentrations range from 17 ng m−3 in New York (23) to 150 ng m−3 in California (24). Measurements in Zurich and Paris appear to be high, but some of the measurements were made in a tunnel, where concentrations should be elevated due to less dilution of vehicle exhaust. With mean TPAH concentrations of 926 ng m−3 for an 80 min trip, Tokyo is the only place with concentrations as high as found in Mexico City, and here the researchers noted that the proportion of trucks on the roadways appeared to be higher than in Europe, perhaps due to the practice of “just-in-time” delivery in Japan (16).
TABLE 3.
Arithmetic Means of TPAH Concentrations in This and Other Studies Using Photoemission Aerosol Sensorsa
| date | city | site | [TPAH] (ng m−3) |
|---|---|---|---|
| Roadways (Inside Vehicles) | |||
| Oct 22, 2002 | Mexico City: Cuautitlán Izcalli–Jardinesb | diesel truck | 950 |
| Oct 24, 2002 | Mexico City: Cuautitlán Izcalli–Huauchinangob | diesel truck | 370 |
| Oct 25, 2002 | Mexico City: Cuautitlán Izcalli–Tacubab | diesel truck | 880 |
| Feb 12, 2002 | Mexico City: Merced–Xalostocb | mobile laboratory | 550 |
| Feb 14, 2002 | Mexico City: Xalostoc–Constituyentesb | mobile laboratory | 330 |
| Feb 18, 2002 | Mexico City: Pedregal–Constituyentesb | mobile laboratory | 270 |
| Feb 19, 2002 | Mexico City: Chalco–Teotihuacanb (50 km northeast of Mexico City) | mobile laboratory | 320 |
| Feb 19, 2002 | Mexico City: Teotihuacan–Constituyentesb | mobile laboratory | 480 |
| Feb 20, 2002 | Mexico City: Constituyentes–Iztapalapab | mobile laboratory | 790 |
| Feb 21, 2002 | Mexico City: around Iztapalapab | mobile laboratory | 570 |
| Feb 22, 2002 | Mexico City: around Iztapalapab | mobile laboratory | 390 |
| Feb 23, 2002 | Mexico City: around Izatpalapab | mobile laboratory | 210 |
| New York City (23) | car | 17 | |
| Mexico City (23) | car | 492 | |
| Beijing (23) | car | 208 | |
| Tokyo (16) | car | 926 | |
| Nov 18, 1997 | Zurich (16) | car | 255c |
| Sept 8, 1997 | Paris (23) | car | 659c |
| August to October 2002 | North Carolina (22) | car | 22 |
| North Carolina (24) | car | 128 | |
| California (24) | car | 150 | |
| Indoors | |||
| October 2002 | Mexico Cityb | bus station exit booth | 834 |
| October 2002 | Mexico Cityb | distribution center dock | 189 |
| October 2002 | Mexico Cityb | cargo terminal dock | 45 |
| June to August 2000 | Boston, MA (41) | shopping mall, library, etc. | 8 |
| Outdoors | |||
| October 2002 | Mexico Cityb | bus station upwind | 22 |
| October 2002 | Mexico Cityb | distribution center upwind | 330 |
| October 2002 | Mexico Cityb | cargo terminal upwind | 29 |
| July to August 2000 | Boston, MA (42) | second floor of building | 9 |
| July to August 2000 | Boston, MA (42) | sidewalk | 29 |
| June to August 2000 | Boston, MA (42) | near bus stop | 19 |
Concentrations from the commuter study are shown in Figure 4.
This study.
These routes passed through tunnels, where pollutant concentrations are expected to be higher.
The high particulate PAH concentrations found on Mexican roadways are likely to be due to a combination of old diesel-powered vehicles and the city’s notoriously dirty light-duty vehicle fleet, 50% of which lacked catalytic converters in 1998 (7). It is likely an even larger percentage of vehicles lack functioning catalytic converters, as a remote sensing study of vehicle emissions found that emission control equipment appeared to lose effectiveness within three years in Mexico City (25). Although gasoline-powered vehicles with effective catalytic converters are generally not significant sources of particulate matter, vehicles that burn oil or run fuel-rich can have very high particle emissions. Visibly smoking vehicles, which are plentiful in the MCMA, can have particulate emission rates comparable to those of diesel-powered vehicles (26–29), and PAH emission factors are up to 20 times higher for gasoline-powered vehicles without catalytic converters (30). Tunnel studies have shown that heavy-duty diesel trucks have higher emission factors of the four-ring PAHs but that light-duty gasoline-powered vehicles dominate emissions of the five- and six-ring PAHs (31). The TPAH signal incorporates all these PAHs and is slightly more sensitive to the larger ones due to their greater size and tendency toward lower photoionization energies (32). Therefore, light-duty vehicles probably contribute significantly to high roadway PAH concentrations in the MCMA. A source apportionment study could confirm this hypothesis and quantify the relative contributions from different vehicle types.
Ratios of TPAH Concentration to Active Surface Area Concentration.
The relationship between TPAH and active surface area concentrations may help distinguish between different types of particles. The plots of TPAH versus active surface area concentrations shown in Figure 5 indicate the presence of different types of particles at the various measurement locations. At the distribution center, diesel trucks and industrial activity are the major ambient particulate matter sources. Frequent washing of the warehouse floor may suppress particle concentrations, but the additional source of LPG forklifts may contribute to elevated TPAH and/or active surface area concentrations. We are unaware of any research characterizing the particulate emissions from LPG-powered vehicles. At the cargo terminal in Vallejo, where TPAH concentrations are lower and active surface area concentrations are higher, the mix of particles is probably influenced by resuspended dust from the unpaved parking lot, which has low PAH content, and also influenced by some vehicle activity. These results, together with the results showing comparable EC concentrations at the distribution center and cargo terminal, suggest that freshly generated particles from combustion sources including cars and diesel vehicles may have higher TPAH concentration to surface area concentration ratios as compared to areas where fresh exhaust does not predominate. Ambient temperature and relative humidity could affect gas versus particle phase partitioning of PAHs and their reactivity, but we did not find any meteorological effects on TPAH concentration to surface area concentration ratios over the limited range of conditions we observed.
On the roadway, where TPAH and active surface area concentrations are better correlated, nearly all particles are likely of vehicular origin, while at the distribution center, other sources appear to influence the measurements. During the trip between Cuautitlán Izcalli and Jardines, we observe nonzero TPAH and near-zero surface area concentrations when the truck is parked at the warehouse. TPAH and surface area concentrations behave similarly during the other two delivery truck trips when the trucks are parked at the warehouses. The cause of this observation is unknown; however, different sources, for example, exhaust from the forklifts unloading the trucks, or different size distributions of ambient particles may cause the phenomenon. In the Pino Suarez–Xochimilco and all other commuter route data collected in June and July 2002, two branches with different slopes appear. Previous work using a PAS and diffusion charger together with a scanning mobility particle sizer has shown that the two branches represent particles of different sizes and compositions (19). The upper branch likely represents fresh diesel accumulation mode particles that have not yet been coated by nonphotoemitting material. The lower branch is found at lower dilution air temperatures and represents nucleation mode particles that likely consist of nonphotoemitting species such as water, hydrocarbons, and sulfuric acid. The reason for the appearance of the lower branch in all commuter study data but in none of the roadway diesel exposure data is not clear. Ambient temperature and humidity are similar at both times of year, so meteorological effects do not seem to explain the observation.
PAHs and Carbon Speciation.
Because particulate PAHs and some elemental and organic carbon originate from the same combustion sources, we expect a relationship to exist among them. The relationship among the PAHs, EC, and OC possibly will vary depending on the emission source, with the strongest relationship when there is only a single source. PAHs are precursors in soot formation (33), so concentrations of PAHs and EC, the major component of soot, should be correlated. A study of diesel engines using a PAS found a very good correlation between EC and PAH concentrations (18). The strong correlation between EC and TPAH concentrations (R 2 = 0.89) shown in Table 2 is dominated by the two data points from the delivery trucks and bus station exit. In both cases, fresh diesel exhaust is the dominant source of emissions. The relatively low TPAH versus EC concentrations at the cargo terminal may be due to the lack of sources in the immediate vicinity of the sampler, which is not the case for the other locations. Particles that reached the cargo terminal sampling location, which was located inside a warehouse where vehicles are not permitted, had time to age. Processes that diminish PAHs on the particle surface may have acted, such as evaporation of lighter PAHs, agglomeration with noncombustion particles (reducing the PAH concentration per unit surface area), and heterogeneous reactions. The higher TPAH and lower EC concentrations at the distribution center yard versus dock may be related to the presence of LPG forklifts or later model diesel trucks or the unusual relationship between particle surface area and mass measurements, described in the paragraph below, at the distribution center. The much weaker correlation between OC and PAH concentrations is not surprising given that other noncombustion sources of OC exist, such as secondary organic aerosols.
The extremely high ratio of PM2.5 mass to surface area, ~13 g cm−3 μm, measured at the distribution center suggests that the particles here are very dense or that the assumption of a monodisperse and spherical population is grossly incorrect; data are not available from the upwind sampling site at the distribution center. High photoelectric activity at nearly zero active surface concentrations at this location also indicates unusual aerosol composition in this area. The ratios of mass to surface area of ~1–3 g cm−3 μm at the other locations are reasonable, given measured densities of 1.5–3 g cm−3 for ambient particles (35–37) and mode diameters of 0.5–0.7 μm measured during the mobile laboratory study in Mexico City.
Health Risk.
The extremely high PAH concentrations found on Mexico City’s roadways may present an important health risk. Estimating the potential health risk is instructive, despite the large uncertainties involved in the calculations. We can estimate the approximate magnitude of risk from exposure to PAHs in vehicle exhaust in the MCMA by considering the lung cancer risk estimate for benzo[a]pyrene, measurements of TPAH concentrations on the MCMA roadways, and the speciation profiles of their exhaust. Among all roadway trips monitored in the diesel exposure, commuter, and mobile laboratory studies conducted in the MCMA in 2002, median TPAH concentrations range from 60 to 910 ng m−3, with an average of 310 ng m−3. Laboratory (38, 39) and on-road (31) studies suggest that benzo[a]pyrene accounts for 7% ± 5% (mean ± standard deviation) and 2% ± 3% of particulate PAHs in gasoline and diesel exhaust, respectively.
On the basis of studies of lung cancer in coke oven workers, the World Health Organization suggests a lifetime risk estimate (24 h per day over 70 years) for humans of 9 × 10⁻⁵ per ng m−3 of benzo[a]pyrene as an indicator, and the risk refers to the total PAH mixture (40). Speciation profiles differ between coke ovens and vehicle exhaust; however, benzo-[a]pyrene’s high carcinogenic potency relative to other PAHs supports the use of it as an indicator of risk for other sources (30). Using a typical roadway TPAH concentration of 300 ng m−3 in the MCMA and a particulate PAH speciation for exhaust of 2% benzo[a]pyrene, we estimate roadway benzo-[a]pyrene concentrations to be 6 ng m−3. Such a concentration translates into a lung cancer risk level of approximately 5 × 10⁻⁴ for lifetime exposure to these PAH concentrations, or 2 × 10⁻⁵ if we assume that people are exposed for 2 h per day, 5 days per week, for 40 years while commuting on roadways in the MCMA. Professional drivers whose occupations require them to spend many hours per day on the road, street vendors, and city dwellers who live near roadways will face a higher risk due to their longer durations of exposure. Although many uncertainties exist in this risk assessment, the estimate suggests that exposure to PAHs on the MCMA’s roadways may be high enough to warrant concern. This analysis does not consider the other carcinogenic and cocarcinogenic compounds present in the atmosphere, which may amplify the risk.
Acknowledgments
We thank P. Reaser, R. Ramos, M. Zavala, R. Santibañez, A. L. Alonso Murillo, J. Perez Gonzalez, and L. Chapa for their support; the managers of the diesel vehicle sites in Mexico City for the use of their facilities; C. Kolb for the use of the ARI Mobile laboratory; J. Schauer for conducting the EC and OC analyses; and the anonymous reviewers for their insightful contributions. We acknowledge financial support from the North American Commission for Environmental Cooperation, the Alliance for Global Sustainability, the Mexican Metropolitan Environmental Commission to MIT, the U.S. National Science Foundation, and National Cancer Institute Grant CA90792 to Harvard. H.W. was an intern from ETH-Zurich.
References
- 1.Pope CA, Burnett RT, Thun MJ, Calle EE, Krewski D, Ito K, Thurston GD. J Am Med Assoc. 2002;287:1132–1141. doi: 10.1001/jama.287.9.1132. [DOI] [PMC free article] [PubMed] [Google Scholar]
- 2.Brown DM, Wilson MR, MacNee W, Stone V, Donaldson K. Toxicol Appl Pharmacol. 2001;175:191–199. doi: 10.1006/taap.2001.9240. [DOI] [PubMed] [Google Scholar]
- 3.Donaldson K, Brown D, Clouter A, Duffin R, MacNee W, Renwick L, Tran L, Stone V. J Aerosol Med. 2002;15:213–220. doi: 10.1089/089426802320282338. [DOI] [PubMed] [Google Scholar]
- 4.Chughtai AR, Williams GR, Atteya MMO, Miller NJ, Smith DM. Atmos Environ. 1999;33:2679–2687. [Google Scholar]
- 5.Weingartner E, Burtscher H, Baltensperger U. Atmos Environ. 1997;31:2311–2327. [Google Scholar]
- 6.Burtscher H, Siegmann HC. Combust Sci Technol. 1994;101:327–332. [Google Scholar]
- 7.Molina, L. T.; Molina, M. J.; Bremauntz, A. F.; Slott, R.; Zavala, M. A. In Air Quality in the Mexico Megacity: An Integrated Assessment; Molina, L. T., Molina, M. J., Eds.; Kluwer Academic Publishers: Dordrecht, The Netherlands, 2002; pp 21–59.
- 8.Salazar S, Diaz-Gonzalez G, Botello AV. Bull Environ Contam Toxicol. 1991;46:690–696. doi: 10.1007/BF01689954. [DOI] [PubMed] [Google Scholar]
- 9.Evans, J.; Levy, J.; Hammitt, J.; Santos-Burgoa, C.; Castillejos, M.; Caballero-Ramirez, M.; et al. In Air Quality in the Mexico Megacity: An Integrated Assessment; Molina, L. T., Molina, M. J., Eds.; Kluwer Academic Publishers: Dordrecht, The Netherlands, 2002; pp 105–136.
- 10.Garshick, E.; Smith, T. J.; Laden, F. Diesel Epidemiology Working Group; Health Effects Institute: Boston, MA, 2002.
- 11.Jauregui, E. The urban climate of Mexico City. In Urban Climatology and Its Applications with Special Regard to Tropical Areas; Oke, T. R., Ed.; Proceedings of the Technical Conference, Mexico City, November 26–30, 1984; WMO-652; WMO Secretariat: Geneva, 1986; pp 26–45.
- 12.Jazcilevich AD, Garcia AR, Ruiz-Suarez LG. Atmos Environ. 2003;37:183–193. [Google Scholar]
- 13.Burtscher H, Siegmann HC. Water, Air, Soil Pollut. 1993;68:125–136. [Google Scholar]
- 14.Hart KM, McDow SR, Giger W, Steiner D, Burthscher H. Water, Air, Soil Pollut. 1993;68:75–90. [Google Scholar]
- 15.Wilson NK, Barbour RK, Chuang JC, Mukund R. Polycyclic Aromat Compd. 1994;5:167–174. [Google Scholar]
- 16.Siegmann K, Scherrer L, Siegmann HC. J Mol Struct: THEOCHEM. 1999;458:191–201. [Google Scholar]
- 17.Siegmann K, Siegmann HC. SAE Tech Pap Ser. 2000;(2000011995):1–7. [Google Scholar]
- 18.Matter U, Siegmann HC, Burthscher H. Environ Sci Technol. 1999;33:1946–1952. [Google Scholar]
- 19.Bukowiecki N, Kittleson DB, Watts WF, Burtscher H, Weingartner E, Baltensperger U. Aerosol Sci. 2002;33:1139–1154. [Google Scholar]
- 20.Batterman SA, Peng CY, Braun J. Atmos Environ. 2002;36:6015–6030. [Google Scholar]
- 21.Chan AT, Chung MW. Atmos Environ. 2003;37:3795–3808. [Google Scholar]
- 22.Riediker M, Williams R, Devlin R, Griggs T, Bromberg P. Environ Sci Technol. 2003;37:2084–2093. doi: 10.1021/es026264y. [DOI] [PubMed] [Google Scholar]
- 23.Zhiqiang Q, Siegmann K, Keller A, Matter U, Scherrer L, Siegmann HC. Atmos Environ. 2000;34:443–451. [Google Scholar]
- 24.Buckley, T.; Ott, W. Demonstration of real-time measurements of PAH and CO to estimate in-vehicle exposure and identify sources. In Proceedings from the International Specialty Conference on Measurement of Toxic and Related Air Pollutants, Research Triangle Park, NC, May 7–9, 1996; Air & Waste Management Association: Pittsburgh, 1996; pp 803–810.
- 25.Bishop GA, Stedman DH, De La Garza Castro J, Davalos FJ. Environ Sci Technol. 1997;31:3505–3510. [Google Scholar]
- 26.Cadle SH, Mulawa PA, Ball J, Donase C, Weibel A, Sagebiel JC, Knapp KT, Snow R. Environ Sci Technol. 1997;31:3405–3412. [Google Scholar]
- 27.Hildemann LM, Markowski GR, Cass GR. Environ Sci Technol. 1991;25:744–759. [Google Scholar]
- 28.Lowenthal DH, Zielinska B, Chow JC, Watson JG, Gautam M, Ferguson DH, Neuroth GR, Stevens KD. Atmos Environ. 1994;28:731–743. [Google Scholar]
- 29.Sagebiel JC, Zielinska B, Walsh PA, Chow JC, DCadle SH, Mulawa PA, Knapp KT, Zweidinger RB, Snow R. Environ Sci Technol. 1997;31:75–83. [Google Scholar]
- 30.Bostrom CE, Hanberg A, Jernstrom B, Johansson C, Kyrklund T, Rannug A, Tornqvist M, Victorin K, Westerholm R. Environ Health Perspect. 2002;110:451–489. doi: 10.1289/ehp.110-1241197. [DOI] [PMC free article] [PubMed] [Google Scholar]
- 31.Marr LC, Kirchstetter TW, Harley RA, Miguel AH, Hering SV, Hammond SK. Environ Sci Technol. 1999;33:3091–3099. [Google Scholar]
- 32.Niessner R. J Aerosol Sci. 1986;17:705–714. [Google Scholar]
- 33.Richter H, Howard JB. Prog Energy Combust Sci. 2000;26:565–608. [Google Scholar]
- 34.Fraser MP, Lakshmanan K, Fritz SG, Ubanwa B. J Geophys Res. ICC. 2002;107:8.1–8.6. [Google Scholar]
- 35.Hanel G, Thudium J. Pure Appl Geophys. 1977;115:799–803. [Google Scholar]
- 36.McMurry PH, Wang X, Park K, Ehara K. Aerosol Sci Technol. 2002;36:227–238. [Google Scholar]
- 37.Stein SW, Turpin BJ, Cai XP, Huang CPF, McMurry PH. Atmos Environ. 1994;28:1739–1746. [Google Scholar]
- 38.Rogge WF, Hildemann LM, Mazurek MA, Cass GR. Environ Sci Technol. 1993;27:636–651. doi: 10.1021/es00056a030. [DOI] [PubMed] [Google Scholar]
- 39.Westerholm RN, Alsberg TE, Frommelin AB, Strandell ME, Rannug U, Winquist L, Grigoriadis V, Egeback KE. Environ Sci Technol. 1988;22:925–930. doi: 10.1021/es00173a010. [DOI] [PubMed] [Google Scholar]
- 40.World Health Organization. Air Quality Guidelines for Europe; WHO Regional Publications, European Series, No. 91; World Health Organization: Copenhagen, 2000. [PubMed]
- 41.Levy JI, Dumyahn T, Spengler JD. J Exposure Anal Environ Epidemiol. 2002;12:104–114. doi: 10.1038/sj.jea.7500203. [DOI] [PubMed] [Google Scholar]
- 42.Levy JI, Houseman EA, Spengler JD, Loh P, Ryan L. Environ Health Perspect. 2001;109:341–347. doi: 10.1289/ehp.01109341. [DOI] [PMC free article] [PubMed] [Google Scholar]