

Abstract
Purpose
To develop a reliable, noninvasive, continuous, and easily implemented system for measuring intraocular pressure (IOP) in mice.
Methods
Pneumotonometry was adapted for measurement of mouse IOP. Measurements were compared with those obtained with the servo-null micropipette system (SNMS) and with direct anterior chamber cannulation. Heart rate was monitored by the precordial pulse, EKG, or tail pulse in anesthetized mice. The characteristic ocular hypotensive response to mannitol was assessed as an additional validation of the method.
Results
Measurements of IOP obtained using pneumotonometry agreed closely with values measured by SNMS or by direct cannulation. IOP oscillations were synchronous with the heart rate, with a coherence peak between them of ~2 Hz, equal to the pulse frequency. Hypertonic mannitol reduced IOP from 13.7 ± 0.9 mm Hg by 7.7 ± 0.7 mm Hg after 15 minutes.
Conclusions
Pneumotonometry is a reliable and noninvasive method for the measurement of IOP in mice and may permit comparisons of IOP to hemodynamic factors. This system is simpler and more adaptable for glaucoma research than previously reported methodologies for measuring IOP in mice.
The mouse is a useful laboratory animal model for studying glaucoma and human aqueous humor dynamics, thereby facilitating evaluation of drugs1–3 and genetic manipulations.4,5 Lowering intraocular pressure (IOP) is the only clinical intervention documented to delay the onset and slow the rate of progression of irreversible blindness in glaucoma,6–8 so that accurate and precise measurement of IOP in the small mouse eye is central to studying glaucoma mechanisms in mice. IOP is fundamentally dependent on arterial delivery of solute and water to and venous drainage from the eye.9 When the perfusion pressure (mean arterial pressure minus IOP) falls below a critical level, the rate of aqueous humor formation becomes dependent on ciliary blood flow,10,11 so relating cardiac to aqueous dynamics is also highly pertinent.
Several approaches have been applied to measure the IOP of the small mouse eye. The most conventional method is to estimate IOP manometrically by cannulating the eye with a microneedle 45 to 50 μm in diameter,12,13 but leakage around the relatively large-bore microneedle can occur12 and probably leads to underestimates and variability of the measured values.3 The servo-null micropipette system (SNMS) is an electrophysiologic approach that has been fully validated for measuring mouse IOP,3 but it is also invasive and requires expensive equipment and specialized training for performing the measurements. Applanation tonometry has also been adapted to the mouse,14 but the technique requires a specially designed prism and has been criticized because of the subjective endpoint of measurement.15 Recently, an induction-impact tonometer has been adapted.15 This device is sensitive to changes in IOP at low-normal ranges, but is relatively insensitive to changes in the high range and shows significant variance. As a result, the readout changes very little over the range of 25 to 35 mm Hg,15 limiting its usefulness in the study of glaucomatous mice. Most recently, a handheld tonometer (Tonopen; Mentor, Norwell, MA) has been applied to the mouse for measuring IOP and validated through comparisons with the SNMS and detection of the ocular hypotensive effect of brimonidine.16 However, as pointed out by the investigators, the time resolution is limited, precluding measurement of pulsatility or rapid responses of IOP to drugs. A further consideration is the substantial variance in single measurements of a single eye.16,17 In the current study, we assessed whether an adaptation of pneumotonometry might be useful in measuring IOP in mice.
Materials and Methods
Animals
C57/bl6 mice (n = 40) were housed individually in standard cages, receiving food and water ad libitum during an adaptation period of at least 2 weeks. Similar to other mammals, mice display a diurnal variation in IOP.18,19 All measurements were conducted between 1 PM and 5 PM.
Before any experimental procedure, the animals were anesthetized with intraperitoneal ketamine (100 mg/kg) and xylazine (9 mg/kg), the latter used to prolong the duration of anesthesia and to eliminate vibrissal movements. Proparacaine 0.5% applied topically to the cornea complemented the general anesthesia, and head movements were restrained by securing the head in a mouse stereotaxic frame. At the end of the experiments, the animals were euthanatized by CO2 inhalation or by pentobarbital overdosage. All procedures were performed according to the ARVO Statement for the Use of Animals in Ophthalmic and Vision Research.
Ocular Blood Tonometer Adaptation
We used the commercially available tip of the ocular blood tomography (OBT) pneumotonometer (Blood Flow Analyzer [BFA] probe tip; Paradigm Medical Industries, Inc.). Instead of using the OBT pneumotonometer apparatus, we connected the probe tip to a custom assembly (Fig. 1B), that in turn was connected to an air pump with constant pressure (AC0610; World Precision Instruments, Sarasota, FL) through a three-way connector (Fig. 1A).
Figure 1.

IOP measurements by OBT adaptation. (A) adaptation of the pneumotonometer for measurement of mouse IOP. The precordial pulse, EKG, or tail pulse were recorded simultaneously with equipment that is not shown, to simplify the diagram. (B) The probe assembly, comprising a blunted 16-gauge supporting needle inserted into a custom-built plastic tip mount, surmounted by the commercially available BFA probe tip with a flexible pressure-sensitive diaphragm. The tip of the blunted needle has a range of free movement of ~4 mm in the assembly illustrated in Figure 2B. The needle tip shown in the illustration is at an intermediate position. (C) The BFA probe tip in cross-section, comprising concentric inner and outer cylinders. Gas is delivered to the cornea through the interior of the inner tube, represented by the central filled annulus. The outer plastic cylinder is represented by the outer filled annulus. Air returns from the cornea through the space between the inner and outer cylinders, represented by the outer large, clear annulus.
The BFA probe tip consists of a pneumatic probe with a central cylinder and a terminal diaphragm that touches the cornea (Figs. 1A, 1B). The probe tip assembly consisted of a blunted 16-gauge supporting needle inserted into a custom-built cylindrical plastic mount. Although secure enough to prevent retrograde air escape along the needle, the mounting was fashioned to permit the needle to slide freely, with an excursion constrained to several millimeters (Fig. 1B; between positions A and B). The commercially available probe tip, containing the flexible pressure-sensitive diaphragm, fitted securely over the distal end of the custom mount. The needle was connected to the air pump by a T connector. Air passage from the pressure source thus passed through the needle and then through the custom mount to reach the diaphragm at the end of the BFA probe tip. The airflow displaced the diaphragm of the probe tip outward from the central tube, permitting outflow of air under the membrane and outward through five holes in the wall of the probe tip into the atmosphere (Fig. 1B).
The remaining port of the T connector was connected to a pressure transducer with a frequency response ranging from DC to 1000 Hz (LDI-5; Narco Bio-Systems, Houston, TX). With the probe assembly in place, the absolute pressure detected by the transducer was ~40 to 50 mm Hg. The probe assembly was secured to a three-axis micromanipulator (M-152; Narishige International, USA, Greenvale, NY) and the pressure of the system was calibrated to zero just before the probe contacted the tear film. The position of the probe was aligned with the pupillary axis and advanced with a micromanipulator until it made good contact with the central cornea.
The cardiac waveform was usually assessed from the “precordial pulse” recorded by a piezoelectric transducer (RP 1500; Narco Bio-Systems) secured to the midanterior thoracic wall just above the xiphoid process. This approach has been widely used for detecting mechanical movements of the chest wall reflecting both the heartbeat and respiration.20,21 Alternatively, we monitored the cardiac pulse with the electrocardiogram (EKG) or with a pressure transducer wrapped around the tail (MLT1010; Adinstruments, Grand Junction, CO).
Both IOP and pulse signals were band-pass filtered (1–100 Hz), amplified using a signal conditioner (CyberAmp 380; Axon Instruments, Inc., Foster City, CA) and then digitized at 1000 Hz using an analog-to-digital converter (DigiData 1200; Axon Instruments, Inc.). The resultant digital files were analyzed off line (Clampfit 9; Axon Instruments, Inc., and Spike 2; Cambridge Electronic Design, Cambridge, UK).
Comparison of Imposed Pressures with Pneumotonometric Measurements
The anterior chamber of the anesthetized mouse was cannulated to compare the pneumotonometric estimates of IOP with imposed pressures. For this purpose, a microneedle, 50 μm in diameter, was fabricated with a micropipette puller (PN-30 Puller, Narishige International, USA). The microneedle was connected to a water manometer with silicon rubber tubing (1.5-mm inner diameter; AM Systems, Carlsborg, WA). The applied pressure was measured from the height of the water column. The pressure was varied up to 58 mm Hg, and IOP was measured simultaneously with the adapted pneumotonometer.
Servo-Null Micropipette System
The SNMS is a nonmanometric method used to measure pressure that has been adapted and validated for measuring IOP in the mouse.3,4,22 Briefly, an exploring micropipette with tip diameter of ~5 μm was filled with 3 M KCl solution, to reduce the resistivity of the micropipette filling solution far below that of the extracellular fluid. The resistance of the micropipette, which is largely determined by that of the fluid column at the tip, was monitored continuously. After advancing the micropipette into the anterior chamber, the step change in hydrostatic pressure forced aqueous humor into the micropipette lumen, displacing the low-resistance filling solution from the tip toward the shank. The resultant increase in electrical resistance was used as a signal to activate a servo-controlled valve connected to positive and negative pressure sources, which applied the counterpressure necessary to maintain the original resistance by resetting the aqueous humor-KCl interface at the tip of the micropipette. The SNMS output was adjusted to zero while the micropipette tip was in the tear film. Thus, the counterpressure measured after advancing the tip into the anterior chamber was directly equal to the IOP.
Validation through Mannitol Treatment
A further validation of the method was provided by testing whether the pneumotonometer recorded the characteristic ocular hypotensive response to hypertonic solution.3 The hypertonic challenge was presented by administering 20% mannitol solution (2.5 g/kg, Baxter Laboratories, Deerfield, IL) intraperitoneally. IOP was then recorded every 5 minutes for 15 minutes.
Statistical Analysis
To compare the IOP measurements with the adapted pneumotonometry, the SNMS and manometry of the cannulated eye, IOP was recorded in the same animal according to one of two protocols. In one, IOP was first measured by pneumotonometry and then by the SNMS in the same eye. In the second, IOP was measured simultaneously by pneumotonometry and manometry in the same cannulated eye. In addition, data were analyzed by determining Pearson’s correlation coefficient, relating the two sets of measurements in each protocol (Sigma Stat 4.0; SPSS, Inc., Chicago, IL).
Data obtained before and after administering mannitol were analyzed with Student’s paired t-test. For this analysis, estimates of IOP were determined from 30-second recordings, before and 15 minutes after the hypertonic challenge.
To determine whether the pneumotonometric IOP waveform and cardiac pulse waveform displayed a common carrier frequency, their coherence was calculated on computer (Coher script for Spike 2, ver. 4.0; Cambridge Electronic Design; a detailed description of this test is available online at http://www.ced.co.uk). Coherence was assessed as a function of frequency and ranges from 0, for completely incoherent waveforms, to 1.0, for completely coherent waveforms.
Results
Determination of the Endpoint with Adapted Pneumotonometry
Figure 2A presents pneumotonometric IOP measurements as a function of advance of the probe tip and illustrates that a stable reading is achieved after the probe tip contacts the cornea until that point when the mount reaches the limit of its excursion along the supporting needle. After initial contact with the cornea (Fig. 2A), further advance (first upward arrow) of the probe assembly led to a stable IOP reading of 14 to 15 mm Hg. Subsequent advances (upward arrows) and retractions (downward arrows) of the probe assembly produced no significant change in that reading (Fig. 2A). In this range of probe positions, altering the position of the probe assembly simply moves the needle within the cylindrical mount without displacing the probe tip. Thus, over this range, neither the position of the diaphragm nor the resistance to airflow beneath it was altered, so that the IOP reading was not significantly affected (Fig. 2). Figure 2B shows the measured pneumotonometric IOP as a function of cumulative advance as presented in Figure 2A. We observed that the pressure readings increased beyond the stable range only after the needle was advanced to the limit of free movement (approximately 4 mm) within the mount (Fig. 1B, position B). When the probe assembly was excessively advanced, so that the needle tip reached the maximum range of free movement within the mount, further advance produced distortion of the corneal surface, leadings to depression of the membrane at the probe diaphragm, significantly obstructing air outflow and increasing the pressure reading (Fig. 2A). Advance of the probe assembly beyond this stable range of positions caused an initial large increase in the reading, which partially decayed to a sustained elevated value. Retracting the probe assembly to its functional working range produced a stable IOP reading of approximately 14 mm Hg, and limited advances or retractions about this position did not affect the reading (Fig. 2A). In this regard, the pneumotonometric endpoint was taken to be at this plateau, ~14 mm Hg, based on the relative insensitivity of IOP to movement of the probe assembly and the synchronization of IOP pulsations with the cardiac pulse (described later). The endpoint was similarly identified, even when the range of micromanipulator advance was much smaller than in Figure 2, so that the needle tip was not detectably advanced. The endpoint was consistently defined as the measurement relatively insensitive to small changes in probe position, which also displays prominent pulsations synchronous with the cardiac pulse.
Figure 2.

Pneumotonometric IOP trace during advance of probe assembly. The full time course is presented in (A), and the relationship between the cumulative probe advance and apparent IOP is provided in (B). (A) At time 0, the probe assembly was advanced from the air into the tear fluid. A characteristic slight initial decrease in pressure was noted, probably reflecting capillary action by the tear film. After contact of the probe diaphragm with the cornea, the pressure reading was 0 mm Hg. Then, the probe assembly was advanced by 1 mm (first upward arrow). The pneumotonometric reading showed an abrupt rise and then quickly decayed to 14 to 15 mm Hg. Over the subsequent 7 minutes, the probe assembly was either advanced (upward arrows) or retracted (downward arrows) in 0.34- or 1-mm steps without producing any significant change in IOP reading. Because of the shift of the needle in the mount, the large advances of the full probe assembly were associated with very much smaller displacements of the probe tip membrane. Advancing the probe assembly beyond the supporting needle’s range of free movement (Fig. 1B, position B) produced a sharp increase in the reading with only partial subsequent decay (upward arrow at ~520 seconds ★). Then, after partially retracting the probe assembly by 0.34 mm (downward arrow at ~760 seconds), the IOP reading returned to approximately the same value as that observed over the range of positions examined earlier (at ~100–520 seconds). At this point, advance of the probe assembly by even 0.05 mm again increased the IOP reading (upward arrow at ~840 seconds) and retraction at the subsequent downward arrow (by 0.34 mm at ~900 seconds) restored the reading to ~14 mm Hg, consistent with the needle still being at end of its excursion range. Further retraction of the probe to permit free excursion of the needle but with persistent cornea-diaphragm contact restored a stable pressure plateau. Subsequent advances or retractions of the probe assembly did not affect the IOP reading during the remainder of the trace. (B) Relationship between cumulative advance and measured pressure. A stable endpoint was observed over a wide range of advances of the probe assembly and was limited by the maximum range (~4 mm) of free advance of the supporting needle within the inner cylinder of the probe mount. The pneumotonometric endpoint was taken to be ~14 mm Hg, corresponding to the plateau in (A), based on the relative insensitivity of IOP to movement of the probe assembly and large IOP pulsations synchronous with the cardiac pulse (see Fig. 3).
On contacting the cornea, the IOP displays pulsations synchronous with the cardiac pulse. These pulsations were frequently, but not always, larger and more stable at the position-insensitive endpoint than those observed at higher pressures beyond the endpoint. This relationship between the IOP pulsations and cardiac pulses at different positions during the advance is illustrated in Figure 3, obtained from a separate experiment. IOP pulsations (Fig. 3A, top trace) synchronous with the pulse (Fig. 3A, bottom trace) were clearly detected at the endpoint position. However, at the excessively advanced position with elevated pressure, the IOP pulsations were reduced in magnitude (Fig. 3B). Restoration to the endpoint (recovery) position by partially retracting the probe to the working range (Fig. 3C) increased the IOP pulsations, which were larger than those in the excessively advanced position (Fig. 3B).
Figure 3.
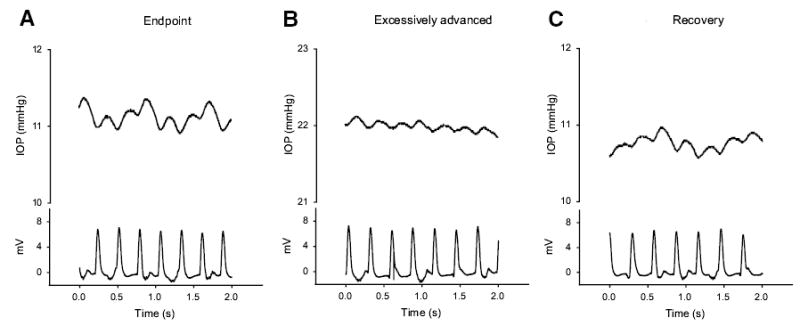
Representative recording showing the synchronization of IOP pulsation with cardiac pulses. The IOP pulses were synchronous with cardiac pulses at the endpoint (A), at an excessively advanced position (B), and at the endpoint again after subsequent probe retraction (C). It was noted that IOP pulsations of 0.2 to 0.3 mm Hg were readily detectable at the endpoint (A). With the same expanded scale, the IOP pulsations were substantially smaller at the excessively advanced position (B). On restoration of the probe assembly to the endpoint position, the IOP pulsations increased once again (C).
Baseline Pneumotonometric Measurements
In normal mice (n = 40), the pneumotonometric estimate of IOP averaged over ≥100 seconds approximately 10 minutes after induction of anesthesia was 13.8 ± 2.4 mm Hg (mean ± SD). Ten minutes was the approximate time needed for ensuring satisfactory anesthesia, proper positioning of the animal in the stereotactic frame, and attachment of the thoracic pressure transducer, EKG or tail pulse monitor. The waveforms of the IOP pulsations and the cardiac waveforms were shown to be synchronous. The cross-correlation function between the waveforms was periodic (564 ms/cycle), oscillating in the range from 0.56 to −0.48 Hz. The peak coherence (0.93) was found at ~2 Hz, which corresponded to the pulse frequency (Fig. 4A). The waveforms obtained by averaging the IOP and precordial pulses over 60 to 100 seconds of recording displayed considerable similarity. The IOP waveform exhibited a faster rise time and a longer plateau phase (Fig. 4B).
Figure 4.
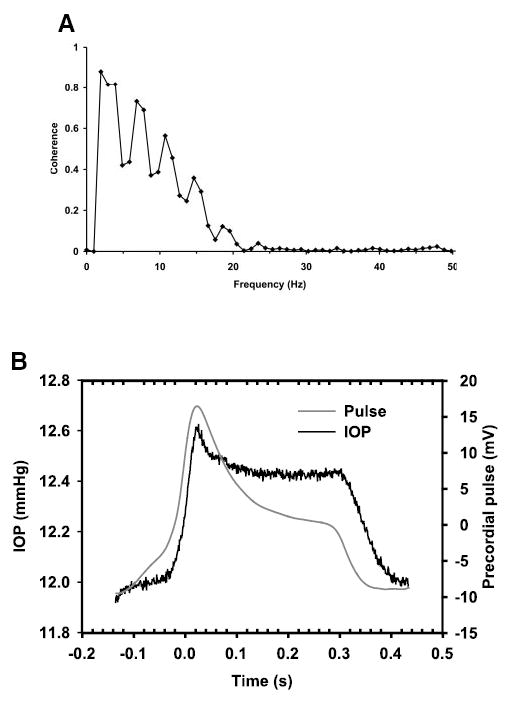
Analysis of coherence between IOP pulse and precordial pulse. (A) A peak of coherence at ~2 to 3 Hz was found and correlated very closely with the pulse, corresponding to the heartbeat of the mouse. (B) Averaged IOP and cardiac pulse measurements. Black line: averaged time course of IOP; gray line: the averaged pulse waveform. The IOP displayed a sustained plateau after the pulse waveform had started to decay. Data were averaged over 100 seconds of measurement.
Reproducibility and Objectivity of the Pneumotonometric Measurements
The reproducibility and objectivity of the pneumotonometer measurements were further assessed by conducting 17 additional experiments in a single eye of each of 13 mice and with both eyes in 2 other animals. Two investigators measured the IOP in succession without knowledge of the other’s estimates. Right and left eyes were studied randomly, and the investigator taking the first measurement was also randomly assigned. The mean estimates (± SEM) of the two observers were indistinguishable (13.5 ± 0.9 vs. 13.6 ± 0.9 mm Hg, P = 0.966). The mean difference between the paired estimates was −0.05 ± 0.08 mm Hg (P > 0.5).
The IOPs for the right and left eyes in five mice were 15.0 ± 1.5 and 15.4 ± 1.9 mm Hg, respectively. The two values were not significantly different (P = 0.72).
Correlation between IOP Estimated by Pneumotonometry and SNMS
After recording IOP with the BFA probe tip, the tip was removed from the corneal surface and the pressure was remeasured with the SNMS (Fig. 5A, n = 8). The two sets of values were not significantly different (12.7 ± 0.9 mm Hg vs. 12.2 ± 1.1 mm Hg, P = 0.48). Moreover, the measurements obtained with the two methods were linearly correlated (r = 0.96; P = 0.0001; Fig. 5A).
Figure 5.

Comparison between pneumotonometric and (A) SNMS or (B) manometric measurements. (A) Correlation between pneumotonometry and SNMS, r = 0.96. (B) Correlation between pneumotonometry and manometry imposed by manometry in the cannulated eye (r = 0.94).
Correlation between Pneumotonometric Measurements of IOP and Imposed Pressure in Cannulated Eyes
Changing the IOP from 0 to 58 mm Hg by means of the saline column induced corresponding changes in IOP simultaneously measured by the pneumotonometer. The relationship was linear (n = 5; readings = 60; r = 0.94; P = 0.002; Fig. 5B).
Response of Pneumotonometrically Monitored IOP to Hypertonic Solution
As illustrated by Figure 6, intraperitoneal hypertonic mannitol solution reduced IOP by 7.7 ± 0.7 mm Hg from a baseline of 13.7 ± 0.9 to 6.0 ± 0.3 mm Hg after 15 minutes (n = 5; P < 0.001). All animals recovered after the procedure. In three animals, IOP was also measured 5 minutes after intraperitoneal delivery of hypertonic mannitol. In these mice, mannitol lowered IOP by 6.5 ± 2.2 mm Hg, suggesting that the effect of mannitol was primarily induced within the first 5 minutes. The reduction triggered by mannitol was two to three times larger than the changes in control mice without hypertonic challenge under the same conditions (Yang H, et al. IOVS 2004;45:ARVO E-Abstract 5041).
Figure 6.
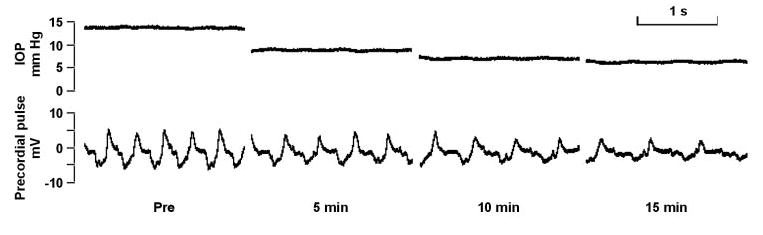
Pneumotonometric measurement of IOP response to mannitol. Representative recordings from a single mouse. Real-time recordings over 1-minute periods before (A), 5 minutes after (B), 10 minutes after (C), and 15 minutes after (D) administering intraperitoneal mannitol. The mannitol reduced IOP from 13.8 to 6.3 mm Hg.
Multiple Readings in a Single Eye
Multiple readings were performed during ~40 seconds with intervening intervals of approximately 20 seconds. Minimal change in the IOP was found between measurements at the beginning (17.2 ± 0.4 mm Hg) and the end (17.5 ± 0.5 mm Hg) of the experiment. Initial IOP spikes corresponded to the contact between the OBT tip and the eye. The signal was filtered, and the cardiac pulse was omitted for clarity (Fig. 7).
Figure 7.

Multiple single eye measurements. Multiple recordings, each for 40 seconds with an interval of 20 seconds in a single eye. There was minimal change between IOP measurements. Initial spikes correspond to the contact of the probe tip with the cornea. Proper repositioning of the probe tip was ensured by restoring the micromanipulator setting to the position noted with the prior reading.
Discussion
The pneumotonometric approach we adapted for measuring mouse IOP is based on the OBT tip.23,24 Gas at constant pressure flows down a central hollow tube, pressing against a terminal diaphragm, and then escapes into the atmosphere. With the advance of the probe assembly to contact the cornea, the probe membrane is pushed backward, partially obstructing outflow through the holes of the probe, and increasing the measured IOP. In essence, the resistance offered to the gas is determined by the IOP and the ocular elastic forces, including ocular arterial and venous pressure. This approach permits determination of the IOP, and the pulsatile component reflects the ocular pulse pressure and compliance of the ocular vessels. We have found an IOP oscillation corresponding to the cardiac pulse of the mouse (Fig. 4).
We have validated the pneumotonometric approach for measuring mouse IOP in four ways. First, the measurements track imposed levels of IOP (Fig. 5B). Second, the pneumotonometrically estimated values correlate very well with values measured by SNMS (Fig. 5A), arguably the most reliable method available for measuring mouse IOP.3 Third, the pneumotonometric measurements display pulsations of IOP that are at the same frequency as and are closely correlated with cardiac contractions (Figs. 3, 4). Finally, the recorded responses to hypertonic solution document that the newly adapted technique detects an experimentally induced change in IOP (Fig. 6).
The adapted pneumotonometer technique displays several advantages over previously tested approaches. The present method is noninvasive in not requiring puncture of the cornea or cannulation of the eye. It is relatively simple to use, and the endpoint is determined objectively. The uncertainty or variance associated with single measurements of IOP compares favorably with that associated with previously tested techniques, as described in the introduction. The pneumotonometer readings are linearly related to imposed pressures over a broad pressure range (Fig. 5). In addition, the pneumotonometer tips are clinically used and commercially available. Although we used a customized apparatus to deliver air and monitor the IOP, we presume that the commercially available OBT apparatus would function equivalently.
We conclude that pneumotonometry provides a sensitive, reliable, relatively simple and noninvasive approach for measuring IOP in the living mouse with high temporal resolution and in real time. Like the previously described SNMS approach, the current technique permits testing of pharmacologic agents over brief periods. In addition, eliminating the need for corneal impalement allows for repeated IOP measurements in the same animals over more extended periods of observation.
Acknowledgments
The authors thank Maureen G. Maguire for helpful discussions concerning the statistical analysis.
Footnotes
Supported in part by Research Grant EY013624 (MMC) and Core Grant EY01583 from the National Institutes of Health (MMC, RAS), a grant from the Paul and the Evanina Bell Mackall Foundation Trust (RAS), and an unrestricted grant from Research to Prevent Blindness (RAS).
Disclosure: M.Y. Avila, None; A. Múnera, None; A. Guzmán, None; C.W. Do, None; Z. Wang, None; R.A. Stone, None; M.M. Civan, None
References
- 1.Avila MY, Stone RA, Civan MM. A(1)-, A(2A)- and A(3)-subtype adenosine receptors modulate intraocular pressure in the mouse. Br J Pharmacol. 2001;134:241–245. doi: 10.1038/sj.bjp.0704267. [DOI] [PMC free article] [PubMed] [Google Scholar]
- 2.Aihara M, Lindsey JD, Weinreb RN. Reduction of intraocular pressure in mouse eyes treated with latanoprost. Invest Ophthalmol Vis Sci. 2002;43:146–150. [PubMed] [Google Scholar]
- 3.Avila MY, Carré DA, Stone RA, Civan MM. Reliable measurement of mouse intraocular pressure by a servo-null micropipette system. Invest Ophthalmol Vis Sci. 2001;42:1841–1846. [PubMed] [Google Scholar]
- 4.Avila MY, Stone RA, Civan MM. Knockout of A3 adenosine receptors reduces mouse intraocular pressure. Invest Ophthalmol Vis Sci. 2002;43:3021–3026. [PubMed] [Google Scholar]
- 5.Aihara M, Lindsey JD, Weinreb RN. Ocular hypertension in mice with a targeted type I collagen mutation. Invest Ophthalmol Vis Sci. 2003;44:1581–1585. doi: 10.1167/iovs.02-0759. [DOI] [PubMed] [Google Scholar]
- 6.The Advanced Glaucoma Intervention Study (AGIS): 7. The relationship between control of intraocular pressure and visual field deterioration. The AGIS Investigators. Am J Ophthalmol. 2000;130:429–440. doi: 10.1016/s0002-9394(00)00538-9. [DOI] [PubMed] [Google Scholar]
- 7.Collaborative Normal-Tension Glaucoma Study Group. The effectiveness of intraocular pressure reduction in the treatment of normal-tension glaucoma. Am J Ophthalmol. 1998;126:498–505. doi: 10.1016/s0002-9394(98)00272-4. [DOI] [PubMed] [Google Scholar]
- 8.The Advanced Glaucoma Intervention Study (AGIS): 4. Comparison of treatment outcomes within race: seven-year results. Ophthalmology. 1998;105:1146–1164. doi: 10.1016/s0161-6420(98)97013-0. [DOI] [PubMed] [Google Scholar]
- 9.Ritch R, Shields MB, Krupin T. The Glaucomas. 2nd ed. St. Louis: Mosby. 1996:Vol. 1.
- 10.Reitsamer HA, Kiel JW. Relationship between ciliary blood flow and aqueous production in rabbits. Invest Ophthalmol Vis Sci. 2003;44:3967–3971. doi: 10.1167/iovs.03-0088. [DOI] [PubMed] [Google Scholar]
- 11.Reitsamer HA, Kiel JW. A rabbit model to study orbital venous pressure, intraocular pressure, and ocular hemodynamics simultaneously. Invest Ophthalmol Vis Sci. 2002;43:3728–3734. [PubMed] [Google Scholar]
- 12.John SW, Smith RS, Savinova OV, et al. Essential iris atrophy, pigment dispersion, and glaucoma in DBA/2J mice. Invest Ophthalmol Vis Sci. 1998;39:951–962. [PubMed] [Google Scholar]
- 13.Aihara M, Lindsey JD, Weinreb RN. Episcleral venous pressure of mouse eye and effect of body position. Curr Eye Res. 2003;27:355–362. doi: 10.1076/ceyr.27.6.355.18194. [DOI] [PubMed] [Google Scholar]
- 14.Cohan BE, Bohr DF. Measurement of intraocular pressure in awake mice. Invest Ophthalmol Vis Sci. 2001;42:2560–2562. [PubMed] [Google Scholar]
- 15.Danias J, Kontiola AI, Filippopoulos T, Mittag T. Method for the noninvasive measurement of intraocular pressure in mice. Invest Ophthalmol Vis Sci. 2003;44:1138–1141. doi: 10.1167/iovs.02-0553. [DOI] [PubMed] [Google Scholar]
- 16.Reitsamer HA, Kiel JW, Harrison JM, Ransom NL, McKinnon SJ. Tonopen measurement of intraocular pressure in mice. Exp Eye Res. 2004;78:799–804. doi: 10.1016/j.exer.2003.11.018. [DOI] [PubMed] [Google Scholar]
- 17.Dalke C, Pleyer U, Graw J. On the use of Tono-Pen XL for the measurement of intraocular pressure in mice. Exp Eye Res. 2005;80:295–296. doi: 10.1016/j.exer.2004.11.008. [DOI] [PubMed] [Google Scholar]
- 18.Savinova OV, Sugiyama F, Martin JE, Tomarev SI, Paigen BJ, Smith RS, John SW. Intraocular pressure in genetically distinct mice: an update and strain survey. BMC Genet. 2001;2:12. doi: 10.1186/1471-2156-2-12. [DOI] [PMC free article] [PubMed] [Google Scholar]
- 19.Aihara M, Lindsey JD, Weinreb RN. Twenty-four-hour pattern of mouse intraocular pressure. Exp Eye Res. 2003;77:681–686. doi: 10.1016/j.exer.2003.08.011. [DOI] [PubMed] [Google Scholar]
- 20.Miyamoto Y, Yonezawa Y, Maki H, Ogawa H, Hahn AW, Caldwell WM. A system for monitoring heart pulse, respiration and posture in bed. Biomed Sci Instrum. 2002;38:135–138. [PubMed] [Google Scholar]
- 21.Ishida R, Yonczawa Y, Maki H, Ogawa H, Hahn AW, Caldwell WM. A sleep apnea syndrome detection system. Biomed Sci Instrum. 2004;40:458–462. [PubMed] [Google Scholar]
- 22.Avila MY, Seidler RW, Stone RA, Civan MM. Inhibitors of NHE-1 Na+/H+ exchange reduce mouse intraocular pressure. Invest Ophthalmol Vis Sci. 2002;43:1897–1902. [PubMed] [Google Scholar]
- 23.Chidlow G, Nash MS, Crowhurst C, Bron AJ, Osborne NN. The ocular blood flow tonograph: a new instrument for the measurement of intraocular pressure in rabbits. Exp Eye Res. 1996;63:463–469. doi: 10.1006/exer.1996.0136. [DOI] [PubMed] [Google Scholar]
- 24.Yang YC, Illango B, Cook A, Batterbury M. Intraocular pressure and pulse rate measurements by the OBF tonograph comparison to reference instruments. Ophthalmic Physiol Opt. 2000;20:401–407. [PubMed] [Google Scholar]