Abstract
A model for the gas-phase proton transfer reactivity of multiply protonated molecules is used to quantitatively account for the maximum charge states of a series of arginine-containing peptide ions measured by Downard and Biemann (Int. J. Mass Spectrom. Ion Processes 1995, 148, 191–202). We find that our calculations account exactly for the maximum charge state for 7 of the 10 peptides and are off by one charge for the remaining 3. These calculations clearly predict the trend in maximum charge states for these peptides and provide further evidence that the maximum charge state of ions formed by electrospray ionization is determined by their gas-phase proton transfer reactivity.
With electrospray ionization, a distribution of charge states can be produced from larger ions that have multiple acidic or basic sites [1–13]. This multiple charging phenomenon has the advantage that it shifts the mass-to-charge ratios of large molecule ions into a lower range, which makes high mass measurements possible on virtually any type of mass spectrometer. The role of various physical phenomena involved in the observed charge distributions has been debated hotly [2–13], Effects of solution chemistry [6–8], molecular conformation [9, 10], and ion-molecule reactions [12, 13] have been studied extensively. Fenn [2] introduced a model, based on the droplet charge density to qualitatively explain some of these phenomena [2]. However, to account for the charge state distributions or maximum charge states quantitatively presents a difficult challenge. A common approach to estimate the maximum charge state of ions in electrospray mass spectra is simply to count the number of basic sites (arginine, lysine, histidine, and the N-terminus) that are protonated in solution [14]. For many molecules, this works quite well. However, this method can either grossly overestimate or underestimate the maximum charge state of many ions. For example, S4 ribosomal protein and actin both have 46 basic residues, yet the maximum charge state that we are aware of that has been reported in the literature for these ions is 30 + [15] and 59 + [16], respectively.
Recently, Downard and Biemann [17] conducted an elegant study in which they measured the maximum charge state and charge state distributions obtained from arginine-containing peptides electrosprayed from methanol-water-acid solutions. The effects of peptide size, interarginine separation, and number of arginine residues were investigated. They found that the fraction of arginine residues that were protonated in the average charge state of these peptides ranged from 40 to 95%. The results were rationalized partially by the Fenn model, but the authors reported that they “found no clear relationship between the number of potential charge-bearing sites and the number of charges that an arginine-rich peptide will support.”
Here, we demonstrate that the experimental results of Downard and Biemann can be explained readily by a model we have proposed to account for the maximum charge states observed in electrospray mass spectra of peptide and proteins [18, 19]. This model is based on previous work on the gas-phase proton transfer reactivity of multiply protonated molecules [19–23]. In this model, protons are assigned to sites in the molecule based on estimates of the intrinsic gas-phase basicity (GBintrinsic) of these sites and the sum of point charge Coulomb interactions between charges. Lowest energy charge configurations are found by using a pseudo-random-walk algorithm, and an apparent gas-phase basicity (GBapp) of each charge state is calculated. We assign the maximum charge state as the first charge state with a GBapp below the GB of the solvent. That is, the next highest charge state should undergo rapid proton transfer to the ubiquitous solvent molecules present in the electrospray interface [GBapp of the n+ charge state reflects the proton transfer reactivity of the (n + 1)+ charge state ion]. This can occur either by gas-phase collisions or by solvent evaporation from an analyte-ion-solvent cluster in which the charge is partitioned between the analyte ion and the departing solvent [18]. The latter stages of this process should reflect the gas-phase chemistry of these species. A recent study of porphyrin ions indicates that the doubly protonated species that exist in solution are converted to singly protonated ions relatively late in the electrospray process [24], consistent with the foregoing analyte-solvent charge-partitioning model.
For ions electrosprayed from a denaturing solution that conatins methanol, we use the GB of methanol (174.1 kcal/mol) for comparison. An effective dielectric polarizability of 1.3 was used in these calculations. This value includes all effects not explicitly treated in our model and was found to most accurately fit the maximum charge states of a series of peptides in our previous report. (In contrast, a value of 2.0 more accurately fits data for proteins.) A value of GBintrinsic for arginine and the backbone carbonyl oxygen of 251.3 and 221.6 kcal/mol were used, respectively, and are based on the basicity of these sites in individual amino acids (236.3 and 206.6 kcal/mol, respectively) [25, 26] and an estimate of charge self-solvation (15 kcal/mol) [19]. A detailed description of these calculations is given in ref 18. A value of 3.8 Å is used for the length of an amino acid residue. To obtain a length for Ā ( = δ-aminovaleric acid), molecular mechanics with the consistent-valence force field (Discover version 2.9.5 in Insight II, Biosym Technologies, San Diego, CA) were performed at 300 K for 1 ns (1-fs step size, intramolecular distances stored every 200 fs) on the doubly protonated molecule RĀR in which the guanidine groups of both arginine residues were protonated. The average distance between the α-carbons of residues 2 and 3 was found to be 7.0 Å; this value is used for the length of Ā in these calculations.
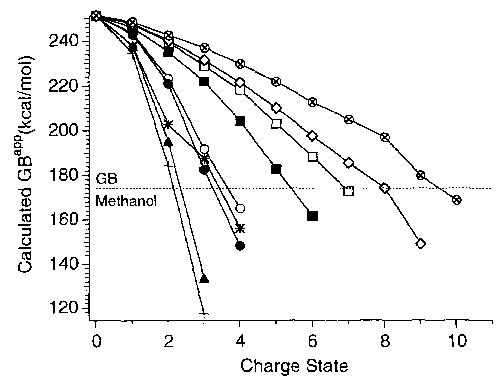
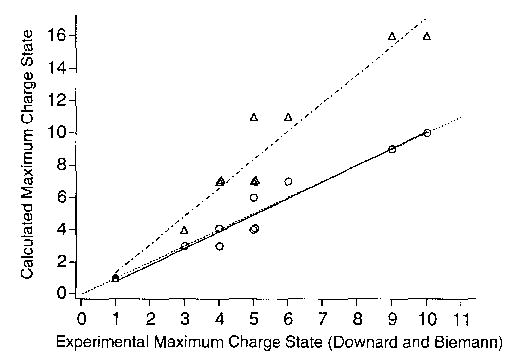
Figure 1 shows our calculated GBapp as a function of charge state for each of the compounds examined by Downard and Biemann. The experimental values measured by Downard and Biemann [17] as well as the maximum charge state predicted by our calculations are given in Table 1. A strong linear correlation between the calculated and measured values is readily apparent in Figure 2 (correlation coefficient = 0.97; slope = 1.03 versus 1.00 for ideal fit). A similar correlation also is observed simply by counting the number of basic sites in the molecule, but this overestimates the maximum charge state by roughly 75% (slope = 1.75). Thus, one simply could divide the number of basic residues by 1.75 and obtain nearly the same accuracy as our calculations. However, the peptides of this series are relatively homogeneous, that is, they contain only three different residues. In contrast, most peptides and proteins of biological relevance are significantly more heterogeneous. For these ions, our calculations are dramatically more accurate because they explicitly take into account both the sequence and Coulomb repulsion. For example, for S4 ribosomal protein and actin, which both contain 46 basic residues, we calculated maximum charge states of 34+ and 56+ , respectively [18], in good agreement with the experimentally measured values of 30 + and 59 + reported in the literature [15, 16].
Figure 1.

Calculated apparent gas-phase basicity as a function of charge state for arginine-containing peptides (RG)3, +; R6, ▴; (RRGG)3, •; R6G6, *; (RG)6, ○; (RG)10, ▪; (RĀ), R, □; (RG)15, ⋄; (RĀ)14R, ⊗. The GBapp of the n+ charge state reflects the proton transfer reactivity of the (n + 1)+ charge state ion. The dashed line indicates that GB of methanol (174.1 kcal/mol). [The GBapp of the 8 + charge state of (RG)15 is 0.5 kcal/mol greater than the GB of methanol.]
Table 1.
Calculated and experimental charge states of 11 peptides formed by electrospray ionization from methanol-water-acid solutionsa
| Measured charge state
|
Calculated maximum charge state
|
||||
|---|---|---|---|---|---|
| Peptidea | Number of basic sites | Average | Maximum | Original model | Flexible terminus modification |
| G6 | 1 | 1.0 | 1 | 1 | 1 |
| R3 | 4 | — | 3 | 2 | 3 |
| (RG)3 | 4 | 2.8 | 3 | 3 | 3 |
| (RG)6 | 7 | 4.6 | 5 | 4 | 4 |
| (RRGG)3 | 7 | 4.0 | 5 | 4 | 5 |
| R6G6 | 7 | 4.0 | 4 | 4 | 4 |
| Re | 7 | 3.9 | 4 | 3 | 4 |
| (RG)10 | 11 | 4.0 | 5 | 6 | 6 |
| (RĀ)9R | 11 | 4.7 | 6 | 7 | 7 |
| (RG)15 | 16 | 7.9 | 9 | 9 | 9 |
| (RĀ)14R | 16 | 8.3 | 10 | 10 | 10 |
Figure 2.

Experimentally measured maximum charge states (from ref 17) versus charge states calculated from the proton transfer reactivity model (○) and total number of basic sites (▵). The solid and dashed-dotted lines are obtained from a linear best fit for these two respective models. The dashed line indicates an ideal fit. Overlapping points are offset.
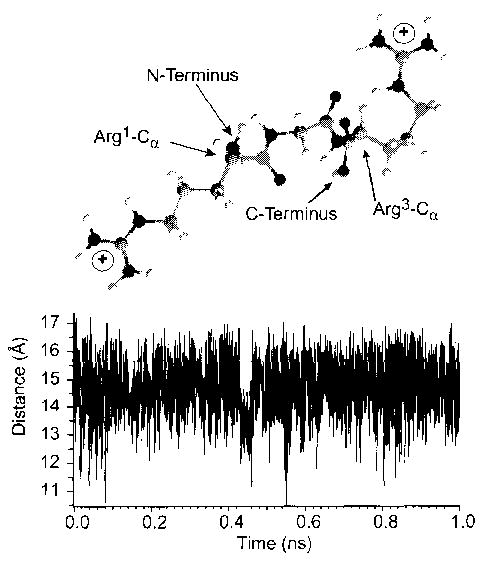
For G6, our calculations predict that a doubly protonated molecule should be stable with respect to proton transfer. However, as we have reported previously for small peptides with few basic sites, the maximum charge state is correlated better with the solution-phase charge state [18]. Thus, based on our previous work, we would expect a maximum charge state of 1 +, the experimentally observed value. For (RG)3, R6G6, (RG)15, and (RĀ)14 R, we calculated the correct maximum charge state. For (RG)6, (RRGG)3, and R6, we calculated a value that is lower by 1. Our simple model significantly underestimates the charge separation distance that is possible in smaller peptides containing basic residues, such as arginine and lysine, with long flexible side chains that are protonated. To obtain a rough estimate of how far a charged terminal arginine residue can extend the length of a peptide, molecular dynamics simulations were performed at 300 K on the model peptide RGR, protonated at the guanidine groups of both arginine residues. The charge-charge separation distance over the 1-ns simulation is shown in Figure 3 (bottom). The average value of the charge separation is 14.6 Å, which is similar to the value of 13.9 Å obtained from the lowest energy 0-K structure (Figure 3, top). By comparison, a value of 7.6 Å would be used for the charge separation distance in our model. The average distance between α-carbons of the two terminal arginine groups is 6.7 Å. A value of 3.9 Å is obtained for the α-carbons of adjacent residues; this is similar to the value of 3.8 Å used here. (This distance and the value of ɛr are linked, i.e., a smaller distance would result in a higher value of ɛr used in these calculations.) Subtraction of the average length of the backbone from the average charge separation value results in a distance of (14.6–6.7)/2 ≈ 4.0 Å that each terminal side chain arginine extends the interchange separation distance in this ion. A similar result was obtained from molecular dynamics simulations of the doubly protonated peptide (RG)2R.
Figure 3.

Lowest energy (0 K) structure obtained by molecular mechanics of the doubly protonated model peptide RGR in which the guanidine groups of both terminal arginine residues are protonated (top). The graph (bottom) plots the charge separation distance obtained from dynamics simulations performed at 300 K for 1 ns, from which an average charge separation distance of 14.6 Å is obtained.
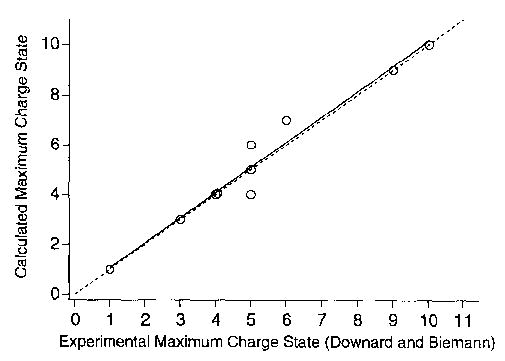
This effect was included in our model by allowing a charge on an arginine at either end of the molecule to extend the length of the peptide by 4.0 Å per terminal arginine. This minor modification reduces the calculated GBapp of all the arginine-containing peptide ions in this study (but does not necessarily change the maximum charge state) and results in an even better fit of our calculated maximum charge state to the measured values (Table 1). These data, plotted in Figure 4, have a correlation coefficient of 0.98 and a slope of 1.01 (1.00 for an ideal fit). As expected, a larger change in GBapp is observed for smaller ions than for larger ones. A larger change also is observed for ions in which charges reside on both a terminal arginine and an adjacent residue [e.g., (R6 + 4H)4+] because this charge separation increases from 3.8 to 7.8 Å with this modification. A similar improvement is observed for R3 for which the maximum charge state reported in the literature is 3 + [27]; the original and “flexible terminus” models predict values of 2 + and 3+, respectively (Table 1). Lowering the GBimrinsic of the terminal arginines to 236.3 kcal/mol (the value of an individual arginine amino acid) does not affect the calculated maximum charge state because deprotonation is not predicted at these sites. Thus, the extent of self-solvation that can occur at these sites does not affect these results.
Figure 4.

Calculated maximum charge state with flexible terminus modification (○). The solid line is obtained from a linear best fit and the dashed line indicates an ideal fit. Overlapping points are offset.
Downard and Biemann [17] concluded that “the role of Coulombic repulsion effects in the charging process may have been overstated.” However, our calculations strongly indicate otherwise. The improved correlation we obtained from this very minor flexible terminus modifiction is due entirely to a reduction in Coulomb repulsion. These results and those of our original calculations strongly indicate that Coulomb repulsion plays a very critical role in the maximum number of charges that an ion can retain in the electrospray ionization process. A strong influence of Coulomb repulsion on the maximum charge state of starburst dendrimers also has been reported by Smith and co-workers [28].
A large number of approximations go into our model of the proton transfer reactivity of multiply protonated ions. Nevertheless, the ability of our calculations to account for the maximum charge states of a variety of biomolecules reported in the literature appears promising. These calculations account for the maximum charge state for 8 of the 11 peptides investigated here, and are off by 1 for the remaining three. Improvements in estimates of GBintrinsic/ which take into account nearest neighbor interactions, flexibility in protonated side chains, and local conformation, should enhance the accuracy of these calculations greatly. This is particularly important for arginine-containing peptides because no value for its intrinsic basicity in peptides has been measured. In addition, evidence for salt-bridge formation in arginine-containing peptides has been observed [29, 30]. Our model does not currently take this type of interaction into account. Ions that have GBapp ~ 3 kcal/mol lower than that of the solvent should be observable in small abundance under “soft” or near-thermal interface conditions, so that our model as described may slightly underestimate the maximum charge state.
To account for charge state distributions quantitatively is a more difficult challenge. It is possible that these distributions are largely the result of gas-phase chemistry. A plot of the experimentally observed maximum charge state and the average measured charge state is linear (correlation coefficient = 0.99, slope = 0.81) and suggests that these values are in fact related. In the electrospray interface, energetic collisions with neutral molecules can occur. These collisions can provide sufficient energy to drive reactions over a barrier so that proton transfer reactions from analyte ions to solvent molecules, which are not kinetically favorable under thermal conditions, can occur. This would result in the production of lower charge state ions. In addition, collisions with (or evaporation of) solvent clusters, which have higher GB than individual solvent molecules, would also result in the production of lower charge state ions. Obviously, charge distributions are significantly more difficult to model in general because solution-phase chemistry and instrumental factors also play a role. With additional experiments done under carefully controlled conditions, such as those of Downard and Biemann, it should be possible to further test the validity of this model and enhance its accuracy. This model also should be extendible readily to other multiply charged ions formed by electrospray ionization, such as cationized species and negative ions.
Acknowledgments
The authors acknowledge financial support for this research provided by the National Science Foundation (CHE-9258178), National Institutes of Health (IR29GM50336-01A2), and Finnigan MAT through sponsorship of the 1994 American Society for Mass Spectrometry Research Award (E.R.W.).
References
- 1.Fenn JB, Mann M, Meng CK, Wong SF, Whitehouse CM. Science. 1989;246:64–71. doi: 10.1126/science.2675315. [DOI] [PubMed] [Google Scholar]
- 2.Fenn JB. J Am Soc Mass Spectrom. 1993;4:524–535. doi: 10.1016/1044-0305(93)85014-O. and references cited therein. [DOI] [PubMed] [Google Scholar]
- 3.Kebarle P, Tang L. Anal Chem. 1993;65:927A–986A. [Google Scholar]
- 4.LeBlanc JCY, Guevremont R, Siu KWM. Int J Mass Spectrom Ion Processes. 1993;125:145–153. [Google Scholar]
- 5.LeBlanc JCY, Siu KWM, Guevremont R. Anal Chem. 1994;66:3289–3296. [Google Scholar]
- 6.Guevremont R, Siu KWM, LeBlanc JCY, Berman SSJ. Am Soc Mass Spectrom. 1992;3:216–224. doi: 10.1016/1044-0305(92)87005-J. [DOI] [PubMed] [Google Scholar]
- 7.Wang G, Cole RB. Org Mass Spectrom. 1994;29:419–427. [Google Scholar]
- 8.Ashton DS, Beddell CR, Cooper DJ, Green BN, Oliver RWA. Org Mass Spectrom. 1993;28:721–728. [Google Scholar]
- 9.Chowdhury SK, Katta V, Chait BT. J Am Chem Soc. 1990;112:9012–9013. [Google Scholar]
- 10.Loo JA, Edmonds CG, Udseth HR, Smith RD. Anal Chem. 1990;62:693–698. doi: 10.1021/ac00206a009. [DOI] [PubMed] [Google Scholar]
- 11.Schmelzeisen-Redeker G, Buffering L, Röllgen FW. Int J Mass Spectrom Ion Processes. 1989;90:139–150. [Google Scholar]
- 12.McLuckey SA, Van Berkel GJ, Glish GL. J Am Chem Soc. 1990;112:5668–5670. [Google Scholar]
- 13.Ogorzalek Loo RR, Smith RD. J Mass Spectrom. 1995;30:339–347. [Google Scholar]
- 14.Covey TR, Bonner RF, Shushan BI, Henion J Rapid Commun Mass Spectrom. 1988;2:249–256. doi: 10.1002/rcm.1290021111. [DOI] [PubMed] [Google Scholar]
- 15.Gulcicek, E. E.; Shen, S.; Boyle, J. D.; Whitehouse, C. M.; Harrison, D. H.; Moore, P. B. Proceedings of the 39th AMS Conference on Mass Spectrometry and Allied Topics; Nashville, TN, 1991; pp 1245–1246.
- 16.Smith RD, Loo JA, Ogorzalek Loo RR, Busman M, Udseth HR. Mass Spectrom Rev. 1991;10:359–452. [Google Scholar]
- 17.Downard KM, Biemann K. Int J Mass Spectrom Ion Processes. 1995;148:191–202. [Google Scholar]
- 18.Schnier PD, Gross DS, Williams ER. J Am Soc Mass Spectrom. 1995;6:1086–1097. doi: 10.1016/1044-0305(95)00532-3. [DOI] [PubMed] [Google Scholar]
- 19.Schnier PD, Gross DS, Williams ER. J Am Chem Soc. 1995;117:6747–6757. [Google Scholar]
- 20.Gross DS, Williams ER. J Am Chem Soc. 1995;117:883–890. [Google Scholar]
- 21.Gross DS, Rodriguez-Cruz SE, Bock S, Williams ER. J Phys Chem. 1995;99:4034–4038. [Google Scholar]
- 22.Gross DS, Williams ER. J Am Chem Soc. 1996;118:202–204. [Google Scholar]
- 23.Gross DS, Schnier PD, Rodriguez-Cruz SE, Fagerquist CK, Williams ER. Proc Natl Acad Sci USA. 1996;93:3143–3148. doi: 10.1073/pnas.93.7.3143. [DOI] [PMC free article] [PubMed] [Google Scholar]
- 24.Chiller XFD, Monnier A, Bill H, Gülaçar FO, Buchs A, McLuckey SA, Van Berkel GJ. Rapid Commun Mass Spectrom. 1996;10:299–304. [Google Scholar]
- 25.Wu Z, Fenselau C. Rapid Commun Mass Spectrom. 1992;6:403–405. doi: 10.1002/rcm.1290080926. [DOI] [PubMed] [Google Scholar]
- 26.Wu Z, Fenselau C. Tetrahedron. 1993;49:9197–9206. [Google Scholar]
- 27.Hiraoka K, Kudaka I. Anal Chem. 1992;64:75–81. [Google Scholar]
- 28.Schwartz BL, Rockwood AL, Smith RD, Tomalia DA, Spindler R. Rapid Commun Mass Spectrom. 1995;9:1552–1555. [Google Scholar]
- 29.Price WD, Schnier PD, Williams ER. Anal Chem. 1996;68:859–866. doi: 10.1021/ac951038a. [DOI] [PubMed] [Google Scholar]
- 30.Schnier, P. D.; Price, W. D.; Jockusch, R. A.; Williams, E. R. J. Am. Chem. Soc. 1996, in press. [DOI] [PMC free article] [PubMed]


