

Abstract
Trans-10,cis-12 conjugated linoleic acid (CLA) has previously been shown to be the CLA isomer responsible for CLA-induced reductions in body fat in animal models, and we have shown that this isomer, but not the cis-9,trans-11 CLA isomer, specifically decreased triglyceride (TG) accumulation in primary human adiopcytes in vitro. Here we investigated the mechanism behind the isomer-specific, CLA-mediated reduction in TG accumulation in differentiating human preadipocytes. Trans-10,cis-12 CLA decreased insulin-stimulated glucose uptake and oxidation, and reduced insulin-dependent glucose transporter 4 gene expression. Furthermore, trans-10,cis-12 CLA reduced oleic acid uptake and oxidation when compared with all other treatments. In parallel to CLA’s effects on metabolism, trans-10,cis-12 CLA decreased, whereas cis-9,trans-11 CLA increased, the expression of peroxisome proliferator-activated receptor γ (PPARγ) and several of its downstream target genes when compared with vehicle controls. Transient transfections demonstrated that both CLA isomers antagonized ligand-dependent activation of PPARγ. Collectively, trans-10,cis-12, but not cis-9, trans-11, CLA decreased glucose and lipid uptake and oxidation and preadipocyte differentiation by altering preadipocyte gene transcription in a manner that appeared to be due, in part, to decreased PPARγ expression.
Supplementary key words: conjugated linoleic acid, fatty acids, lipid metabolism, glucose metabolism, triglycerides, peroxisome proliferator-activated receptor gamma
Abbreviations: ACBP, acyl-CoA binding protein; ACC, acetyl-CoA carboxylase; aP2/FABP, adipocyte fatty acid binding protein; BCA, bicinchoninic acid; BMI, body mass index; BSA, bovine serum albumin; CD-36, fatty acid translocase; C/EBPα, CAAT/enhancer binding protein α; CLA, conjugated linoleic acid; GC, gas chromatography; GLUT4, insulin-dependent glucose transporter 4; GPDH, glycerol-3-phosphate dehydrogenase; HSL, hormone-sensitive lipase; IBMX, isobutylmethylxanthine; LA, linoleic acid; LPL, lipoprotein lipase; MUFA, monounsaturated fatty acid; ORO, oil red O; PPAR, peroxisome proliferator-activated receptor; PPRE, peroxisome proliferator response element; SCD-1, stearoyl-CoA desaturase-1; SFA, saturated fatty acid; SV, stromal vascular; TG, triglyceride
Conjugated linoleic acid (CLA) refers to a group of geometric and positional dienoic isomers of linoleic acid (LA) [18:2(n-6)]. The two predominant isomers of CLA found in food and commercial preparations are cis-9,trans-11 CLA and trans-10,cis-12 CLA. CLA is found in ruminant meats, pasteurized cheeses, and dairy products, and therefore is a natural part of the diet. CLA has been extensively studied due to its potentially beneficial effects on carcinogenesis (1–3), diabetes (4, 5), atherosclerosis (6, 7), immune function (8–10), and body composition (11–16). Collectively, animal studies demonstrate that dietary intake of a crude mixture of CLA isomers prevents the development of obesity (11–16). Furthermore, the trans-10,cis-12 isomer of CLA is the isoform responsible for decreasing fat mass in animals and triglyceride (TG) content in murine and human adipocytes in vitro (17, 18). However, proposed mechanisms by which CLA exerts its antiobesity effects are diverse and often conflicting. For example, Satory and Smith (19) found paradoxically that postconfluent cultures of differentiating 3T3-L1 preadipocytes treated with a crude mixture of CLA isomers had greater rates of lipogenesis and increased levels of TG compared with vehicle controls, yet CLA inhibited proliferation in preconfluent cultures. This CLA-mediated inhibition of proliferation was confirmed by Brodie et al. (20), yet they found that a crude mixture of CLA isomers decreased TG content and/or markers of adipocyte differentiation in 3T3-L1 preadipocytes. These results suggest that CLA attenuates adipocyte differentiation, but other reports refute this claim, demonstrating that the expression of the key adipogenic transcription factors, peroxisome proliferator-activated receptor γ (PPARγ) and CAAT/enhancer binding protein α (C/EBPα), is unaffected by CLA in differentiating murine preadipocytes (21).
In addition to CLA’s potential role in influencing preadipocyte proliferation and differentiation, CLA has been shown to alter lipid metabolism, which may help explain its TG-lowering actions. For example, the trans-10,cis-12 isomer of CLA has been shown to inhibit fatty acid desaturation by decreasing the activity or mRNA levels of Δ9-, Δ6-, and Δ5-desaturases in murine preadipocytes or hepatic microsomes, human breast cancer cells, and human hepatocytes (21–25). This trans-10,cis-12 CLA-mediated reduction in fatty acid desaturation results in a decreased monounsaturated fatty acid (MUFA) to saturated fatty acid (SFA) ratio (21, 23). It has been postulated that without adequate levels of the MUFA oleate, a preferential substrate for TG synthesis (26), TG levels are diminished. Another potential mechanism by which CLA mediates its antiobesity effects is by increasing energy expenditure and fatty acid oxidation (27–35). Collectively, animal studies clearly demonstrate that mixed isomers of CLA can attenuate obesity, yet isomer-specific mechanisms by which CLA exerts these effects are conflicting and unresolved. In addition, the influence of specific CLA isomers on body fat and adipogenesis in humans is unclear (36–44).
PPARs are ligand-activated nuclear hormone receptors that heterodimerize with the retinoid X receptor and act to control the expression of genes involved in cellular metabolism and differentiation (45, 46). Fatty acids or their metabolites serve as ligand activators for all PPAR isoforms (α, γ, and δ/β), yet ligand activation leads to distinct control of downstream target gene expression (45–47). For example, activation of PPARα in the liver increases expression of key regulatory proteins in the catabolic β- and ω-oxidation pathways (48–50). By contrast, PPARγ is the master adipogenic transcription factor and induces anabolic processes such as TG synthesis, glucose uptake, and fatty acid uptake by directly or indirectly enhancing the transcription of genes encoding proteins such as adipocyte fatty acid binding protein (aP2) (51), insulin-dependent glucose transporter 4 (GLUT4) (52), lipoprotein lipase (LPL) (53), and the fatty acid translocase (CD-36/FAT) (54). The trans-10,cis-12 and the cis-9,trans-11 isomers of CLA have been shown to act as potent ligands of PPARα and -δ, whereas activation of PPARγ is minor (4, 27, 28, 53, 55, 56). It has been suggested that increased β-oxidation (29–31) and energy expenditure (27, 32–34) due to activation of PPARα may contribute to the antiadipogenic effect of CLA. However, since both isomers are ligands of PPARα, activation of this transcription factor does not explain the observed isomer-specific effects of the trans-10,cis-12 isomer. Furthermore, a recent report by Peters et al. (35) using PPARα-null mice clearly demonstrated that the influence of CLA on body composition is independent of PPARα activation. Since trans-10,cis-12 CLA is only a weak activator of PPARγ and has been shown to interfere with lipid accumulation in adipocytes in vivo and in vitro, we hypothesized that this CLA isomer might be a partial agonist of PPARγ, or alternatively may interfere with endogenous agonist production.
In this study, we further characterize the isomer-specific effects of CLA on glucose and lipid metabolism in primary human preadipocytes and show the trans-10,cis-12, but not the cis-9,trans-11, isomer of CLA attenuates glucose and fatty acid uptake and oxidation as well as fatty acid incorporation into TG. These processes are known to be increased during adipocyte differentiation (57). In parallel, the expression of PPARγ and a number of PPARγ target genes are down-regulated by the trans-10,cis-12, but not the cis-9,trans-11, isomer of CLA. Thus, the long-term effects of trans-10,cis-12 CLA on glucose and lipid metabolism are likely to be mediated by a PPARγ-dependent attenuation of adipocyte-specific gene expression.
MATERIALS AND METHODS
Materials
All cell culture ware and scintillation cocktail (ScintiSafe) were purchased from Fisher Scientific (Norcross, GA). d-glucose-U-[14C] was purchased from ICN Biochemicals, Inc. (Irvine, CA). Deoxy-d-glucose 2-[1,2-3H(N)], [1-14C]oleic acid and Western Lightning Chemiluminescence Substrate were purchased from Perkin Elmer Life Science (Boston, MA). One-step reverse transcription-polymerase chain reaction (RT-PCR) kit used in semi-quantitative mRNA analysis was purchased from Qiagen, Inc. (Valencia, CA). Gene-specific primers for relative RT-PCR and all immunoblotting buffers and precast gels were purchased from Invitrogen (Carlsbad, CA), and ribosomal 18S competimer technology internal standards and DNA-free were purchased from Ambion (Austin, TX). Gene-specific primers for real-time PCR were purchased from DNA Technology A/S (Aarhus, Denmark), and the real-time PCR kit was from Applied Biosystems (Copenhagen, Denmark). Fetal bovine serum (FBS) was purchased from BioWhittaker (Cambrex/Biowhittaker, Walkersville, MD) unless otherwise specified. LA (99% pure) and fatty acid standards for gas chromatography (GC) analysis were purchased from Nu-Check-Prep (Elysian, MN). Isomers of CLA (+98% pure) were purchased from Matreya (Pleasant Gap, PA). Rubber stoppers and an inverted center-well hanging bucket for CO2 assays were purchased from Kontes Glass Comp. (Vineland, NJ). All other reagents and chemicals were purchased from Sigma Chemical (St. Louis, MO) unless otherwise stated.
Cell culture of human primary preadipocytes
Isolation and culture of stromal vascular cells from adipose tissue
Abdominal adipose tissue was obtained from females with a body mass index (BMI) <30.0 during liposuction or elective surgery with consent, or obtained from Zen Bio, Inc. as previously described (18). Approval to use adipose tissue obtained from humans was secured from the Institutional Review Board at the University of North Carolina at Greensboro. Cells were isolated and cultured as previously defined (18).
Induction of cell differentiation
Freshly split stromal vascular (SV) cells were seeded (4 × 10⁴ cells/cm2) in cell culture plates and allowed to attach for 24 h in proliferation medium. Following attachment, cultures were grown for the next 3 days in differentiation medium containing 97% DMEM/Ham’s F-10 (1:1, v/v), 30 ml/l FBS, 15 μM HEPES (pH 7.4), 33 μM biotin, 17 μM pantothenate, 100 nM human recombinant insulin, 1 μM dexamethasone, 100 U/ml penicillin, 100 U/ml streptomycin, 25 mg/l fungizone, 0.25 mM isobutylmethylxanthine (IBMX), and 1 μM of the thiazolidinedione BRL 49653 (Rosiglitazone from GlaxoSmith-Kline). Thereafter, cultures were exposed to adipocyte medium consisting of 97% DMEM/Ham’s F-10 (1:1, v/v), 30 ml/l FBS, 15 μM HEPES (pH 7.4), 33 μM biotin, 17 μM pantothenate, 100 nM human recombinant insulin, 1 μM dexamethasone, 100 U/ml penicillin, 100 U/ml streptomycin, and 25 mg/l fungizone. Adipocyte media was replaced every 2 days. After 10–12 days under these conditions, ~50–80% of the cells had visible lipid droplets.
Fatty acid preparation
Both isomers of CLA and LA were complexed to fatty acid-free (>98%) bovine serum albumin (BSA) at a 4:1 molar ratio using 1 mM BSA stocks, or were dissolved in dimethylsulfoxide (DMSO) for the transfection studies. All cultures were continuously treated with varying concentrations of fatty acids that were added fresh with each media change (every 2 days).
Lipid staining
The presence of intracellular lipid was visualized by staining the cultures with oil red O (ORO) (58). Cell monolayers were washed twice with Hank’s balanced salt solution (HBSS) and fixed for 24 h in 10% formalin, 4% calcium chloride buffer at 4°C. After fixation, cells were washed twice with deionized water and stained with 0.3% ORO in isopropanol for 15 min at room temperature. Following staining, cells were washed using 20% ethanol and deionized water to remove any undissolved stain. Stained adipocytes were visualized under an Olympus IMT-2 inverted-phase contrast microscope, and photomicrographs were taken of representative fields in each well.
[14C]oleic acid incorporation into lipid-soluble and water-soluble cellular fractions
Cultures were seeded at 4 × 10⁴ cells/cm2 in 12-well culture plates and allowed to differentiate for 5 days in the presence of vehicle or fatty acid treatments. On Day 5, cultures were incubated in 1 ml of serum-free DMEM basal medium containing 1,000 mg/l d-(+)-glucose ± fatty acids. Following a 24 h basal period (Day 6), 20 μl of HBSS containing 12.5 nmol of [1-14C]oleic acid (specific activity = 40–60 mCi/mmol) was added to each well, and incubated at 37°C for 2 h (a time course study indicated a linear incorporation into lipid and water soluble cellular fractions over a 4 h period; data not shown). After 2 h, media containing unincorporated isotope was removed, and monolayers were washed 3× with HBSS, and lysed in 0.1% sodium dodecylsulfate (SDS) phosphate-buffered saline (PBS). Total lipid and water-soluble fractions were extracted and purified using the Bligh and Dyer method (59). Using this method at neutral pH, the lipid soluble fraction would predominantly contain [14C]oleic acid esterified into complex lipids. In contrast, the water-soluble fraction would likely contain [14C]oleoyl-CoA (i.e., [14C]oleate thioesters accumulated prior to β-oxidation) and some products occurring after the partial oxidation of [14C]oleate (i.e., [14C]acetyl-CoA, [14C]tricarboxylic acids, and other small metabolic intermediates). The partitioned samples were then subjected to liquid scintillation counting (Beckman LS 6000; Beckman Instruments, Palo Alto, CA) to determine incorporation into the lipid- and water-soluble cellular fractions. Protein concentration of parallel cultures was determined using the bicinchoninic acid (BCA) colorimetric assay (Pierce, Rockford, IL) using BSA as a control. To control for unincorporated residual [14C]oleic acid, a set of cultures was briefly exposed (<30 s) and immediately washed and harvested; the resulting radioactivity was subtracted from all experimental results.
[14C]CO2 production from [14C]oleic acid
Cultures were seeded at 4 × 10⁴ cells/cm2 in 35 mm culture plates and allowed to differentiate for 5 days in the presence of vehicle or fatty acid treatments. On Day 5, cultures were incubated in 1 ml of serum-free DMEM basal medium containing 1,000 mg/l d-(+)-glucose in the presence of vehicle or fatty acid treatment. On Day 6, 20 μl of HBSS containing 12.5 nmol of [1-14C]oleic acid (specific activity = 40–60 mCi/mmol) was added to each plate, and the plate was quickly placed in an airtight CO2 collection chamber (60 ml Nalgene jar with a fitted rubber stopper, and hanging center-well collection bucket containing What-man filter paper soaked with 50 μl benzothonium hydroxide). The CO2 collection chamber was incubated at 37°C for 90 min. (A time course study indicated a linear production of [14C]CO2 from [14C]oleic acid over a 4 h period; data not shown). Following the 90 min incubation with isotope, the reaction was terminated by the addition of 100 μl 0.5 M H2SO4 to the cell monolayer using syringe injection. Liberation of CO2 was allowed to proceed for an additional 30 min, and then the center-well collection bucket was cut out of the collection chamber and delivered to a liquid scintillation vial. Five milliliters of scintillation cocktail was immediately added to each vial, and all samples were vortexed and incubated overnight before counting. Production of [14C]CO2 from [14C]oleic acid was determined by liquid scintillation counting using a Beckman LS 6000. The addition of 1 μM WY-14643 or 20 μM Gemfibrozil (potent PPARα agonists) increased [14C]oleic acid metabolism into [14C]CO2 by ~100% (data not shown). Protein concentration of parallel cultures was determined using the BCA assay.
[14C]oleic acid uptake
Cultures were seeded at 4 × 10⁴ cells/cm2 in 12-well culture plates and allowed to differentiate for 5 days in the presence of fatty acid treatments. On Day 5, cultures were incubated in 1 ml of serum-free DMEM basal medium containing 1,000 mg/l d-(+)-glucose in the presence of vehicle or fatty acid treatments. On Day 6, culture media was removed and replaced with 1 ml of HBSS buffer containing 100 nM human insulin. Afterwards, 20 μl of HBSS containing 6.2 nmol [1-14C]oleic acid (specific activity = 40–60 mCi/mmol) was added to each well and incubated at 37°C for 20 min (a time course study indicated a linear increase in radiolabeled oleic acid uptake over a 1 h period; data not shown). Uptake was terminated by the addition of an ice-cold stop buffer (HBSS supplemented with 2% BSA). Monolayers were carefully washed an additional 2× with stop buffer to remove background radioactivity, and lysed in 0.1% SDS-PBS. The total cellular lysate was subjected to liquid scintillation counting to determine cellular uptake. Protein concentration of parallel cultures was determined using the BCA colorimetric assay. To control for unincorporated residual [14C]oleic acid, a set of cultures was briefly exposed to [14C]oleic acid (<30 s), and immediately washed and harvested; the resulting radioactivity was subtracted from all experimental results.
[14C]CO2 production from [14C]glucose
Cultures were seeded at 4 × 10⁴ cells/cm2 in 35 mm culture plates and allowed to differentiate for 5 days in the presence of vehicle or fatty acid treatments. On Day 5, cultures were incubated in 1 ml of serum-free DMEM basal medium containing 1,000 mg/l d-(+)-glucose and 20 pM human insulin in the presence of BSA or fatty acids. On Day 6, culture media was removed and replaced with 1 ml of HBSS buffer containing 100 nM human insulin for 10 min. After insulin preincubation, 20 μl of HBSS containing 2.2 nmol d-[U-14C]glucose (specific activity = 231 mCi/mmol) was added to each plate, and the plate was quickly placed in an airtight CO2 collection chamber (as described for oleic acid oxidation). The CO2 collection chamber was incubated at 37°C for 5 h (a time course study indicated a linear increase in radiolabeled CO2 production from [14C]glucose over an 8 h period; data not shown). Following the 5 h incubation, the reaction was terminated by the addition of 100 μl 0.5 M H2SO4 to the cell monolayer by syringe injection. Liberation of CO2 was allowed to proceed for an additional 30 min, and then the center-well collection bucket was cut out of the collection chamber and delivered to a liquid scintillation vial. Five milliliters of scintillation cocktail was immediately added to each vial, and all samples were incubated overnight before counting. Production of [14C]CO2 from [14C]glucose was determined by liquid scintillation counting as previously described. Protein concentration of parallel cultures was determined by the BCA assay.
[3H]2-deoxy-glucose uptake
Cultures were seeded at 4 × 10⁴ cells/cm2 in 35 mm culture plates and allowed to differentiate for 10 days in the presence of vehicle or fatty acid treatments. On Day 10, cultures were incubated in 1 ml of serum-free DMEM basal medium containing 1,000 mg/l d-(+)-glucose and 20 pM human insulin in the presence of vehicle or fatty acid treatments. On Day 12, culture media was removed and replaced with 1 ml of HBSS buffer containing 100 nM human insulin for 10 min. After insulin preincubation, 20 μl of HBSS containing 4 nmol 2-[1,2-3H(N)]deoxy-d-glucose (specific activity = 25–50 Ci/mmol) was added to each plate and incubated at 37°C for 90 min (a time course study indicated a linear increase in [3H]deoxy-d-glucose uptake over 4 h; data not shown). Uptake was terminated by the addition of an ice-cold stop Krebs-Ringer buffer supplemented with 25 mM d-(+)-glucose. Monolayers were carefully washed an additional 2× with stop buffer to remove background radioactivity, and lysed in a 0.1% SDS-PBS. The total cellular lysate was subjected to liquid scintillation counting to determine cellular uptake. Protein concentration of parallel cultures was determined by the BCA assay. To control for unincorporated residual 2-[1, 2-3H(N)]deoxy-d-glucose, a set of cultures was briefly exposed to the isotope (<30 s), and immediately washed and harvested. The resulting radioactivity was subtracted from all experimental results. Insulin induced a 3-fold stimulation of glucose uptake when compared with noninsulin-stimulated controls (data not shown), and treatment with 5 μM cytochalasin B inhibited insulin-stimulated glucose uptake by 90% (data not shown).
Fatty acid extraction and GC analysis
Cultures were seeded at 4 × 10⁴ cells/cm2 in 35 mm culture plates and allowed to differentiate for 12 days in the continuous presence of either BSA or 30 μM trans-10,cis-12 CLA. On Day 12, total cellular lipids were extracted in chloroform-methanol (2:1, v/v) as previously described (60). Neutral and polar lipids were separated using Sep-Pak solid-phase silica cartridges (Waters Corp., Milford, MA). The resulting lipid extracts were dried under nitrogen and converted to fatty acid methyl esters using 4% HCl-methanol at 60°C for 20 min and analyzed as previously described (13). Briefly, fatty acid methyl esters were extracted into hexane and analyzed on a Hewlett-Packard 5890 series II gas chromatograph (Wilmington, DE) fitted with a flame-ionization detector and 3396A integrator. A Supelcowax-10 fused-silica capillary column (60 m × 0.32 mm id, 0.25 μM film thickness) was used, and oven temperature was programmed from 50°C to 200°C, increased 20°C per min, held for 50 min, increased 10°C per min to 220°C, and held for 50 min. Fatty acid methyl esters were identified by comparison with standards.
RNA analysis
Total RNA extraction
Total RNA was isolated using Tri Reagent (Molecular Research Center, Inc., Cincinnati, OH) following the manufacturer’s protocol. RNA was extracted with phenol/1-bromo-3-chloropropane, precipitated with ethanol, dried, and resuspended in H2O. Contaminating genomic DNA was removed by treatment with DNase (DNA-free, Ambion).
Relative RT-PCR
Five hundred nanograms from each RNA sample were used for relative (semi-quantitative) RT-PCR using the One-Step RT-PCR kit (Qiagen). Multiplex reactions, containing gene-specific primer pairs and ribosomal 18S competimer technology internal control primer pairs (Ambion), were conducted using a GeneAmp PCR system 9700 (PE Applied Biosystems, Foster City, CA). The gene-specific primer pairs used are shown in Table 1. Relative levels of mRNA were determined during the exponential phase of amplification, and primer-competimer ratios were optimized at the specified cycle numbers. For all samples, first-strand cDNA was synthesized at 50°C for 30 min, and HotStarTaq DNA polymerase was activated following a 15 min incubation at 95°C. PCR running conditions were LPL = 23 cycles at 94°C for 30 s, 55°C for 1 min, and 72°C for 30 s; CD-36 = 29 cycles at 94°C for 30 s, 57°C for 30 s, and 72°C for 30 s; GLUT4 = 30 cycles at 94°C for 30 s, 57°C for 30 s, and 72°C for 30 s; aP2 = 22 cycles at 94°C for 1 min, 55°C for 1 min, and 72°C for 1 min; and stearoyl-CoA desaturase-1 (SCD-1) = 20 cycles at 94°C for 30 s, 57°C for 45 s, and 72°C for 30 s. All reactions were followed by a 7 min final extension at 72°C. The PCR products were visualized on a 1.5% agarose gel containing ethidium bromide using an Eastman Kodak Digital Science Imaging Station (Rochester, NY).
TABLE 1.
Primer sequences used for relative RT-PCR
| Target Gene | Primer Sequence | Accession Number | |
|---|---|---|---|
| aP2 | sense | 5′-GAA ACT TGT CTC CAG TGA AAA C-3′ | NM_001442 |
| antisense | 5′-GGG AGA AAA TTA CTT GCT TG-3′ | ||
| LPL | sense | 5′-GAG ATT TCT CTG TAT GCC ACC-3′ | NM_000237 |
| antisense | 5′-CTG CAA ATG AGA CAC TTT CTC-3′ | ||
| CD-36 | sense | 5′-GAG AAC TGT TAT GGG GCT AT-3′ | L06850 |
| antisense | 5′-TTA AAC TCG AGA GGC AAA GG-3′ | ||
| SCD-1 | sense | 5′-GCT TGT GCC CTG GTA TTT CT-3′ | NM_00563 |
| antisense | 5′-GGA GTG GTG GTA GTT GTG GA-3′ | ||
| GLUT4 | sense | 5′-CTG CGC GTC CAG CTC TTC TAA-3′ | NM_001042 |
| antisense | 5′-GAG GAA GGA GGA AAT CAT GCC-3′ |
aP2, adipocyte fatty acid binding protein; CD-36, fatty acid translocase; GLUT4, insulin-dependent glucose transporter 4; LPL, lipoprotein lipase; SCD-1, stearoyl-CoA desaturase-1.
Quantitative real-time PCR
First-strand cDNA was synthesized as previously described (61). RNA expression was quantified by real-time quantitative PCR using the ABI PRISM 7700 Sequence Detection System (Applied Biosystems). Each PCR reaction contained, in a final volume of 25 μl, 1 μl of first-strand cDNA, 12.5 μl 2× SYBR Green PCR Master Mix (Applied Biosystems); and 5 pmol of each primer (Table 2). All reactions were performed using the following cycling conditions: 50°C for 2 min, 95°C for 10 min followed by 40 cycles at 95°C for 15 s, and 60°C for 1 min. PCR was carried out in 96-well plates and in duplicate. Target gene mRNA expression was normalized to TATA binding protein mRNA expression and the relative amounts of all mRNAs were calculated using the comparative CT method.
TABLE 2.
Primer sequences used for quantitative real-time PCR
| Target Gene | Primer Sequence | Accession Number | |
|---|---|---|---|
| ACBP | sense | 5′-CCC TCA GCC TTG TTT GTA CTG TAT G-3′ | NM_020548 |
| antisense | 5′-TTC GTG TTC CTA GGC AAT GCT-3′ | ||
| ACC | sense | 5′-ATA GCA GAA AAA GTA CGG GCT GA-3′ | NM_000664 |
| antisense | 5′-CAC AAC CCC CAA CAT GGT GT-3′ | ||
| aP2 | sense | 5′-ATA TGA AAG AAG TAG GAG TGG GCT TT-3′ | J02874 |
| antisense | 5′-CCA TGC CAG CCA CTT TCC-3′ | ||
| C/EBPα | sense | 5′-CCC TCA GCC TTG TTT GTA CTG TAT G-3′ | U34070 |
| antisense | 5′-TTC GTG TTC CTA GGC AAT GCT-3′ | ||
| GPDH | sense | 5′-CGA GGT GGC TGA TGA GAA GTT-3′ | BC032234 |
| antisense | 5′-GGG TCC TTG CAG CCA ATG-3′ | ||
| HSL | sense | 5′-AAG TGG GCG CAA GTC CC-3′ | NM_005357.2 |
| antisense | 5′-GCG CAT CGG CTC TGC TAT-3′ | ||
| Leptin | sense | 5′-ACA CGC AGT CAG TCT CCT CCA-3′ | NM_000230 |
| antisense | 5′-GAA TGA AGT CCA AAC CGG TGA-3′ | ||
| Perilipin | sense | 5′-TCA CAG CCA CAT TTC CAT TTG-3′ | NM_002606 |
| antisense | 5′-GTG ACT ATG CAG GTG AAG GCA GTA-3′ | ||
| PPARγ1 | sense | 5′-ATT CTG GCC CAC CAA CTT TG-3′ | AY157024 |
| antisense | 5′-TCC ATT ACG GAG AGA TCC ACG-3′ | ||
| PPARγ2 | sense | 5′-AGC AAA CCC CTA TTC CAT GCT-3′ | AY157024 |
| antisense | 5′-ATC AGT GAA GGA ATC GCT TTC TG-3′ | ||
| TBP | sense | 5′-GCC CAT AGT GAT CTT TGC AGT G-3′ | NM_003194 |
| antisense | 5′-AGA AAC CCT TGC GCT GGA A-3′ |
ACBP, acyl-CoA binding protein; ACC, acetyl-CoA carboxylase; aP2, adipocyte fatty acid binding protein; C/EBPα, CAAT/enhancer binding protein α; GPDH, glycerol-3-phosphate dehydrogenase; HSL, hormone-sensitive lipase; PPARγ, peroxisome proliferator-activated receptor γ; TBP, TATA-binding protein.
Immunoblotting
Cultures were seeded at 4 × 10⁴ cells/cm2 in 35 mm culture plates and allowed to differentiate for 8, 12, or 16 days in the presence of vehicle or fatty acid treatments. Total cellular protein was harvested using PBS (pH 7.5) lysis buffer containing 1% NP40, 0.1% SDS, 0.5% SDS, 30 μl/ml aprotinin, 1 mM phenylmethyl-sulfonyl fluoride (PMSF), and 1 mM sodium orthovanadate. The samples were incubated on ice with frequent vortexing, centrifuged for 20 min at 15,000 g, and stored at −80°C. Protein concentration was determined using the BCA assay. Twenty micrograms of total cellular protein was separated by electrophoresis on 4–12% SDS-polyacrylamide gradient gels (NuPAGE mini-gel system; Invitrogen), transferred to a polyvinylidene difluoride membrane using a wet transfer module (Trans-Blot Module; Bio-Rad, Inc., Hercules, CA), and prepared for immunodetection. Using a 1:30,000 dilution of a rabbit anti-adipocyte fatty acid-binding protein polyclonal primary antibody (generous gift from Dr. D. Bernlohr, University of Minnesota) and a 1:1,500 dilution of goat antiperilipin sera (generous gift from Dr. C. Londos, NIH-NIDDK) coupled to their respective horseradish peroxidase-conjugated secondary antibodies, each protein was detected using Western Lightning (PE Life Sciences) chemiluminescence substrate. Chemiluminescence was visualized following exposure of the membrane to X-ray film (X-OMAT; Eastman Kodak Co.). A signal transducer and activator of transcription 6 (sc-981; Santa Cruz Biotech., Santa Cruz, CA) primary antibody was used for an internal loading control because it has been validated as a reliable control that is constitutively expressed over the adipocyte differentiation program (62, 63).
Transient transfections of 3T3-L1 adipocytes
Cell culture and differentiation of 3T3-L1 cells
3T3-L1 cells were cultured in DMEM (Invitrogen) containing 4,500 mg/l glucose supplemented with 100 μg/ml streptomycin, 63 μg/ml penicillin, 8 μg/ml biotin, and 8 μg/ml pantothenic acid. Standard 3T3-L1 proliferation media contained 10% calf serum. Medium was changed every second day. Differentiation of 3T3-L1 cells was obtained by exposing 2 day postconfluent (designated day 0 cells) to DMEM containing 10% FBS (Hyclone, Logan, UT) supplemented with 1 μM dexamethasone, 0.5 mM IBMX, and 1 μg/ml insulin (Roche, Basel, Switzerland). At Day 2, cells were fed DMEM containing 10% FBS and 1 μg/ml insulin; thereafter the cells were maintained in DMEM and 10% FBS.
Transient transfections
3T3-L1 cells were transfected at Day 4 of differentiation using the Lipofectamine Plus Reagent procedure (Invitrogen). Transfections were performed in 12-well plates with a total of 1 μg DNA per well. Plasmids used in transient transfections were the rat acyl-CoA binding protein (ACBP) promoter reporter constructs (pACBP(−392/+979), which contains an intronic peroxisome proliferator response element (PPRE)-luc, and pACBP(−392/+979)ΔPPRE-luc), in which the PPRE has been mutated (64). The plasmid pCMV-β-galactosidase (Clontech, Copenhagen, Denmark) was used for normalization. After 3 h of incubation with the DNA mixture, the medium was changed to DMEM containing 10% resin-charcoal-stripped FBS supplemented with BRL49653 (Novo Nordisk A/S, Copenhagen, Denmark) and/or LA, cis-9,trans-11 CLA, trans-10,cis-12 CLA dissolved in DMSO. Cells were harvested 24 h later in lysis buffer (Tropix, Copenhagen, Denmark), and the lysates were stored at −80°C. All transfections were performed in triplicate. Luciferase and β-galactosidase assays were performed as previously described (65).
Statistical analyses
Data are expressed as the mean ± SEM. Data were analyzed using one-way ANOVA, followed by each pair of Student’s t-tests for multiple comparisons. Differences were considered significant if P < 0.05. All analyses were performed using JMP IN v4.04 (SAS Institute, Cary, NC) software.
RESULTS
Trans-10,cis-12 CLA decreases lipid accumulation
In primary cultures of SV cells isolated from human adipose tissue, lipid droplets rich in TG are detectable within the first 5 days of differentiation. The amount of ORO staining can be quantified spectrophotometrically and parallels the TG content (58). As shown in Fig. 1, differentiating preadipocytes treated continuously for 12 days with 30 μM of trans-10,cis-12 CLA had less stainable TG compared with all other treatments. In contrast, cultures treated with LA and cis-9,trans-11 CLA appeared to have more stainable TG than the other treatments.
Fig. 1.
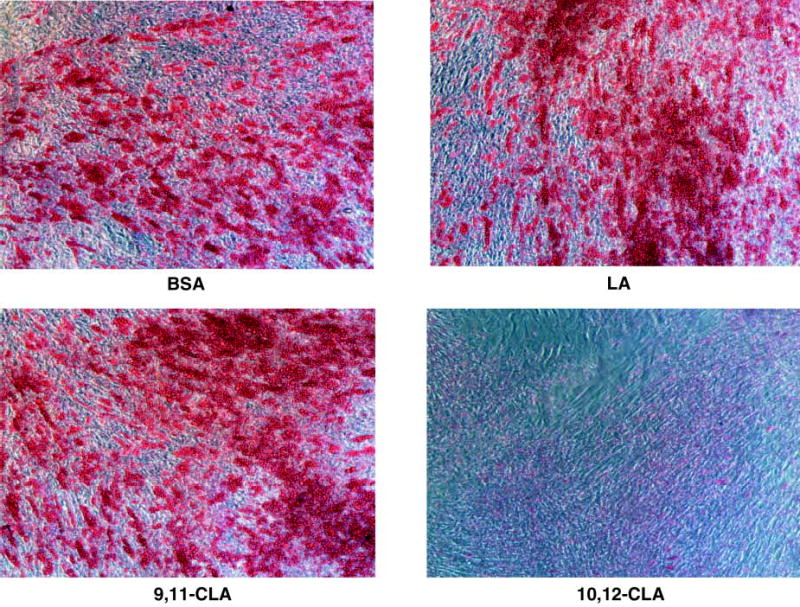
Trans-10,cis-12 conjugated linoleic acid (CLA) decreases lipid accumulation in differentiating human preadipocytes. Cultures were continuously treated with either a bovine serum albumin (BSA) vehicle, or 30 μM linoleic acid (LA), cis-9,trans-11 (9,11-CLA), or trans-10,cis-12 (10,12-CLA) for 12 days during differentiation. On Day 12, cultures were stained with oil red O and phase-contrast photomicrographs were taken using an Olympus inverted microscope with a 10× objective.
Trans-10,cis-12 CLA readily incorporates into cellular lipids and reduces the ratio of MUFA-SFA
The fatty acid profiles of cellular lipids, especially those of phospholipids, alter signal transduction pathways that impact carbohydrate and lipid metabolism. To this end, we examined the extent to which trans-10,cis-12 CLA incorporated into neutral and phospholipids fractions and its impact on the predominant MUFA and SFA within adipocyte cultures following 12 days of continuous treatment during the differentiation program. Trans-10,cis-12 CLA readily incorporated into the neutral and phospholipid fractions of the cultures (Table 3). Cultures treated with trans-10,cis-12 CLA had consistently less 16:1 and 18:1 in their neutral and phospholipid fractions. Cultures treated with trans-10,cis-12 CLA had 35% less 20:4, a precursor for eicosanoid synthesis, in the phospholipid fraction than in the controls. The MUFA/SFA ratio was lower in cultures treated with 30 μM trans-10,cis-12 CLA compared with vehicle controls. In particular, the ratio of 16:1/16:0 was markedly decreased in cultures treated with trans-10,cis 12 CLA compared with controls (i.e., 5.3- and 11.5-fold lower in the phospholipids and neutral lipid fractions, respectively). In keeping with these data, the mRNA level of SCD-1, an enzyme that introduces a double bond at position Δ9 in 16:0 and 18:0, was greatly reduced in cultures treated with 30 μM trans-10,cis-12 CLA when compared with cultures treated with cis-9,trans-11 CLA or vehicle (Fig. 2).
TABLE 3.
Fatty acid composition of phospholipid and neutral lipid cellular fractions of differentiating human (pre)adipocytes
| Phospholipid Fraction
|
Neutral Lipid Fraction
|
||||
|---|---|---|---|---|---|
| Fatty Acid | BSA | CLA | Fatty Acid | BSA | CLA |
| 16:0 | 18.67 ± 1.67 | 13.98 ± 1.67 | 16:0 | 31.35 ± 1.29 | 11.29 ± 1.45a |
| 16:1 | 3.76 ± 0.86 | 0.50 ± 0.86a | 16:1 | 16.53 ± 0.67 | 0.42 ± 0.74a |
| 16:1/16:0 ratio | 0.19 ± 0.02 | 0.04 ± 0.02a | 16:1/16:0 ratio | 0.53 ± 0.01 | 0.04 ± 0.01a |
| 18:0 | 17.59 ± 0.76 | 16.37 ± 0.76 | 18:0 | 4.01 ± 0.59 | 8.20 ± 0.66a |
| 18:1 | 13.63 ± 0.88 | 9.88 ± 0.88a | 18:1 | 10.84 ± 0.68 | 7.46 ± 0.76a |
| 18:1/18:0 ratio | 0.77 ± 0.16 | 0.61 ± 0.16 | 18:1/18:0 ratio | 2.72 ± 0.12 | 0.92 ± 0.13a |
| 18:2 | 0.83 ± 0.59 | 1.64 ± 0.59 | 18:2 | ND | 1.02 ± 0.51 |
| 20:4 | 5.90 ± 0.39 | 3.82 ± 0.39a | 20:4 | ND | 0.53 ± 0.34 |
| MUFA/SFA ratio | 0.47 ± 0.03 | 0.35 ± 0.03a | MUFA/SFA ratio | 0.77 ± 0.02 | 0.41 ± 0.02a |
| t10, c12-CLA | ND | 8.41 ± 1.11a | t10, c12-CLA | ND | 19.05 ± 0.96a |
BSA, bovine serum albumin; CLA, conjugated linoleic acid; MUFA, monounsaturated fatty acid; ND, not detectable; SFA, saturated fatty acid. Cultures were continuously treated with either a BSA vehicle control of 30 μM trans-10,cis-12 CLA (t10, c12-CLA) for 12 days during differentiation. On Day 12, total cellular lipid was extracted and purified into neutral lipid and phospholipid fractions via silica column separation. Fatty acid analysis of the resulting fractions was carried out using gas chromatography. Data are g/100 of total fatty acids expressed as means ± SEM (n = 5 for neutral lipid, n = 3 for phospholipid).
Significantly different than vehicle control (P < 0.05).
Fig. 2.
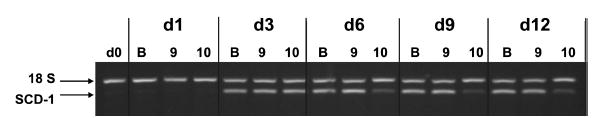
Isomer-specific regulation of stearoyl-CoA desaturase-1 (SCD-1) by CLA. The effects of BSA (B), 30 μM cis-9,trans-11 CLA (9), or 30 μM trans-10,cis-12 CLA (10) on SCD-1 gene expression over the differentiation time course (Days 0, 1, 3, 6, 9, and 12 postinduction) were examined using multi-plex semi-quantitative RT-PCR. 18S rRNA was used as an internal control. Results are representative of two separate experiments from independent human subjects.
Isomer-specific regulation by CLA of glucose uptake and oxidation
To further investigate potential mechanism(s) by which trans-10,cis-12 CLA decreases de novo fatty acid synthesis in human adipocytes (18), we examined isomer-specific effects of CLA on glucose uptake and oxidation and GLUT4 expression. Insulin-stimulated [3H]2-deoxy-glucose uptake was lower in cultures treated with trans-10,cis-12 CLA compared with all other treatments (Fig. 3A). In addition, glucose oxidation as determined by [14C]CO2 production from [14C]glucose was lower in cultures treated with 10 μM and 30 μM trans-10,cis-12 CLA compared with all other treatments (Fig. 3B). The expression of GLUT4 was significantly lower in cultures treated with 30 μM trans-10,cis-12 CLA compared with all other treatments (Fig. 3C). Collectively, these data suggest that trans-10,cis-12 CLA decreases insulin-stimulated glucose uptake and oxidation in differentiating preadipocytes, in part by inhibiting GLUT4 expression. Thus, in this respect trans-10,cis-12 CLA has an opposite effect of that of PPARγ ligands, which increase GLUT4 expression and glucose uptake (66, 67).
Fig. 3.
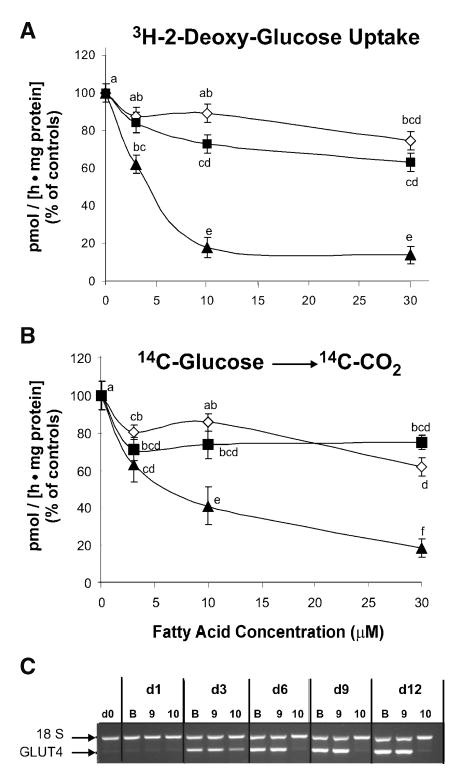
Isomer-specific regulation of human adipocyte glucose metabolism by CLA. Cultures of differentiating human preadipocytes were continuously treated with increasing concentrations (0, 3, 10, or 30 μM) of either LA (diamond), cis-9, trans-11 CLA (square), or trans-10, cis-12 CLA (triangle) for 12 days during differentiation. A: Uptake of 4 nmol [3H]2-deoxy-glucose (specific activity = 25–50 Ci/mmol) was measured following a 90 min incubation in the presence of 100 nm insulin; control rate was 146 pmol/[h · mg protein]. B: [14C]CO2 production from [14C]glucose was measured following a 5 h incubation with 2.2 nmol [14C]glucose (specific activity = 231 mCi/mmol) in the presence of 100 nm insulin; control rate was 15 pmol/[h · mg protein]. For A and B, data are expressed as a percentage of vehicle control (BSA) levels. Means (±SEM; n = 6) not sharing a common superscript differ, P < 0.05. C: In addition, the effects of BSA (B), 30 μM cis-9,trans-11 CLA (9) or 30 μM trans-10,cis-12 CLA (10) on insulin-dependent glucose transporter 4 (GLUT4) gene expression over the differentiation time course (Days 0, 1, 3, 6, 9, and 12 postinduction) was conducted using multiplex semi-quantitative RT-PCR. 18S rRNA was used as an internal control. Results for GLUT4 expression are representative of two separate experiments from independent human subjects.
Isomer-specific regulation by CLA of fatty acid uptake and utilization
To determine the extent to which CLA decreased the TG content of the cultures by altering the metabolism of exogenously added fatty acids, we examined the effects of CLA on radiolabeled-fatty acid uptake and utilization. Although all fatty acid treatments decreased [14C]oleic acid uptake in a dose-dependent fashion, cultures treated with 30 μM trans-10,cis-12 CLA had the lowest rate of fatty acid uptake (~65% of controls) compared with 30 μM cis-9,trans-11 CLA (~80% of controls) or 30 μM LA (~85% of controls) (Fig. 4A).
Fig. 4.
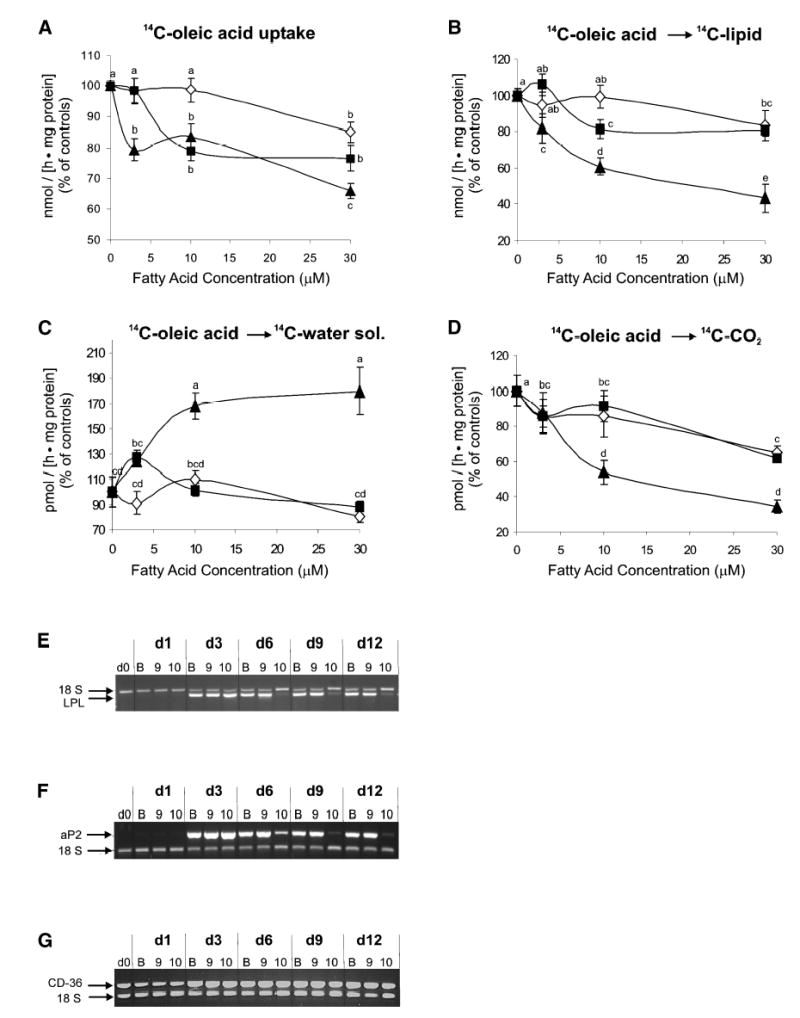
Isomer-specific regulation of human adipocyte lipid metabolism by CLA. Cultures of differentiating human preadipocytes were continuously treated with increasing concentrations (0, 3, 10, or 30 μM) of either LA (diamond), cis-9,trans-11 CLA (square), or trans-10,cis-12 CLA (triangle) for 6 days during differentiation. On Day 6, [14C]oleic acid metabolism was measured by determining the incorporation of the radionuclide into distinct cellular and gaseous fractions. A: [14C]oleic acid (6.2 nmol) uptake after 20 min incubation; control rate was 38.1 nmol/(h · mg protein). B: [14C]oleic acid (12.5 nmol) incorporation into the lipid-soluble cellular fraction after 2 h incubation; control rate was 5.3 nmol/(h · mg protein). C: [14C]oleic acid (12.5 nmol) incorporation into the water-soluble cellular fraction after 2 h incubation; control rate was 53.4 pmol/(h · mg protein). D: [14C]CO2 production from [14C]oleic acid following 90 min incubation with 12.5 nmol [14C]oleic acid; control rate was 100 pmol/(h · mg protein). For A–D, data are expressed as a percentage of vehicle control (BSA) levels. Means (±SEM; n = 6) not sharing a common superscript differ, P < 0.05. In addition, the effects of BSA (B), 30 μM cis-9,trans-11 CLA (9), or 30 μM trans-10,cis-12 CLA (10) on lipoprotein lipase (LPL) (E), adipocyte fatty acid binding protein (aP2) (F), and fatty acid translocase (CD-36) (G) gene expression over the differentiation time course (Days 0, 1, 3, 6, 9, and 12 postinduction) were examined using multiplex semi-quantitative RT-PCR. 18S rRNA was used as an internal control. Results for LPL, aP2, and cd36 are representative of two separate experiments from independent human subjects.
As the level of trans-10,cis-12 CLA increased in the cultures, [14C]oleic acid incorporation into lipid- and water-soluble fractions decreased and increased, respectively (Fig. 4B, 4C). In contrast, cis-9,trans-11 CLA and LA had only a minor inhibitory effect on [14C]oleic acid incorporation into lipid and did not affect the incorporation into the water-soluble fraction (Fig. 4B, C).
Furthermore, addition of increasing concentrations of CLA isomers and LA decreased fatty acid oxidation, as determined by [14C]CO2 production from [14C]oleic acid (Fig. 4D). However, cultures treated with 10 μM and 30 μM trans-10,cis-12 CLA had less [14C]CO2 produced from [14C]oleic acid (e.g., ~55% and 40% of control cells, respectively) compared with equimolar concentrations of cis-9,trans-11 CLA (e.g., ~90% and 65% of control cells, respectively) and LA (e.g., ~85% and 65% of control cells, respectively).
Parallel experiments showed that the expressions of LPL and aP2 (Fig. 4E, F, respectively) were significantly decreased in cultures treated for 6 days with 30 μM trans-10,cis-12 CLA compared with all other treatments. By contrast, the expression of CD-36 (Fig. 4G), a plasma membrane translocase involved in fatty acid transport, was only slightly decreased by trans-10,cis-12 CLA (e.g., ~80% and ~70% of controls, after 9 days and 12 days of treatment, respectively). In summary, these results show that the trans-10,cis-12 CLA isomer specifically decreases fatty acid uptake and esterification as well as oxidation of these exogenously derived fatty acids.
Isomer-specific regulation by CLA of gene expression in adipocytes
To determine the extent to which CLA’s suppression of lipid metabolism was due to suppressing the differentiation program, we examined the isomer-specific impact of CLA on the expression of genes involved in preadipocyte differentiation, including the master regulator of adipocyte differentiation, PPARγ, and several genes known to be positively regulated by PPARγ such as LPL, aP2, and ACBP, (53, 54, 64). The expressions of several other adipocyte genes such as C/EBPα, glycerol dehydrogenase (GPDH), hormone-sensitive lipase (HSL), leptin, perilipin, and acetyl-CoA carboxylase (ACC) were also determined. The time courses of expression of these genes are shown in Fig. 5A. With the exception of leptin, gene expressions paralleled that of PPARγ and peaked on Day 3 of the differentiation program (Fig. 5A).
Fig. 5.
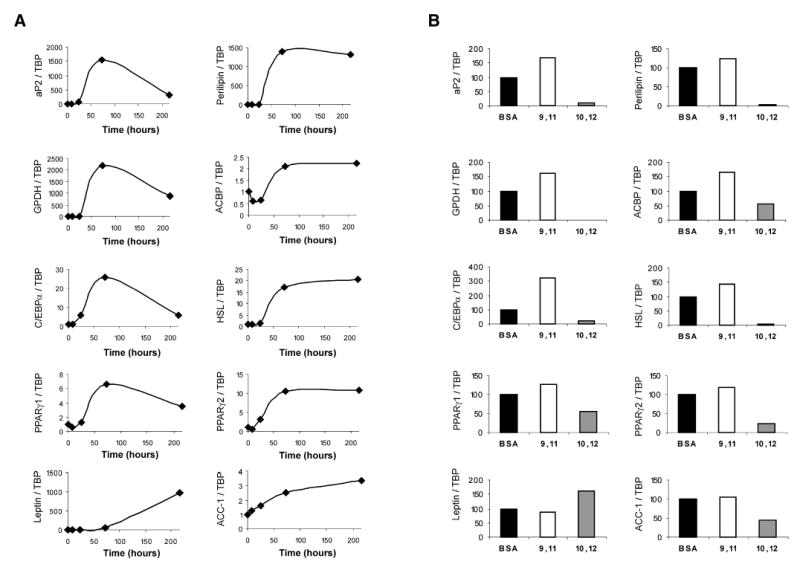
Time course and CLA-induced alterations of human adipocyte gene expression. A: For the time course data, confluent cultures of human preadipocytes were induced to differentiate under standard adipogenic conditions, and total RNA was harvested throughout adipose conversion (Day 0, 8 h, 24 h, 72 h, and 216 h postinduction). Total RNA was used for first-strand cDNA synthesis, and real-time quantitative RT-PCR analyses were performed to analyze the expression of acyl-CoA binding protein (ACBP), adipocyte fatty acid binding protein (aP2), CAAT/enhancer binding protein α (C/EBPα), glycerol dehydrogenase (GPDH), hormone-sensitive lipase (HSL), perilipin, peroxisome proliferator-activated receptors γ1 and γ2 (PPARγ1 and PPARγ2), leptin, and acetyl-CoA carboxylase (ACC). The relative expression level of a given gene was calculated after normalization to TATA-binding protein expression, and was expressed relative to Day 0 (confluent, noninduced) controls. B: To examine the effects of fatty acid treatment on gene expression, cultures were continuously treated with either a BSA vehicle control, 30 μM cis-9,trans-11 CLA (9, 11), or 30 μM trans-10,cis-12 CLA (10, 12) for either 0 h, 8 h, 24 h, 72 h, or 216 h during differentiation. Real-time quantitative RT-PCR analyses were performed as stated above to analyze gene expression. Results shown are only for the 216 h treatments and are representative of three separate experiments from independent human subjects.
CLA treatment had no impact on gene expressions after 8 h, 24 h, or 72 h of treatment, i.e., during the time of treatment with the PPARγ ligand BRL49653. However, after 9 days of treatment with trans-10,cis-12 CLA, the expression of PPARγ1 and PPARγ2, as well as known PPARγ target genes (e.g., ACBP, aP2, and perilipin-A), was markedly reduced compared with that of control cultures (Fig. 5B). The CLA-mediated down-regulation of aP2 and perilipin-A were also reflected in drastic reductions of their respective protein levels (Fig. 6A), which could not be rescued by cosupplementation with LA (Fig. 6B). In addition, the levels of mRNA for C/EBPα, GPDH, HSL, and ACC were dramatically lower in cultures treated with trans-10,cis-12 CLA compared with the other treatments (Fig. 5B). In contrast, cis-9,trans-11 CLA increased the expression of most of these genes. Interestingly, the expression of leptin was increased in cultures treated with trans-10,cis-12 CLA compared with controls, whereas cis-9,trans-11 CLA had no effect. Taken together, these results show that the effect of the trans-10,cis-12 CLA isomer is not simply a general down-regulation of all adipocyte-specific genes.
Fig. 6.
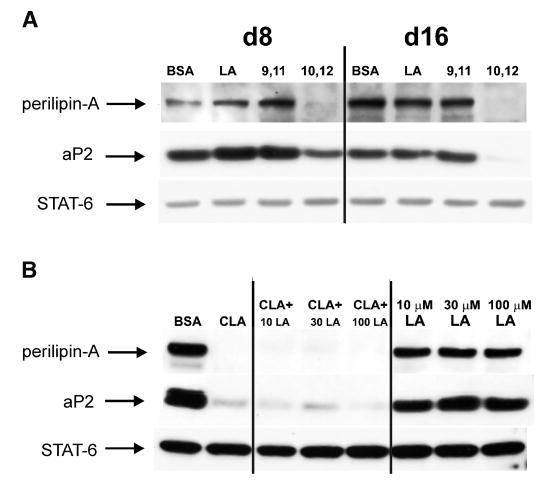
Isomer-specific down-regulation of adipocyte fatty acid binding protein (aP2) and perilipin protein levels by CLA are not rescued by LA supplementation. Western blot analyses of perilipin A and aP2 proteins were conducted in differentiating human preadipocytes under the following treatment conditions: A: Cultures were continuously treated with either a BSA vehicle control or 30 μM LA, cis-9,trans-11 CLA (9, 11), or trans-10,cis-12 CLA (10, 12), and total cellular protein was harvested on Day 8 (d8) and Day 16 (d16) of differentiation. B: Cultures were treated continuously with either a vehicle control (BSA), 30 μM trans-10,cis-12 CLA alone (CLA), or 30 μM trans-10,cis-12 CLA plus increasing levels (10 μM, 30 μM, or 100 μM) of LA (CLA + 10 LA, CLA + 30 LA, CLA + 100 LA), or increasing levels of LA alone (10 μM LA, 30 μM LA, 100 μM LA), and total cellular protein was harvested on Day 12 of differentiation. The abundant protein signal transducer and activator of transcription six was used as a loading control.
CLA antagonizes ligand-dependent activation of PPARγ
We demonstrated that trans-10,cis-12 CLA decreased the expression of genes influencing differentiation, including those regulated by PPARγ, and PPARγ expression itself. Since CLA isomers have been shown to activate PPARγ with very low efficacy (55, 56), it is possible that CLA directly affects PPARγ activity by competing with endogenous ligands with higher efficacy. To investigate this hypothesis, we transiently transfected 3T3-L1 adipocytes with a reporter construct containing the proximal promoter and intron 1 of the rat ACBP gene. We have recently identified a PPRE located in intron 1 of this gene, and have shown that it efficiently mediates transactivation by endogenous PPARγ in 3T3-L1 adipocytes (64). In the absence of an exogenously added PPARγ ligand, both isomers of CLA slightly decreased reporter activity (Fig. 7). Furthermore, when 0.1 μM BRL 49653 was added along with CLA to the cultures, both isomers antagonized the ligand-dependent activation of the reporter construct, with trans-10,cis-12 CLA being the most robust antagonist. Importantly, neither BRL49653 nor CLA isomers affected the activity of the reporter construct when the PPRE was mutated. These data show that both CLA isomers are indeed able to directly antagonize PPARγ activity.
Fig. 7.
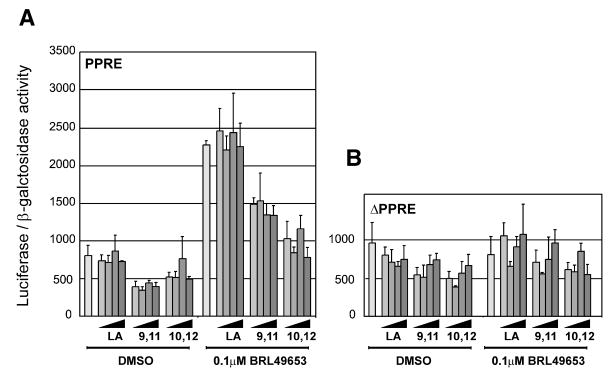
Acute effect of CLA isomers on PPARγ activity in 3T3-L1 adipocytes. 3T3-L1 adipocytes (Day 4 after induction of differentiation) were transiently transfected with (A) the ACBP (−392/+979)-luc constructs containing the rat ACBP proximal promoter and intron 1 or (B) the rACBP(−392/+979)-Δ-peroxisome proliferator response element (PPRE)-luc reporter where the intronic PPRE has been mutated. Cells were transfected using LipofectAMINE PLUS, and 3 h later media was changed and fatty acids and/or BRL49653 were added as indicated. LA, cis-9,trans-11 CLA, or trans-10,cis-12 CLA were added to final concentrations of 0.1 μM, 0.3 μM, 1 μM, or 30 μM. Cells were harvested after 24 h and luciferase activity was measured and normalized to β-galactosidase activity.
DISCUSSION
To our knowledge, this is the first study to provide insights regarding the differential effects of trans-10,cis-12 and cis-9,trans-11 CLA on glucose and lipid metabolism and markers of differentiation in primary cultures of human preadipocytes. We have previously demonstrated that the trans-10,cis-12 isomer of CLA reduces de novo fatty acid synthesis from [14C]glucose when compared with vehicle- or cis-9,trans-11 CLA-treated cultures of human preadipocytes (18). In this study, we show that trans-10,cis-12 CLA dose-dependently reduced insulin-stimulated uptake (Fig. 3A) and oxidation (Fig. 3B) of glucose in differentiating cultures of human preadipocytes. The reduction in facilitated uptake was paralleled by a dramatic reduction in GLUT4 mRNA (Fig. 3C). In addition, our data demonstrate that the trans-10,cis-12 isomer of CLA represses the uptake, incorporation into lipid, and oxidation to CO2 of oleic acid when compared with all other treatments (Fig. 4A, B, D) in human adipocytes.
Although trans-10,cis-12 CLA reduced glucose uptake in cultures of differentiating human adipocytes, this is not likely the main TG-lowering mechanism of trans-10,cis-12 CLA, because de novo fatty acid synthesis is not robust in preadipocytes isolated from humans compared with preadipocytes from other mammals (68). In contrast, fatty acids delivered by lipoproteins or albumin contribute significantly to the cellular TG pool of human adipocytes (68). In support of this concept, we found that only 0.9% of the total radiolabeled glucose that got into control cells was recovered in the lipid-soluble fraction. In contrast, 96% of the sequestered [14C]oleic acid was recovered in the lipid-soluble fraction in nontreated control cultures. Furthermore, the rate of oxidation of [14C]oleic acid to [14C]CO2 (~100 pmol/[h ··mg protein]) was 6-fold higher than [14C]glucose to [14C]CO2 (~15 pmol/[h · mg protein]) in vehicle treated cultures. In addition, the rate of [14C]oleic acid uptake (38 nmol/[h · mg protein]) was ~260-fold greater than the rate of insulin-stimulated uptake of [3H]2-deoxy-glucose (146 pmol/[h · mg protein]). Collectively, these data show that primary cultures of differentiating human preadipocytes utilize [14C]oleic acid much more readily than [14C]glucose for energy production and storage, and it is likely that intra-cellular TG pools are derived mainly from preformed fatty acids compared with de novo fatty acid synthesis.
In this work, we have addressed the mechanism by which trans-10,cis-12 CLA decreased glucose and fatty acid uptake and incorporation into cellular lipids by investigating the effect of CLA isomers on the mRNA expression of a number of adipocyte genes. Our data clearly show that the CLA isomers have little effect on adipocyte gene expression during the first 3 days after induction of differentiation when the PPARγ agonist BRL49653 is present in the cell culture medium. By contrast, chronic treatment with trans-10,cis-12 CLA until Day 9 significantly reduces the expression of several adipocyte-specific genes, including PPARγ and PPARγ target genes (Fig. 5B), whereas cis-9,trans-11 CLA treatment increases PPARγ-dependent gene expression. As PPARγ is a key transcription factor in the induction of adipogenesis and lipid accumulation, this isomer-specific down-regulation of PPARγ expression is likely to explain at least part of the observed effects of trans-10,cis-12 CLA on glucose and lipid metabolism.
In addition, since PPARγ activity is regulated by fatty acid ligands (46, 48, 53), and since the CLA isomers have been reported to be weak agonists of PPARγ (55, 56), we speculated that the CLA isomers might act as partial agonists of PPARγ, thereby antagonizing PPARγ activity by competing with endogenous ligands with higher efficacy. To investigate this hypothesis, we transiently transfected mature 3T3-L1 adipocytes with PPAR-responsive constructs. Our results show that both CLA isomers can directly antagonize both basal PPARγ activity (i.e., the activity dependent on endogenous ligands) as well as transcriptional activity induced by suboptimal concentrations of BRL49653 in murine adipocytes (Fig. 7). Although the trans-10,cis-12 CLA isomer is slightly more effective than the cis-9,trans-11 CLA isomer, lack of strict isomer specificity indicates that direct antagonism is unlikely to contribute significantly to the antiadipogenic effects of trans-10,cis-12 CLA. It remains possible that long-term treatment, as opposed to the short-term treatment in transient transfections, with trans-10,cis-12 CLA interferes with the synthesis of endogenous PPARγ ligands in human preadipocytes, thereby down-regulating PPARγ activity. For example, the 35% decrease in 20:4 in the phospholipid fraction induced by trans-10,cis-12 CLA treatment might reduce the synthesis of prostaglandins activating PPARγ. However, so far our results support a model in which the trans-10,cis-12 CLA isomer specifically down-regulates the expression of PPARγ, and thereby decreases both lipogenesis and adipogenesis.
Along with the PPARγ-dependent effects of CLA on glucose and lipid metabolism, our work suggests that the CLA isomers might also directly interfere with cellular enzyme activity. In this work, we show that trans-10,cis-12 CLA was incorporated into cellular neutral lipids and phospholipids (Table 3) and can thereby possibly alter membrane fluidity and/or signal transduction. Furthermore, in keeping with other reports, trans-10,cis-12 CLA dramatically reduced the MUFA/SFA ratio in differentiating cultures of human preadipocytes, specifically 16:1/16:0 (Table 3). It is probable that this shift in fatty acid profile is due to decreased expression or activity of SCD-1 (69–71), as previously reported by Ntambi and others (21, 22, 25). In agreement with this hypothesis, we found that mRNA levels of SCD-1 in cultures treated with 30 μM trans-10,cis-12 CLA on Days 6 and 9 of differentiation were 33% and 18% of control levels, respectively (Fig. 2). Since oleate is the preferred substrate for TG synthesis, the decrease in MUFA is likely to decrease TG accumulation independent of the expression of the respective enzymes involved. Furthermore, we observed a 100% increase in 18:0 in the neutral lipid fraction. This CLA-mediated increase in 18:0 could negatively feed back on the activity and expression of ACC (Fig. 5B), and subsequently decrease de novo fatty acid lipogenesis, as we have previously demonstrated (18).
Finally, trans-10,cis-12 CLA increased the incorporation of [14C]oleic acid into the water-soluble cellular fraction when compared with all other treatments (Fig. 4C). Interestingly, a recent report demonstrated that CLA isomers were poorly oxidized and accumulated as carnitine and acyl-CoA esters, which would partition to the water-soluble cellular fraction (72). Therefore, trans-10,cis-12 CLA may interfere with β-oxidation, resulting in an accumulation of thioesters of fatty acids.
Based on our data, it is tempting to speculate that the unresolved effects of CLA in human supplementation studies are due to the inclusion of cis-9,trans-11 CLA in the crude mixture. Our data suggest that the trans-10,cis-12 isomer of CLA is indeed antiadipogenic in differentiating human preadipocytes, whereas the cis-9,trans-11 isomer promotes adipogenesis. Therefore, when given together as an isomeric mixture, the antagonistic roles of cis-9,trans-11 CLA and trans-10,cis-12 CLA may negate one another, resulting in no change in adiposity. In support of this concept, Riserus et al. (43) found that obese subjects receiving 3.4 g/day of trans-10,cis-12 CLA for 12 weeks weighed less, had smaller girths, and had lower BMIs compared with baseline measurements. In contrast, the weight, girth, and BMI of subjects receiving 3.4 g/day of a crude mixture of cis-9,trans-11 and trans-10,cis-12 CLA for 12 week were similar to baseline.
In summary, our data suggest that physiological levels (e.g., 10–30 μM) of trans-10,cis-12 CLA can act as an anti-adipogenic nutrient in differentiating human preadipocytes. However, this effect is highly isomer specific, and previous work by our group (18) has demonstrated that the level used is critical in eliciting a TG-lowering effect. It is likely that the trans-10,cis-12 isomer of CLA reduces TG accumulation in differentiating preadipocytes by reducing fatty acid uptake and altering fatty acid metabolism in a way that favors less oxidation, desaturation, and esterification of long-chain fatty acids. Furthermore, the trans-10,cis-12 isomer of CLA dramatically inhibited insulin-stimulated glucose uptake and oxidation, which was coupled to decreased expression of GLUT4. These effects on fatty acid and glucose uptake and metabolism are likely downstream effects of the ability of trans-10,cis-12 isomers of CLA to decrease PPARγ expression or to antagonize PPARγ-dependent activation of genes directly or indirectly involved in these metabolic processes. Our results show that both CLA isomers antagonize PPARγ activity, indicating that direct antagonism cannot explain the isomer specific effects of trans-10,cis-12 CLA.
Collectively, these trans-10,cis-12 CLA-induced metabolic perturbations are indeed antiadipogenic, but may have deleterious effects in vivo, because down-regulation of PPARγ may lead to insulin resistance, hyperglycemia, and hyperlipidemia. Therefore, it is imperative that future studies identify isomer-specific responses, and consider the safety and efficacy of dietary supplementation in human populations. It is entirely possible that proper isomer-specific dose titrations may prove beneficial, but more research is needed to fully understand the molecular mechanism by which CLA is exerting its antiobesity effects before we can be sure.
Acknowledgments
The authors are very grateful to Dr. C. Londos and Dr. D. Bernlohr for providing antiserum and antibodies for perilipin and aP2, respectively, and to GlaxoSmithKline for supplying the Rosiglitazone. The authors also thank Dr. Robin Hopkins for her excellent technical assistance, and Dr. Yuan-Di Halvorsen for useful discussions. This work was supported by Grants from the National Instiwtutes of Health (DK-59289-01 and DK-630289), the Office of Dietary Supplements, the North Carolina Agriculture Research Service grant 06520 to M.K.M., the Danish Dairy Research Foundation, and The Innovation Act under the Danish Government to S.M.
References
- 1.Ha Y, Storkson J, Pariza M. Inhibition of benzo (a)pyrene-induced mouse forestomach neoplasia by conjugated dienoic derivatives of linoleic acid. Cancer Res. 1990;50:1097–1101. [PubMed] [Google Scholar]
- 2.Schultz T, Chew B, Seaman W. Differential stimulatory and inhibitory responses on human MCF-7 breast cancer cells to linoleic acid and conjugated linoleic acid in culture. Anticancer Res. 1992;12:2143–2146. [PubMed] [Google Scholar]
- 3.Ip M, Masso-Welch P, Shoemaker S, Shea-Eaton W, Ip C. Conjugated linoleic acid inhibits proliferation and induces apoptosis of normal rat mammary epithelial cells in primary culture. Exp Cell Res. 1999;250:22–34. doi: 10.1006/excr.1999.4499. [DOI] [PubMed] [Google Scholar]
- 4.Houseknecht K, Heuvel J, Moya-Camerena S, Portacarrero C, Peck L, Nickel K, Belury M. Dietary conjugated linoleic acid normalized impaired glucose tolerance in Zucker diabetic fa/fa rats. Biochim Biophys Res Commun. 1998;244:678–682. doi: 10.1006/bbrc.1998.8303. [DOI] [PubMed] [Google Scholar]
- 5.Ryder J, Portacarrero C, Song X, Cui L, Yu M, Combatsiarus T, Galuska D, Bauman D, Barbano D, Charron M, Zierath J, Houseknecht K. Isomer-specific antidiabetic properties of conjugated linoleic acid. Improved glucose tolerance, skeletal muscle insulin action, and UCP-2 gene expression. Diabetes. 2001;50:1149–1157. doi: 10.2337/diabetes.50.5.1149. [DOI] [PubMed] [Google Scholar]
- 6.Lee K, Kritchevsky D, Pariza M. Conjugated linoleic acid and atherosclerosis in rabbits. Atherosclerosis. 1994;108:19–25. doi: 10.1016/0021-9150(94)90034-5. [DOI] [PubMed] [Google Scholar]
- 7.Nicolosi R, Rogers E, Kritchevsky D, Scimeca J, Huth P. Dietary conjugated linoleic acid reduces plasma lipoproteins and early atherosclerosis in hypercholesterolemic hamster. Artery. 1997;22:266–277. [PubMed] [Google Scholar]
- 8.Miller C, Park Y, Pariza M, Cook M. Feeding conjugated linoleic acid to animals partially overcomes catabolic responses due to endotoxin injection. Biochim Biophys Res Commun. 1994;198:1107–1112. doi: 10.1006/bbrc.1994.1157. [DOI] [PubMed] [Google Scholar]
- 9.Bassaganya-Riera J, Hontecillas-Magarzo R, Bregendahl K, Wannemuehler M, Zimmerman D. Effects of dietary conjugated linoleic acid in nursery pigs of dirty and clean environments of growth, empty body composition, and immune competence. J Anim Sci. 2001;79:714–721. doi: 10.2527/2001.793714x. [DOI] [PubMed] [Google Scholar]
- 10.Takahashi K, Kawamata K, Ayiba Y, Iwata T, Kasai M. Influence of dietary conjugated linoleic acid isomers on early inflammatory responses in male broiler chickens. Br J Poult Sci. 2002;43:47–53. doi: 10.1080/00071660120109881. [DOI] [PubMed] [Google Scholar]
- 11.Park Y, Albright K, Liu W, Storkson J, Cook M, Pariza M. Effect of conjugated linoleic acid on body composition in mice. Lipids. 1997;32:853–858. doi: 10.1007/s11745-997-0109-x. [DOI] [PubMed] [Google Scholar]
- 12.Park Y, Storkson J, Albright K, Liu W, Cook M, Pariza M. Evidence that the trans-10, cis-12 isomer of conjugated linoleic acid induces body composition changes in mice. Lipids. 1999a;34:235–241. doi: 10.1007/s11745-999-0358-8. [DOI] [PubMed] [Google Scholar]
- 13.Park Y, Albright K, Storkson J, Liu W, Pariza M. Changes in body composition in mice during feeding and withdrawal of conjugated linoleic acid. Lipids. 1999;33:243–248. doi: 10.1007/s11745-999-0359-7. [DOI] [PubMed] [Google Scholar]
- 14.Delany J, Blohm F, Truett A, Scimeca J, West D. Conjugated linoleic acid rapidly reduces body fat content in mice without affecting energy intake. Am J Physiol. 1999;276:R1172–R1179. doi: 10.1152/ajpregu.1999.276.4.R1172. [DOI] [PubMed] [Google Scholar]
- 15.Cook, M., D. Jerome, T. Crenshaw, P. Buege, M. Pariza, K. Albright, S. Schmidt, J. Scimeca, P. Lotgren, and E. Hentges. 1999. Feeding conjugated linoleic acid improves feed efficiency and reduces carcass fat in pigs. Adipocyte Biology and Hormone Signalling Symposium in Madison, WI.
- 16.Ostrowska E, Muralitharian M, Cross R, Bauman D, Dunshea F. Dietary conjugated linoleic acid increases lean tissue and decreases body fat deposition in growing pigs. J Nutr. 1999;129:2037–2042. doi: 10.1093/jn/129.11.2037. [DOI] [PubMed] [Google Scholar]
- 17.Brown JM, Evans M, McIntosh M. Linoleic acid partially reverses the suppressive effects of conjugated linoleic acid on preadipocyte triglyceride content. J Nutr Biochem. 2001;12:381–387. doi: 10.1016/s0955-2863(01)00152-8. [DOI] [PubMed] [Google Scholar]
- 18.Brown JM, Halvorsen YD, Lea-Currie R, Geigerman C, McIntosh M. Trans-10, cis-12, but not cis-9, trans-11 conjugated linoleic acid attenuates lipogenesis in primary cultures of stromal vascular cells isolated from human adipose tissue. J Nutr. 2001;131:2316–2321. doi: 10.1093/jn/131.9.2316. [DOI] [PubMed] [Google Scholar]
- 19.Satory D, Smith S. Conjugated linoleic acid inhibits proliferation but stimulates lipid filling of murine 3T3–L1 preadipocytes. J Nutr. 1999;129:92–97. doi: 10.1093/jn/129.1.92. [DOI] [PubMed] [Google Scholar]
- 20.Brodie A, Manning C, Ferguson K, Jewell D, Hu C. Conjugated linoleic acid inhibits differentiation of pre- and postconfluent 3T3–L1 preadipocytes but inhibits proliferation only in preconfluent cultures. J Nutr. 1999;129:602–609. doi: 10.1093/jn/129.3.602. [DOI] [PubMed] [Google Scholar]
- 21.Choi Y, Kim Y, Han Y, Park Y, Pariza M, Ntambi J. The trans-10, cis-12 isomer of conjugated linoleic acid downregulates steroyl-CoA desaturase 1 gene expression in 3T3–L1 adipocytes. J Nutr. 2000;130:1920–1924. doi: 10.1093/jn/130.8.1920. [DOI] [PubMed] [Google Scholar]
- 22.Choi Y, Park Y, Storkson J, Pariza M, Ntambi J. Inhibition of steroyl-CoA desaturase activity by the cis-9, trans-11 isomer and the trans-10, cis-12 isomer of conjugated linoleic acid in MDA-MB-231 and MCF-7 human breast cancer cells. Biochim Biophys Res Commun. 2002;294:785–790. doi: 10.1016/S0006-291X(02)00554-5. [DOI] [PubMed] [Google Scholar]
- 23.Eder K, Slomma N, Becker K. Trans-10, cis-12 conjugated linoleic acid suppresses the desaturation of linoleic and α-linolenic acid in HepG2 cells. J Nutr. 2002;132:1115–1121. doi: 10.1093/jn/132.6.1115. [DOI] [PubMed] [Google Scholar]
- 24.Bretillion L, Chardigny J, Gregoire S, Berdeaux O, Sebedio J. Effects of conjugated linoleic acid isomers on hepatic microsomal desaturation activities in vitro. Lipids. 1999;34:965–969. doi: 10.1007/s11745-999-0446-9. [DOI] [PubMed] [Google Scholar]
- 25.Lee K, Pariza M, Ntambi J. Conjugated linoleic acid decreases hepatic steroyl-CoA desaturase mRNA expression. Biochim Biophys Res Commun. 1998;248:817–821. doi: 10.1006/bbrc.1998.8994. [DOI] [PubMed] [Google Scholar]
- 26.Miyazaki K, Kim Y, Gray-Keller M, Attie A, Ntambi J. The biosynthesis of hepatic cholesterol esters and triglycerides is impaired in mice with a disruption of the gene for steroyl-CoA desaturase 1. J Biol Chem. 2000;275:30132–30138. doi: 10.1074/jbc.M005488200. [DOI] [PubMed] [Google Scholar]
- 27.Martin J, Gregoire S, Seiss M, Genty M, Chardigny J, Berdeaux O, Juaneda P, Sebedio J. Effects of conjugated linoleic acid isomers on lipid metabolizing enzymes in male rats. Lipids. 2000;35:91–98. doi: 10.1007/s11745-000-0499-9. [DOI] [PubMed] [Google Scholar]
- 28.Evans J, Odle J, Xi L, McIntosh M. Trans-10, cis-12 conjugated linoleic acid increases fatty acid oxidation in 3T3–L1 preadipocytes. Lipids. 2002;36:1223–1232. doi: 10.1093/jn/132.3.450. [DOI] [PubMed] [Google Scholar]
- 29.Moya-Camerena S, Vander Heuvel J, Blanchard S, Leesnitzer L, Belury M. Conjugated linoleic acid is a potent and naturally occuring ligand and activator of PPARα. J Lipid Res. 1999;40:1426–1433. [PubMed] [Google Scholar]
- 30.Moya-Camerena S, Vander Heuvel J, Belury M. Conjugated linoleic acid activates peroxisome proliferator-activated receptor alpha and beta subtypes but does not induce hepatic peroxisome proliferation in Sprague-Dawley rats. Biochim Biophys Acta. 1999;1436:331–342. doi: 10.1016/s0005-2760(98)00121-0. [DOI] [PubMed] [Google Scholar]
- 31.Sakano M, Miyanaga F, Kawahara S, Yamauchi K, Fakuda N, Wantabe K, Iwata T, Sugano M. Dietary conjugated linoleic acid reciprocally modifies ketogenesis and lipid secretion by the rat liver. Lipids. 1999;34:997–1000. doi: 10.1007/s11745-999-0450-0. [DOI] [PubMed] [Google Scholar]
- 32.Terpstra A, Beynen A, Everts H, Kocsis E, Katan M, Zock L. The decrease in body fat in mice fed conjugated linoleic acid is due to increased energy expenditure and energy loss in the excretia. J Nutr. 2002;132:940–945. doi: 10.1093/jn/132.5.940. [DOI] [PubMed] [Google Scholar]
- 33.West D, Delaney J, Camet P, Blohm R, Truett A, Scimeca J. Effects of conjugated linoleic acid on body fat and energy metabolism in the mouse. Am J Physiol. 1998;275:R667–R672. doi: 10.1152/ajpregu.1998.275.3.R667. [DOI] [PubMed] [Google Scholar]
- 34.Delaney J, West D. Changes in body composition with conjugated linoleic acid. J Am Coll Nutr. 2000;19:478S–493S. doi: 10.1080/07315724.2000.10718952. [DOI] [PubMed] [Google Scholar]
- 35.Peters J, Park Y, Gonzales F, Pariza M. Influence of conjugated linoleic acid on body composition and target gene expression in peroxisome proliferator-activated receptor-α null mice. Biochim Biophys Acta. 2001;1533:233–242. doi: 10.1016/s1388-1981(01)00155-x. [DOI] [PubMed] [Google Scholar]
- 36.Berven G, Bye A, Hals O, Blankson H, Thom E, Wadstein J, Gudmundsen O. Safety of conjugated linoleic acid (CLA) in overweight or obese human volunteers. European J Lipid Sci Technol. 2000;102:455–462. [Google Scholar]
- 37.Zambell K, Keim N, Van Loan M, Gale B, Benito P, Kelly D, Nelson G. Conjugated linoleic acid supplementation in humans: effects of body composition and energy expenditure. Lipids. 2000;35:777–782. doi: 10.1007/s11745-000-0585-z. [DOI] [PubMed] [Google Scholar]
- 38.Medina E, Horn W, Keim N, Havel P, Benito P, Kelly D, Nelson G, Erickson K. Conjugated linoleic acid supplementation in humans: effects of circulating leptin concentrations and appetite. Lipids. 2000;35:783–788. doi: 10.1007/s11745-000-0586-y. [DOI] [PubMed] [Google Scholar]
- 39.Thom E, Wadstein J, Gudmundsen O. Conjugated linoleic acid reduces body fat in healthy, exercising humans. J Int Med Res. 2001;29:392–396. doi: 10.1177/147323000102900503. [DOI] [PubMed] [Google Scholar]
- 40.Mougious V, Matsakas A, Petridou A, Ring S, Sagredos A, Melissopoulou A, Tsigilis N, Nikolaidis M. Effect of supplementation with conjugated linoleic acid on human serum lipids and body fat. J Nutr Biochem. 2001;12:585–594. doi: 10.1016/s0955-2863(01)00177-2. [DOI] [PubMed] [Google Scholar]
- 41.Blankson H, Stakkestad J, Fagertun H, Thom E, Wadstein J, Gudmundsen O. Conjugated linoleic acid reduces body fat mass in overweight and obese humans. J Nutr. 2000;130:2943–2948. doi: 10.1093/jn/130.12.2943. [DOI] [PubMed] [Google Scholar]
- 42.Smedman A, Vessby G. Conjugated linoleic acid supplementation in humans—metabolic effects. Lipids. 2001;36:773–781. doi: 10.1007/s11745-001-0784-7. [DOI] [PubMed] [Google Scholar]
- 43.Riserus U, Arner P, Brismar K, Vessby B. Treatment with dietary trans-10 cis-12 conjugated linoleic acid causes isomer-specific insulin resistance in obese men with the metabolic syndrome. Diabetes Care. 2002;25:1516–1521. doi: 10.2337/diacare.25.9.1516. [DOI] [PubMed] [Google Scholar]
- 44.Riserus U, Basa S, Jovinge S, Fredrickson G, Arnlov J, Vessby B. Supplementation with conjugated linoleic acid causes isomer-dependent oxidative stress and elevated C-reactive protein: a potential link to fatty acid-induced insulin resistance. Circulation. 2002;106:1925–1929. doi: 10.1161/01.cir.0000033589.15413.48. [DOI] [PubMed] [Google Scholar]
- 45.Desvergne B, Wahli W. Peroxisome proliferator activated receptors: nuclear control of metabolism. Endocr Rev. 1999;20:649–688. doi: 10.1210/edrv.20.5.0380. [DOI] [PubMed] [Google Scholar]
- 46.Spiegelman B. PPAR-γ: adipogenic regulator and thiazolidinedione receptor. Diabetes. 1998;47:507–514. doi: 10.2337/diabetes.47.4.507. [DOI] [PubMed] [Google Scholar]
- 47.Gottlicher M, Widmark E, Li Q, Gustafsson JA. Fatty acids activate a chimera of the clofibric acid-activated receptor and the glucocorticoid receptor. Proc Natl Acad Sci USA. 1992;89:4653–4657. doi: 10.1073/pnas.89.10.4653. [DOI] [PMC free article] [PubMed] [Google Scholar]
- 48.Krey G, Braissant O, L’Horset F, Kalkhoven E, Perroud M, Parker M, Wahli W. Fatty acids, eicosanoids, and hypolipidemic agents identified as ligands of peroxisome proliferator-activated receptors by coactivator-dependent receptor ligand assay. Mol Endocrinol. 1997;11:779–791. doi: 10.1210/mend.11.6.0007. [DOI] [PubMed] [Google Scholar]
- 49.Keller H, Devchard P, Perroud M, Wahli W. PPAR alpha structure-function relationships derived from species-specific differences in responsiveness to hypolipidemic agents. J Biol Chem. 1997;378:651–655. doi: 10.1515/bchm.1997.378.7.651. [DOI] [PubMed] [Google Scholar]
- 50.Dreyer C, Krey G, Keller H, Givel F, Helftenbein G, Wahli W. Control of the peroxisomal beta-oxidation pathway by a novel family of nuclear hormone receptors. Cell. 1992;68:879–887. doi: 10.1016/0092-8674(92)90031-7. [DOI] [PubMed] [Google Scholar]
- 51.Tontonoz P, Hu E, Graves R, Budvari A, Spiegelman B. mPPAR gamma 2: tissue-specific regulator of an adipocyte enhancer. Genes Dev. 1994;8:1224–1234. doi: 10.1101/gad.8.10.1224. [DOI] [PubMed] [Google Scholar]
- 52.Wu Z, Xie Y, Morrison RF, Bucher NL, Farmer SR. PPARgamma induces the insulin-dependent glucose transporter GLUT4 in the absence of C/EBPalpha during the conversion of 3T3 fibroblasts into adipocytes. J Clin Invest. 1998;101:22–32. doi: 10.1172/JCI1244. [DOI] [PMC free article] [PubMed] [Google Scholar]
- 53.Schoonjans K, Peinado-Onsurbe J, Lefebvre A, Heyman R, Briggs M, Deeb S, Staels B, Auwerx J. PPARalpha and PPARgamma activators direct a distinct tissue-specific transcriptional response via a PPRE in the lipoprotein lipase gene. EMBO J. 1996;15:5336–5348. [PMC free article] [PubMed] [Google Scholar]
- 54.Sato O, Kuriki C, Fukui Y, Motojima K. Dual promoter structure of mouse and human fatty acid translocase/cd36 genes and unique transcriptional activation by peroxisome proliferator-activated receptor alpha and gamma ligands. J Biol Chem. 2002;277:15703–15711. doi: 10.1074/jbc.M110158200. [DOI] [PubMed] [Google Scholar]
- 55.Clement L, Poirier H, Niot I, Bocher V, Guerre-Millo M, Krief S, Staels B, Besnard P. Dietary trans-10,cis-12 conjugated linoleic acid induces hyperinsulinemia and fatty liver in the mouse. J Lipid Res. 2002;43:1400–1409. doi: 10.1194/jlr.m20008-jlr200. [DOI] [PubMed] [Google Scholar]
- 56.Yu Y, Correll P, Vander Heuvel JP. Conjugated linoleic acid decreases production of pro-inflammatory products in macrophages: evidence for a PPAR gamma-dependent mechanism. Biochim Biophys Acta. 2002;1581:89–99. doi: 10.1016/s1388-1981(02)00126-9. [DOI] [PubMed] [Google Scholar]
- 57.Abumrad NA, Forrest C, Regen D, Sanders S. Increase in membrane uptake of long-chain fatty acids early during preadipocyte differentiation. Proc Natl Acad Sci USA. 1991;88:6008–6012. doi: 10.1073/pnas.88.14.6008. [DOI] [PMC free article] [PubMed] [Google Scholar]
- 58.McIntosh M, Lea-Currie YR, Geigerman C, Patseavouras L. Dehydroepiandrosterone alters the growth of stromal vascular cells from human adipose tissue. Int J Obes Relat Metab Disord. 1999;23:595–602. doi: 10.1038/sj.ijo.0800874. [DOI] [PubMed] [Google Scholar]
- 59.Bligh E, Dyer W. A rapid method of total lipid extraction and purification. Can J of Biochem Phys. 1959;37:911–917. doi: 10.1139/o59-099. [DOI] [PubMed] [Google Scholar]
- 60.Folch J, Lees M, Sloan Stanley G. A simple method for the isolation and purification of total lipid from animal tissues. J Biol Chem. 1957;226:497–509. [PubMed] [Google Scholar]
- 61.Hansen JB, Petersen RK, Larsen BM, Bartkova J, Alsner J, Kristiansen K. Activation of peroxisome proliferator-activated receptor γ bypasses the function of the retinoblastoma protein in adipocyte differentiation. J Biol Chem. 1999;274:2386–2393. doi: 10.1074/jbc.274.4.2386. [DOI] [PubMed] [Google Scholar]
- 62.Harp J, Franklin D, Vanderpuije A, Gimble J. Differential expression of signal transducers and activators of transcription during human adipogenesis. Biochim Biophys Res Commun. 2001;281:907–912. doi: 10.1006/bbrc.2001.4460. [DOI] [PubMed] [Google Scholar]
- 63.Stephens J, Morrison R, Pilch P. The expression and regulation of STATs during 3T3–L1 adipocyte differentiation. J Biol Chem. 1996;271:10441–10444. doi: 10.1074/jbc.271.18.10441. [DOI] [PubMed] [Google Scholar]
- 64.Helledie T, Grontved L, Jensen SS, Kiilerich P, Reitveld L, Albrektsen T, Boysen MS, Nohr J, Larsen LK, Fleckner J, Stunnenberg HG, Kristiansen K, Mandrup S. The gene encoding the Acyl-CoA-binding protein is activated by peroxisome proliferator-activated receptor gamma through an intronic response element functionally conserved between humans and rodents. J Biol Chem. 2002;277:26821–26830. doi: 10.1074/jbc.M111295200. [DOI] [PubMed] [Google Scholar]
- 65.Helledie T, Antonius M, Sorensen R, Hertzel A, Bernlohr D, Kolvraa S, Kristiansen K, Mandrup S. Lipid-binding proteins modulate ligand-dependent trans-activation by peroxisome proliferator-activated receptors and localize to the nucleus as well as the cytoplasm. J Lipid Res. 2000;41:1740–1751. [PubMed] [Google Scholar]
- 66.Furuta M, Yano Y, Gabazza E, Araki-Sasaki R, Tanaka T, Katsuki A, Hori Y, Nakatani K, Sumida Y, Adachi Y. Troglitazone improves GLUT4 expression in adipose tissue in an animal model of obese type 2 diabetes mellitus. Diabetes Res Clin Pract. 2002;56:159–171. doi: 10.1016/s0168-8227(01)00373-4. [DOI] [PubMed] [Google Scholar]
- 67.Shintani M, Nishimura H, Yonemitsu S, Ogawa Y, Hayashi T, Hosoda K, Inoue G, Nakao K. Troglitazone not only increases GLUT4 but also induces its translocation in rat adipocytes. Diabetes. 2001;50:2296–2300. doi: 10.2337/diabetes.50.10.2296. [DOI] [PubMed] [Google Scholar]
- 68.Swierczynski J, Goyke E, Wach L, Pankiewicz A, Kochan Z, Adamonis W, Sledzinski Z, Aleksandrowicz Z. Comparitive study of the lipogenic potential of human and rat adipose tissue. Metabolism. 2000;49:594–599. doi: 10.1016/s0026-0495(00)80033-5. [DOI] [PubMed] [Google Scholar]
- 69.Ntambi J, Miyazaki M, Stoehr J, Lan H, Kendziorski C, Yandell B, Song Y, Cohen P, Friedman J, Attie A. Loss of stearoyl-CoA desaturase-1 function protects mice against obesity. Proc Natl Acad Sci USA. 2002;99:11482–11486. doi: 10.1073/pnas.132384699. [DOI] [PMC free article] [PubMed] [Google Scholar]
- 70.Cohen P, Miyazaki M, Socci N, Hagge-Greenberg A, Liedtke W, Soukas A, Sharma R, Hudgins L, Ntambi J, Friedman J. Role for stearoyl-CoA desaturase-1 in leptin-mediated weight loss. Science. 2002;297:240–243. doi: 10.1126/science.1071527. [DOI] [PubMed] [Google Scholar]
- 71.Kim Y, Gomez F, Fox B, Ntambi J. Differential regulation of the stearoyl-CoA desaturase genes by thiazolidinediones in 3T3–L1 adipocytes. J Lipid Res. 2000;41:1310–1316. [PubMed] [Google Scholar]
- 72.Demizieux L, Degrace P, Gresti J, Loreau O, Noel JP, Chardigny J, Sebedio J, Clouet P. Conjugated linoleic acid isomers in mitochondria: evidence for an alteration of fatty acid oxidation. J Lipid Res. 2002;43:2112–2122. doi: 10.1194/jlr.m200170-jlr200. [DOI] [PubMed] [Google Scholar]