

Abstract
In humans and rodents, the lysosomal catabolism of core Man3GlcNAc2 N-glycan structures is catalyzed by the concerted action of several exoglycosidases, including a broad specificity lysosomal α-mannosidase (LysMan), core-specific α1,6-mannosidase, β-mannosidase, and cleavage at the reducing terminus by a di-N-acetylchitobiase. We describe here the first cloning, expression, purification, and characterization of a novel human glycosylhydrolase family 38 α-mannosidase with catalytic characteristics similar to those established previously for the core-specific α1,6-mannosidase (acidic pH optimum, inhibition by swainsonine and 1,4-dideoxy-1,4-imino-d-mannitol, and stimulation by Co2+ and Zn2+). Substrate specificity studies comparing the novel human α-mannosidase with human LysMan revealed that the former enzyme efficiently cleaved only the α1–6mannose residue from Man3GlcNAc but not Man3GlcNAc2 or other larger high mannose oligosaccharides, indicating a requirement for chitobiase action before α1,6-mannosidase activity. In contrast, LysMan cleaved all of the α-linked mannose residues from high mannose oligosaccharides except the core α1–6mannose residue. α1,6-Mannosidase transcripts were ubiquitously expressed in human tissues, and expressed sequence tag searches identified homologous sequences in murine, porcine, and canine databases. No expressed sequence tags were identified for bovine α1,6-mannosidase, despite the identification of two sequence homologs in the bovine genome. The lack of conservation in 5′-flanking sequences for the bovine α1,6-mannosidase genes may lead to defective transcription similar to transcription defects in the bovine chitobiase gene. These results suggest that the chitobiase and α1,6-mannosidase function in tandem for mammalian lysosomal N-glycan catabolism.
There are two broad families of α-mannosidases in mammalian cells that are involved in either glycan biosynthesis or glycan catabolism (1, 2). The class 1 α-mannosidases (CAZy glycosylhydrolase family 47, GH47 (3–7)) are largely restricted to the early secretory pathway where they are involved in glycoprotein maturation and quality control (2, 8). The class 2 α-mannosidases (CAZy glycosylhydrolase family 38, GH38 (3–7)) are found in the Golgi complex, lysosomes, and cytosol where they are involved in either glycoprotein biosynthesis or catabolism (2, 9).
The broad specificity lysosomal α-mannosidase (LysMan)2 is a GH38 exoglycosidase involved in glycan catabolism where it cleaves nonreducing terminal α1–2-, α1–3-, and α1–6Man linkages in N-linked glycans (10–12). An enzyme deficiency in LysMan leads to the lysosomal storage disease, α-mannosidosis, characterized by glycan accumulation and pathology in humans (13, 14), cattle (15), cats (16, 17), mice (18) and guinea pigs (19). α-Mannosidosis models in various mammalian species reveal a remarkable variation in the glycan structures that accumulate. Vertebrate α-mannose-containing structures include both high mannose N-glycans as well as the tri-mannosyl core (Manα1–3[Manα1–6]Manβ1–4GlcNAcβ1–4GlcNAc) of complex type structures. In humans and rodents, a deficiency in LysMan causes the predominant accumulation of the major linear storage product, Manα1–3Manβ1–4GlcNAc, along with other extended products on the α1–3Man branch (20–22), suggesting that an alternative enzyme is responsible for the cleavage of the α1–6Man residue from the tri-mannosyl core structure. In contrast, cattle and cats with α-mannosidosis accumulate glycans that contain a GlcNAc2 core structure and an α1–6Man residue linked to the core β1–4Man in addition to the extended structures on the α1–3Man branch (23), suggesting an association between cleavage of the chitobiosyl core and the cleavage of the core α1–6Man linkage.
An enzyme specific for the hydrolysis of the core α1–6Man linkage was initially identified from human α-mannosidosis fibroblasts (24) and partially purified from human spleen (25) and rat liver (26), but the cDNA encoding this enzyme activity has not been identified. The substrate specificity for the core-specific rat (26) lysosomal α1,6-mannosidases was found to be dependent on the prior action of the lysosomal enzymes, β-aspartyl N-acetylglucosylamine amidohydrolase (glycosylasparaginase) and di-N-acetyl-chitobiase (chitobiase) to yield a Manα1–3[Manα1–6]Manβ1–4GlcNAc core structure necessary for α1,6-mannosidases action (21, 22, 26).
Most surprisingly, chitobiase gene expression is selectively inactivated through alterations in promoter element sequences in cows, and presumably other mammalian species (cats, sheep, dogs, and pigs), but not in humans or mice (27, 28). Thus, the core-specific α1,6-mannosidase is predicted to be effective in glycan catabolism only in the latter species. The presence of chitobiase activity in some mammalian species and not others can therefore at least partially account for the differences in accumulated oligosaccharides in the α-mannosidosis models (21, 22). A further parallel between chitobiase and α1,6-mannosidase was revealed when the latter activity could only be detected in tissue extracts of humans and rodents but not from cattle or cats (21, 25), suggesting a similar expression pattern to chitobiase.
Although the α1,6-mannosidase might be thought of as redundant with the activity of the broad specificity LysMan for N-glycan catabolism, detailed substrate specificity studies have revealed that LysMan has a very poor efficiency for cleavage of the α1–6Man linkage in the N-glycan tri-mannosyl core (10, 11). Thus, a model was proposed that the chitobiase and core-specific α1,6-mannosidase work in functional collaboration to provide the full and efficient catabolism of N-glycans in the lysosomes of some mammalian species, but the accessory activities of the chitobiase and possibly the α1,6-mannosidase have been lost through alterations in promoter sequences leading to defective transcription in ungulates, cats, and dogs (21). The absence of a clearly identified gene or cDNA encoding the core-specific α1,6-mannosidase has made it difficult to establish the genetic relationship between the expression and transcriptional inactivation of chitobiase versus the core-specific α1,6-mannosidase.
In an independent line of investigation, an α-mannosidase of 135 kDa was isolated previously from porcine epididymal fluid that was proposed to be involved in sperm maturation (29, 30). Both pig (29) and mouse (31) cDNA homologs encoding this enzyme have been cloned, but no recombinant enzyme expression or detailed substrate specificity data have been presented.
In the present work, we have cloned a human cDNA encoding a novel α-mannosidase with sequence similarity to the pig and mouse 135-kDa “epididymal” α-mannosidases. We expressed the enzyme and characterized its substrate specificity toward high mannose oligosaccharides, demonstrating that the cDNA encodes the lysosomal core-specific α1,6-mannosidase. Transcripts encoding the enzyme are expressed in a similar subset of mammalian species as the chitobiase, and comparison of the 5′-flanking regions for the bovine and human α1,6-mannosidase genes indicated that alterations in promoter element sequences could account for the loss of transcript expression in bovine tissues.
EXPERIMENTAL PROCEDURES
Cloning and Expression of a Novel Human α-Mannosidase
The human cDNA homolog of the pig/mouse 135-kDa α-mannosidase was identified by sequence searching of a cloned cDNA library (GenBankTM accession number AL553663, human placenta; Invitrogen), and the cDNA in the pCMV script vector was fully sequenced to confirm that it matched the corresponding GenBankTM reference sequence (accession number NM_015274). Primers were designed to amplify an ~1.3-kb fragment encompassing the 3′ end of the coding region in order to append a sequence containing a His6 tag and a hemagglutinin (HA) tag (33), followed by a new termination codon and a NotI site. The 5′ primer annealed to base pair position 1810–1839 relative to the ATG initiation codon, just 5′ from an EcoRI site at position 1846–1851. The 3′ primer annealed to base pair position 2998–3027 just prior to the termination codon (at base pair position 3028–3030) followed by a 5′ extension containing the tag sequences, termination codon, and NotI site. The amplification was performed in a 25-μl reaction volume containing 20 ng of the novel α-mannosidase/pCMV plasmid DNA, 1.0 mm MgCl2, 30 mm Tris-HCl (pH 8.5), 7.5 mm (NH4)2SO4, 200 μM each dNTP, 0.5 μM 5′ and 3′ primer, and 2.5 units of Pfu polymerase in a thermal cycler programmed for a preincubation at 94 °C (1 min) followed by a temperature cycle of 94 °C (30 s), 65 °C (30 s), and 72 °C (4 min) for 30 cycles. After PCR, the resulting 1.3-kb amplimer was subcloned into an EcoRI/NotI-digested pBSSK vector (Stratagene) and sequenced. The full coding region was then reassembled by digestion of the vector with EcoRI and insertion of a 1.9-kb EcoRI fragment corresponding to the front portion of the coding region. The resulting construct was fully sequenced to confirm the orientation of insertion of the EcoRI fragment and to check for sequence errors prior to transfer to a mammalian expression vector (pEAK10, Edge Biosystems; Gaithersburg, MD) as a HindIII/NotI fragment. For the human LysMan construct, a similar modification of the 3′ end to append a His6 and HA tag sequence was accomplished by PCR amplification of a 740-bp fragment at the 3′ end of the coding region. The 5′ primer annealed to base pair position 2401–2470, upstream of an SacI site, and the 3′ primer annealed to base pair position 3052–3081 with a 5′ extension on the latter primer containing the tag sequences, termination codon, and NotI site. The amplimer was subcloned into a SacI/NotI-digested pBSSK vector (Stratagene) and sequenced. The modified COOH terminus of the coding region was then ligated to an EcoRI/SacI fragment corresponding to the front portion of the coding region and transferred to the pEAK10 expression vector as a HindIII/NotI fragment. For the generation of stable transfectants in HEK293 cells, the cells were grown to 50–80% confluency in 100-mm tissue culture dishes in Dulbecco’s modified Eagle’s medium, 10% fetal calf serum (Sigma). Transfection was performed using 20 μg of the respective expression plasmid construct and 10 μl of Lipofectamine 2000 (Invitrogen) according to the method of Wu et al. (34). Following transfection, the cells were allowed to grow at 37 °C for 24 h before selection with 1 μg/ml puromycin. After growth to confluency, the cultures were split 1:5, and the antibiotic selection was increased to 2 μg/ml puromycin for subsequent growth. For enzyme production, the transfected cells were grown in T175 flasks to confluency, and the medium was replaced with Dulbecco’s modified Eagle’s medium, 10% fetal calf serum, and 1.5% Me2SO to allow cell cycle arrest. The cultures were then grown for an additional 3 weeks at 37 °C prior to harvesting the conditioned medium.
Purification of Recombinant Human LysMan and the Novel Human α-Mannosidase
The conditioned medium from the transfected cultures expressing LysMan or the novel α-mannosidase was clarified by centrifugation at 2800 × g for 30 min prior to purification using an identical protocol for both enzymes. The respective clarified culture medium was brought to a final concentration of 0.4 m ammonium sulfate, and the solutions were applied to a phenyl-Sepharose column (32 × 140 mm; Amersham Biosciences). The columns were washed with 60 ml of phosphate buffer containing 0.4 m ammonium sulfate, and α-mannosidase activity was eluted over a 900-ml decreasing linear gradient of 0.4–0 m ammonium sulfate and a 0–40% increasing gradient of ethylene glycol in sodium phosphate buffer (pH 7.5). Fractions containing enzyme activity were pooled and dialyzed overnight against 50 mm sodium phosphate buffer (pH 7.5) at 4 °C. The dialyzed samples were then applied to a cobalt-chelating Sepharose column (16 × 100 mm). The column was washed with 30 ml of sodium phosphate buffer (pH 7.5) containing 300 mm NaCl, and enzyme activity was eluted with a linear gradient of 0–300 mm imidazole at a flow rate of 3 ml/min. Peak fractions of α-mannosidase activity were pooled and concentrated by ultrafiltration through a YM-100 membrane (Amicon, Inc., Beverly, MA). The concentrated enzyme preparations were further purified by loading onto a Superdex 200 gel filtration column (16 × 700 mm; Amersham Biosciences) pre-equilibrated with 50 mm HEPES (pH 7.5) and 200 mm NaCl. Fractions containing α-mannosidase activity were pooled and used for substrate specificity studies and kinetic analysis.
Identification of Proteins by SDS-PAGE and Mass Spectrometry
An aliquot of the purified recombinant enzyme (50 μg) was subjected to SDS-PAGE, stained with Coomassie Blue G-250 (Bio-Safe Coomassie Stain, Bio-Rad), and destained with water. The protein band was excised, reduced, alkylated, and digested in-gel with modified trypsin (35) (Worthington, Freehold, NJ) as described previously (36). The tryptic peptides from the digested protein were resolved by capillary C18 reverse phase high pressure liquid chromatography with in-line tandem MS/MS on a Thermo Finnigan LTQ linear ion-trap mass spectrometer. The spectra were analyzed using TurboSequest software (Thermo Finnigan) and stringently filtered to identify the protein of interest (37). A total of seven tryptic peptides was identified with a minimum of 30% coverage of the human α-mannosidase sequence encoded by the expression construct.
Northern Blot Analysis
Northern blots containing poly(A+) RNA from various human tissues were purchased from Clontech. The blots were prehybridized, hybridized, and washed as described previously (38) using radiolabeled probes comprised of the 740-bp or 1.3-kb amplimers from human LysMan or novel α-mannosidase coding regions, respectively, generated as described above. The blots were subsequently hybridized with a radiolabeled human β-actin probe (Clontech) to act as an RNA load control for the blots. 32P-Labeled DNA probes were generated using [32P]dCTP (Amersham Biosciences) and the Ready-To-Go labeling system (Amersham Biosciences). Blots were visualized with a PhosphorImager (Amersham Biosciences) after a 1-day exposure.
α-Mannosidase Activity Assays Using 4-Methylumbelliferyl-α-d-Mannopyranoside (4MU-Man) as Substrate and Inhibition Studies
Hydrolysis of 4MU-Man (Sigma) was assayed at 37 °C using 5 μl of enzyme sample in a final volume of 50 μl containing 100 mm sodium acetate (pH 4.0), 3 mm 4MU-Man, and 1 mm CoCl2. Reactions were stopped by the addition of 150 μl of sodium carbonate to a final concentration of 150 mm. Fluorescence was quantitated on a Spectramax Gemini XS fluorescence reader. All fluorescence values were compared with a 4MU-Man standard curve. For inhibition studies, swainsonine (SW), 1,4-dideoxy-1,4-imino-d-mannitol (DIM), kifunensine (KIF), and 1-deoxymannojirimycin were prepared as stock solutions in water. Inhibitor data were collected in triplicate. Lineweaver-Burk plots and Dixon plots were used to transform the kinetic data into values of Km and Ki as described previously (12, 39–41).
Metal Cation and pH Studies
To examine the effects of metal cations on enzyme activity, the enzymes were first preincubated with 5 mm EDTA for 2 h and then passed through a HiTrap desalting column (16 × 50 mm; Amersham Biosciences) to remove the chelating agent and any dissociable divalent cations. Aliquots of the enzyme preparations were then preincubated at various times with 1 mm concentrations of either CoCl2, CuCl2, FeCl2, MgCl2, MnCl2, NiCl2, ZnCl2, or EDTA in 200 mM HEPES buffer (pH 7.0) at 37 °C. The enzyme samples were subsequently brought to pH 4.0 with McIlvaine buffer (42); 4MU-Man was added to a final concentration of 3 mm, and the mixture was then incubated at 37 °C for 1 h for the enzyme assays. To determine the influence of pH on enzyme activity, enzyme assays were performed using McIlvaine buffer (42) in the indicated pH ranges.
Mannosidase Activity Assays with High Mannose Substrate
Various pyridylamine (PA)-tagged glycans, including Man9GlcNAc2-PA, Man8GlcNAc2-PA, Man7GlcNAc2-PA, Man6GlcNAc2-PA, Man5Glc-NAc2-PA, and GlcNAcMan5GlcNAc2-PA, were isolated as described previously (43–45) and incubated with the novel human α-mannosidase or human LysMan in 100 mm sodium acetate buffer (pH 4.0) for 24 h at 37 °C. The reaction products were then incubated at 100 °C for 5 min and resolved on a Hypersil APS2 NH2 HPLC column as described previously (12, 45).
1H NMR Analysis of the Oligosaccharide Digestion Products
Enzyme reactions containing 20 μg of Man3GlcNAc2 (V-LABS, Inc.) were digested with human LysMan, or the novel human α1,6-mannosidase, either with or without prior digestion by recombinant human chitobiase (kind gift of Dr. Nathan Aronson, University of South Alabama) in 100 mm deuterated sodium acetate buffer (D3, 99%) (pH 4.0). Oligosaccharide samples were removed at the indicated time points, deuterium exchanged by repeated evaporation from D2O (99.95%, Cambridge Isotope Labs., Inc.) under vacuum, and then dissolved in 500 μl of D2O. 1H NMR analysis of the oligosaccharides in D2O or sodium acetate buffer (D3, 99%, Cambridge Isotope Labs, Inc.) was performed at 25 or 37 °C on a Varian Unity Inova 600- or 800-MHz spectrometer using standard acquisition parameters available in the Varian VNMR software package.
Sequence Analysis and Graphical Representation
GH38 sequences were identified in the GenBankTM sequence database by TBLASTN searches (46) using the human LysMan protein sequence (GenBankTM accession number NP_000519) as the query, and the resulting sequences were edited to reflect the Glyco_hydro_38 PFAM motif (47). Multiple sequence alignments were performed using the ClustalX program (48), and a neighbor-joining tree was generated within this program using 1000 bootstrap trials. The dendrogram was displayed as a radial unrooted tree using the program Treeview (49). Species-specific DNA sequence searches of EST databases were performed by BLASTN searches of species-filtered EST databases using the web-based resource of the National Center for Biotechnology Information (www.ncbi.nlm.nih.gov/BLAST). Comparative pairwise analysis of DNA sequences was accomplished using the Compare and DotPlot subroutines (50) of the University of Wisconsin Genetics Computer Group (GCG software, version 10.2) with a window of 21 residues and a stringency of 14.
RESULTS
Isolation of a Human cDNA Homolog of the Pig and Mouse 135-kDa Epididymal Mannosidase
Previous studies on the α1,6-mannosidase from human spleen and rat liver indicated that several characteristics of the enzyme were similar to other GH38 α-mannosidases, including size (180 kDa), pH optimum (pH ~4.0), and sensitivity to inhibition by SW and DIM (24–26). We therefore examined sequences related to the GH38 α-mannosidases in an effort to identify potential candidates that might encode this catalytic activity. Members of the GH38 α-mannosidase family from a number of fully sequenced genomes were identified based on the presence of a PFAM signature peptide sequence (47), termed Glyco_hydro_38, comprised of a 327-amino acid NH2-terminal sequence motif. Sequences containing this motif were identified from human and mouse sources, as well as other representative species (Drosophila melanogaster, Caenorhabditis elegans, Arabidopsis thaliana, Saccharomyces cerevisiae, and representative bacteria and archaea), and were used to generate an unrooted dendrogram for this multigene family. The dendrogram (Fig. 1) shows four sequence clades for the GH38 α-mannosidases from the respective species. One of the clades represents members known to be involved in glycoprotein biosynthesis (Golgi α-mannosidase II and Golgi α-mannosidase IIx from humans and mice (2, 9, 51, 52) as well as orthologs from D. melanogaster, C. elegans, and A. thaliana). A second clade contains the broad specificity lysosomal α-mannosidase involved in glycoprotein catabolism (LysMan from humans and mice (12, 53, 54) as well as multiple orthologs in D. melanogaster, C. elegans, and A. thaliana). The third clade is a heterogeneous collection of enzymes represented by the mammalian ER/cytosolic α-mannosidase involved in dolichol-oligosaccharide turnover and catabolism of glycans on glycoproteins that failed ER quality control and were translocated into the cytosol in mammalian species (2, 55). Several orthologs within this latter clade were found in other diverse organisms classes (i.e. fungi, archaea, and bacteria) suggesting an ancestral origin of this clade. Most surprisingly, this latter clade does not contain members from D. melanogaster or A. thaliana, suggesting that there may be selective loss of this gene in some species. Finally, a relatively restricted set of vertebrate sequences comprise the fourth GH38 clade (species and GenBankTM accession numbers include human (NP_056089); orangutan (Q5RDJ3); chimpanzee (XP_51709); mouse (NP_032576); rat (AAP92617); pig (NP_999014); cow (XP_601662); dog (XP_545897); chicken (XP_420805); and fish (Tetraodon nigroviridis) (CAG04580); only human, mouse, and pig peptide sequences are shown in Fig. 1). Noteworthy is the lack of any sequence homologs within this latter clade from D. melanogaster, C. elegans, A. thaliana, or any other nonvertebrate source. The cDNAs encoding the pig and mouse homologs have been cloned previously as the respective epididymal α-mannosidases (29, 31), but recombinant enzyme expression or characterization has not been accomplished. A sequence alignment of the human, mouse, and pig sequences from this clade is shown in Fig. 2, along with the addition of the human LysMan sequence as reference. The sequence alignment highlights both the Glyco_hydro_38 PFAM motif as well as a second PFAM motif at the COOH terminus (termed Glyco_hydro_38C). Secondary structure features derived from the bovine LysMan structure (Protein Data Bank code 1O7D (56)) are also indicated below the sequence alignment demonstrating a dominant conservation in sequence within regions of secondary structure. All of the members of this novel vertebrate clade also retain the conserved catalytic acid/base (Asp290), nucleophile (Asp151), and residues involved in Zn2+ coordination (His36, His419, and Asp38) in the active sites of both bovine LysMan (56) and Drosophila Golgi α-mannosidase II (57) (numbering based on the novel human α-mannosidase sequence, colored boxes, Fig. 2). The human sequence homolog within this novel GH38 α-mannosidase clade was further examined here as a representative of the enzymes in this latter subgroup to determine its catalytic characteristics, oligosaccharide substrate specificity, and transcript expression pattern.
FIGURE 1. Dendrogram of GH38 α-mannosidases shows four sequence clades.
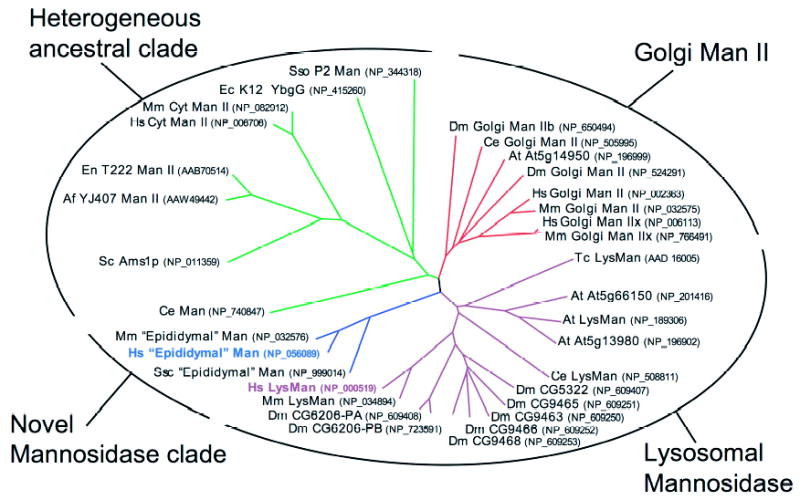
Members of the GH38 family were identified by TBLASTN searches (46) of the GenBankTM database. The respective sequences were edited to reflect the Glyco_hydro_38 PFAM motif (47); multiple sequence alignments were performed using the ClustalX program (48), and a neighbor-joining tree was generated within this program using 1000 bootstrap trials. The tree is displayed as a radial unrooted dendrogram using the program Treeview (49). Sequence and species designations and their corresponding GenBankTM accession numbers (in parentheses) are indicated at the end of each branch using abbreviations for the respective organism as follows: Hs, Homo sapiens; Mm, Mus musculus; Ssc, Sus scrofa; Dm, Drosophila melanogaster; Ce, Caenorhabditis elegans; At, Arabidopsis thaliana; Sc, Serevisiae cerevisiae; Tc, Trypanosoma cruzi; Af, Aspergillus fumigatus; En, Emericella nidulans; Ec, E. coli; and Sso, Sulfolobus solfataricus. The outer oval with the indicated labels and the colored branches for the dendrogram show the designations of the subgroups within the GH38 α-mannosidase family based on the sequence similarity analysis. The four clades represent Golgi mannosidase II, lysosomal mannosidase, a heterogeneous ancestral clade, and a clade represented by a collection of novel vertebrate α-mannosidase sequences described in this paper. The highlighted text for the novel human α-mannosidase (blue boldface text) and human LysMan (purple boldface text) show the sequences that were expressed and biochemically characterized in this paper.
FIGURE 2. Sequence alignments of GH38 members from the novel clade of α-mannosidases.
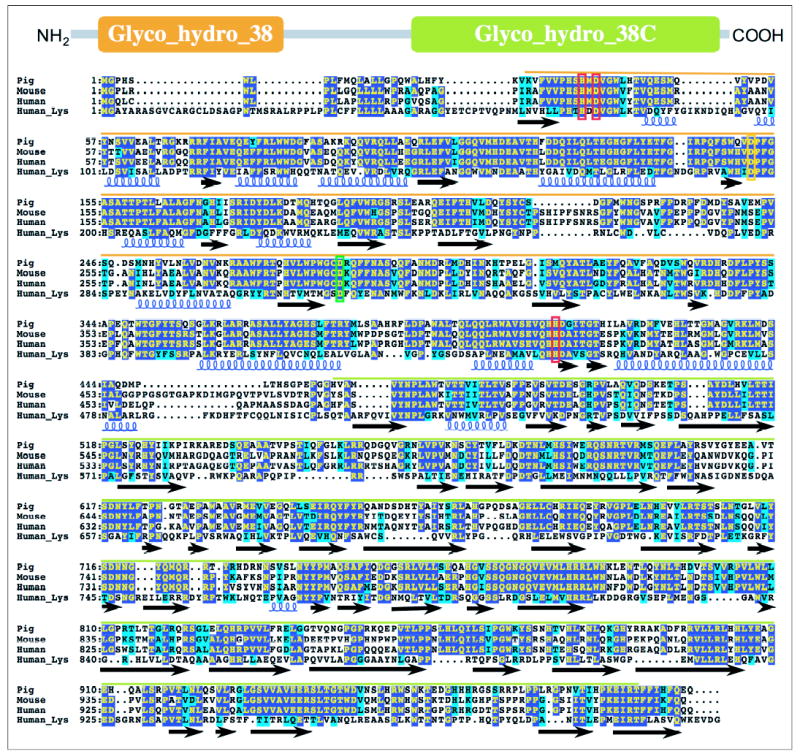
A diagrammatic representation of the coding region for GH38 mannosidases is shown at the top of the figure, indicated by the gray line, with two characteristic PFAM motifs highlighted by the large colored boxes (Glyco_hydro_38 highlighted in orange and Glyco_hydro_38C highlighted in green). GH38 α-mannosidase sequences from pig (Pig, GenBankTM accession number NP_999014), mouse (Mouse, GenBankTM accession number NP_032576), and human (Human, GenBankTM accession number NP_056089, the sequence studied here) sources as well as the broad specificity human LysMan sequence (Human_Lys, GenBankTM accession number NP_000519) are shown in the sequence alignment. Identical sequences are shown with dark blue highlighting, and similar sequences are displayed with light blue highlighting. The two signature PFAM motifs are highlighted in the sequence (Glyco_hydro_38, orange line over the sequence alignment, and Glyco_hydro_38C, green line over the sequence alignment). The positions of predicted secondary structure are indicated below the sequence alignment based on the structure of the bovine LysMan (Protein Data Bank code 1O7D (56)). α-Helical segments are represented by colored helices below the sequence alignment, whereas segments of β-sheet structure are indicated by solid black arrows. The putative conserved catalytic acid/base (Asp290, green box) and nucleophile (Asp151, orange box) are indicated based on the assignment of these roles in Drosophila Golgi α-mannosidase II (57). Residues involved in Zn2+ coordination (His36, His419, and Asp38, red boxes) are highlighted based on the structures of Drosophila Golgi α-mannosidase II (57) and bovine LysMan (56).
Recombinant Protein Expression in HEK293 Cells
A recombinant form of the novel human α-mannosidase was overexpressed and isolated as a secreted protein from the conditioned media of a stably transfected HEK293 cell line (TABLE ONE). Parallel expression and purification of human LysMan from transfected HEK293 cells was accomplished in order to compare the catalytic characteristics of the two enzymes. The conditioned media from the respective cell lines were harvested, and the enzymes were purified by a combination of phenyl-Sepharose, cobalt-chelating Sepharose, and Superdex-200 gel filtration chromatography (Fig. 3) using 4MU-Man as a substrate to monitor enzyme activity during purification. The bulk of the serum proteins were removed from the enzyme preparations on the cobalt-chelating Sepharose column. Most surprisingly, neither the His tag nor the HA tag appended to the COOH terminus of the α-mannosidase coding regions appeared to be retained by the recombinant proteins as determined by immunoblotting with the respective anti-epitope antibodies. To confirm that the enzymes that we isolated corresponded to the coding regions that we cloned and expressed, the purified enzyme preparations after Superdex-200 chromatography were resolved by SDS-PAGE, stained with Coomassie G-250, excised, digested with trypsin, and sequenced by liquid chromatography/tandem mass spectrometry as described under “Experimental Procedures.” At least seven peptide sequences covering at least 30% of the coding region were identified corresponding to the protein sequences encoded by our respective expression constructs confirming the identity of the recombinant protein products. No peptides were identified other than those encoded by the expected recombinant enzymes.
TABLE ONE.
Purification of recombinant human novel α-mannosidase from conditioned medium of stably transfected HEK293 cells assayed using 4MU-α-d-Man as a substrate
| Step | Protein | Activity | Specific activity | Enrichment | Yield |
|---|---|---|---|---|---|
| mg | units | units/mg × 103 | -fold | % | |
| Phenyl-Sepharose | 96 | 0.236 | 2.46 | 1 | 100 |
| Co2+ -chelate affinity | 0.19 | 0.034 | 179 | 72.7 | 14 |
| Superdex 200 | 0.017 | 0.025 | 1470 | 597 | 11 |
FIGURE 3. Purification of the novel recombinant human α-mannosidase and human LysMan from the culture medium HEK293 cells.
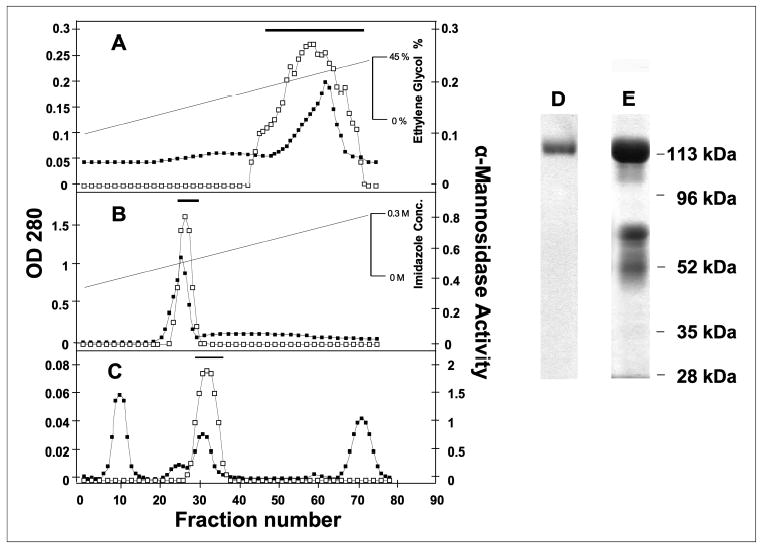
The conditioned medium from stably transfected HEK293 cells expressing the novel human α-mannosidase was successively chromatographed over phenyl-Sepharose (A), cobalt-chelating Sepharose (B), and Superdex-200 (C). Column fractions were assayed for α-mannosidase activity (open squares) and absorbance at 280 nm (solid squares). The pooled fractions from each chromatography step are indicated by the bar above the corresponding plot. The final enzyme preparations of the novel human α-mannosidase (D) and human LysMan (E) were resolved by SDS-PAGE and stained with Coomassie Blue G-250. The purified human LysMan on SDS-PAGE appears as a band at ~120 kDa for the full-length enzyme and two bands at ~72 and ~50 kDa that result from selective proteolysis as described previously (60).
pH, Inhibitor, and Metal Activation Studies
Enzyme assays performed with 4MU-Man as substrate revealed that both the novel human α-mannosidase and human LysMan had a pH optimum of ~4.0 (Fig. 4) and Km values of 7.6 and 0.52 mM (TABLE TWO), respectively, consistent with the demonstrated lysosomal localization for both enzymes (24, 26, 58). SW and DIM, classical class 2 mannosidase inhibitors, had similar effects on both enzymes, resulting in submicromolar Ki values (TABLE TWO). In contrast, KIF and 1-deoxymannojirimycin, typical class 1 mannosidase inhibitors, had less inhibitory effects on both enzymes.
FIGURE 4. Influence of pH on the novel human α-mannosidase and human LysMan enzyme activity.
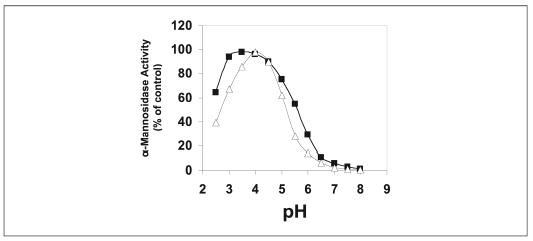
The novel human α-mannosidase (open triangles) and human LysMan (close squares) activities were assayed using 4MU-Man as substrate at the indicated pH values as described under “Experimental Procedures.”
TABLE TWO.
Comparison of inhibitor profiles for the novel human α-mannosidase and human LysMan using 4MU-Man as a substrate
| Inhibitors | Novel human α-mannosidasea | Human LysMana |
|---|---|---|
| Ki (μM) | Ki (μM) | |
| SW | 0.121 | 0.076 |
| DIM | 0.720 | 0.349 |
| KIF | 13 | 19 |
| 1-Deoxymannojirimycin | 202 | 65 |
The Km values for the novel human α-mannosidase and human LysMan using 4MU-Man substrate were 7.6 and 0.52 mm, respectively.
Both Drosophila Golgi α-mannosidase II and bovine LysMan are proposed to contain an enzyme-bound Zn2+ ion in their respective active sites involved in direct interactions with glycone substrate hydroxyl residues (56, 57). We tested the effects of various divalent cations on both the novel human α-mannosidase and human LysMan following removal of dissociable cations by treatment with EDTA (Fig. 5). Two effects were noticed in the divalent cation studies. First, the novel human α-mannosidase activity was stimulated by the addition of CoCl2, ZnCl2, MnCl2, and MgCl2, in descending order (9-fold maximal stimulation by CoCl2), whereas the other divalent cations had either no effect or were inhibitory. Second, the cations stimulated activity at varied rates and had varied effects on enzyme stability. CoCl2 and MnCl2 provided maximal stimulation after 1 h of preincubation, whereas the other cations exhibited maximal activity with no preincubation followed by progressive loss of activity (Fig. 5A). Human LysMan exhibited no stimulation by any of the cations, nor was the enzyme inactivated by more than ~40% by prolonged incubation with EDTA. Pretreatment with MnCl2, MgCl2, ZnCl2, or NiCl2 had similar effects as EDTA treatment, whereas incubation with CoCl2, CuCl2, and FeCl2 were more inhibitory than the other cations, especially following preincubation (Fig. 5B).
FIGURE 5. The effect of divalent cations on the novel human α-mannosidase and human LysMan enzyme activities.
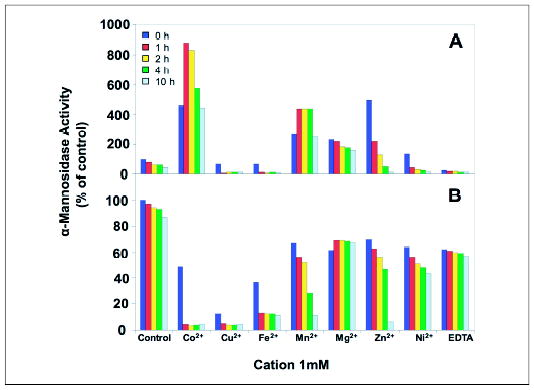
The novel human α-mannosidase (A) and human Lys-Man (B) were stripped of divalent cations by treatment with EDTA, desalted to remove the chelator, and then incubated for the indicated time in the presence of various divalent cations (CoCl2, CuCl2, FeCl2, MgCl2, MnCl2, NiCl2, and ZnCl2), EDTA, or control conditions in the presence of buffer alone (pH 7.0) at 37 °C. The pH was then adjusted to 4.0, and the enzyme activities were assayed with 4MU-Man as substrate. Activity levels are expressed as percentages of the level measured in control assays containing no metal cations. The color key in the figure indicates the time of incubation at 37 °C before the enzyme assay.
Substrate Specificity Studies with Larger Oligosaccharide Substrates
The substrate specificities of the novel human α-mannosidase and human LysMan were examined using a collection of high mannose N-glycan substrates tagged at their reducing terminus with pyridylamine. Similar units of enzyme activity for the two enzymes, based on 4MU-Man activity assays, were incubated with the respective substrates for 24 h at 37 °C and resolved by HPLC to examine the degree of glycan trimming. The novel human α-mannosidase was unable to cleave Man9–6GlcNAc2-PA or GlcNAcMan5GlcNAc2-PA (Fig. 6, b, e, h, k, and q), but the enzyme weakly cleaved Man5GlcNAc2-PA to Man4GlcNAc2-PA (60% conversion, Fig. 6n) only after prolonged incubation. By contrast, human LysMan hydrolyzed Man9–5GlcNAc2-PA down to Man4–2GlcNAc2-PA, (Fig. 6, c, f, i, l, and o) but would not cleave GlcNAcMan5GlcNAc2-PA (Fig. 6r). These results confirm that human LysMan can hydrolyze a variety of glycan substrates containing terminal α1–2-, α1–3-, and α1–6-linked mannose residues, whereas the novel α-mannosidase is unable to recognize these larger high mannose structures as effective substrates for hydrolysis.
FIGURE 6. Digestion of high mannose oligosaccharide substrates by the novel human α-mannosidase and human LysMan.
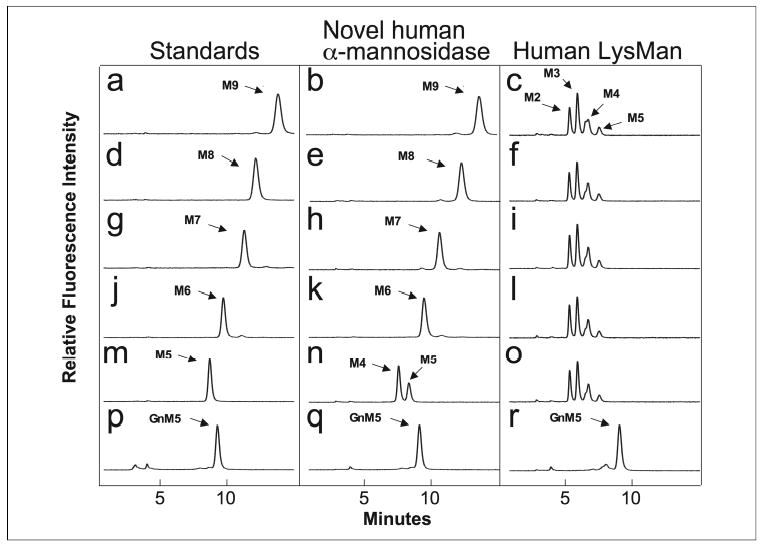
PA-tagged oligosaccharide substrates (Man9GlcNAc2-PA, M9; Man8GlcNAc2-PA, M8; Man7GlcNAc2-PA, M7; Man6GlcNAc2-PA, M6; Man5GlcNAc2-PA, M5; GlcNAcMan5GlcNAc2-PA, GnM5) were subjected to enzymatic cleavage with the novel human α-mannosidase or human LysMan for 24 h at 37 °C and resolved on a Hypersil APS2 NH2 column. Left panels, standard oligosaccharide substrates with elution positions indicated by the respective labels; center panels, digestion of respective oligosaccharide substrates by the novel human α-mannosidase; right panels, digestion of respective oligosaccharide substrates by human LysMan. Peaks were identified by comparison to PA-tagged standards of known structure (left panel). Standards and substrate digestions correspond to: a– c, Man9GlcNAc2-PA; d–f, Man8GlcNAc2-PA; g–i, Man7GlcNAc2-PA; j–l, Man6GlcNAc2-PA; m– o, Man5GlcNAc2-PA; p–r, GlcNAcMan5GlcNAc2-PA.
Substrate Specificity Studies of the Novel Human α-Mannosidase and Human LysMan toward Man3 Core-Mannosyl Oligosaccharides by 1H NMR
In an effort to determine whether the novel α-mannosidase has a substrate specificity similar to the core-specific α1,6-mannosidase (21, 24–26), we performed a series of time course studies for the digestion of Man3GlcNAc2–1 glycans, and we examined the reaction products by 1H NMR. Man3GlcNAc was generated from Man3GlcNAc2 by digestion with human chitobiase, and the spectra of each glycan were obtained for the assignment of the respective anomeric resonances (Fig. 7, A and B). Digestion of Man3GlcNAc2 by chitobiase resulted in the shift of a Glc-NAc H-1 resonance and the formation of a free GlcNAc enzymatic product (compare Fig. 7, A and B). This latter chitobiase product as well as the original Man3GlcNAc2 substrate were then used to generate a time course digestion profile with either the novel human α-mannosidase or human LysMan as the enzyme source. A 12-h digestion of the Man3GlcNAc substrate by the novel human α-mannosidase resulted in the disappearance of the α1–6Man residue (Man4′ H-1 resonance at δ = 4.914 ppm, Fig. 7C) with a corresponding appearance of a free mannose α-anomer resonance at δ = 5.164 ppm (Fig. 7C). Confirmation of the cleavage of the Man4′ residue was indicated by the loss of the H-2 resonance for Man4′ at δ = 3.976 ppm but retention of the H-1 and H-2 signals for Man4, Man3, and GlcNAc2 (Fig. 7C). A time course of Man3GlcNAc cleavage by the novel human α-mannosidase or the human LysMan indicated that both enzymes could remove a single monosaccharide from the glycan substrate, but each enzyme cleaved a different residue (Fig. 8). As indicated from the 12-h digestion in Fig. 7C, the novel human α-mannosidase rapidly cleaved the α1–6Man residue (Man4′) from the Manα1–6[Manα1–3]Manβ1–4GlcNAc substrate (Fig. 8B), whereas the human LysMan cleaved the α1–3Man residue (Man4) (Fig. 8H) without further cleavage. A similar result was obtained for human LysMan when incubated with the Man3GlcNAc2 as a substrate, only the α1–3Man residue (Man4) was cleaved (Fig. 8K). In contrast, no cleavage occurred when the novel human α-mannosidase was incubated with Man3GlcNAc2 substrate (Fig. 8E). These data indicate that the novel α-mannosidase can cleave the α1–6Man residue from the Man3GlcNAc core glycan structure only after the action of chitobiase to yield a Manα1–3Manβ1–4GlcNAc enzymatic product. These characteristics were consistent with data previously generated for the partially purified lysosomal core-specific α1,6-mannosidase (21, 24–26). Hereafter, we will refer to this enzyme as the human core-specific α1,6-mannosidase.
FIGURE 7. 1H NMR analysis of Man3GlcNAc2–1 oligosaccharide substrates and the product of Man3GlcNAc digestion by the novel human α-mannosidase.
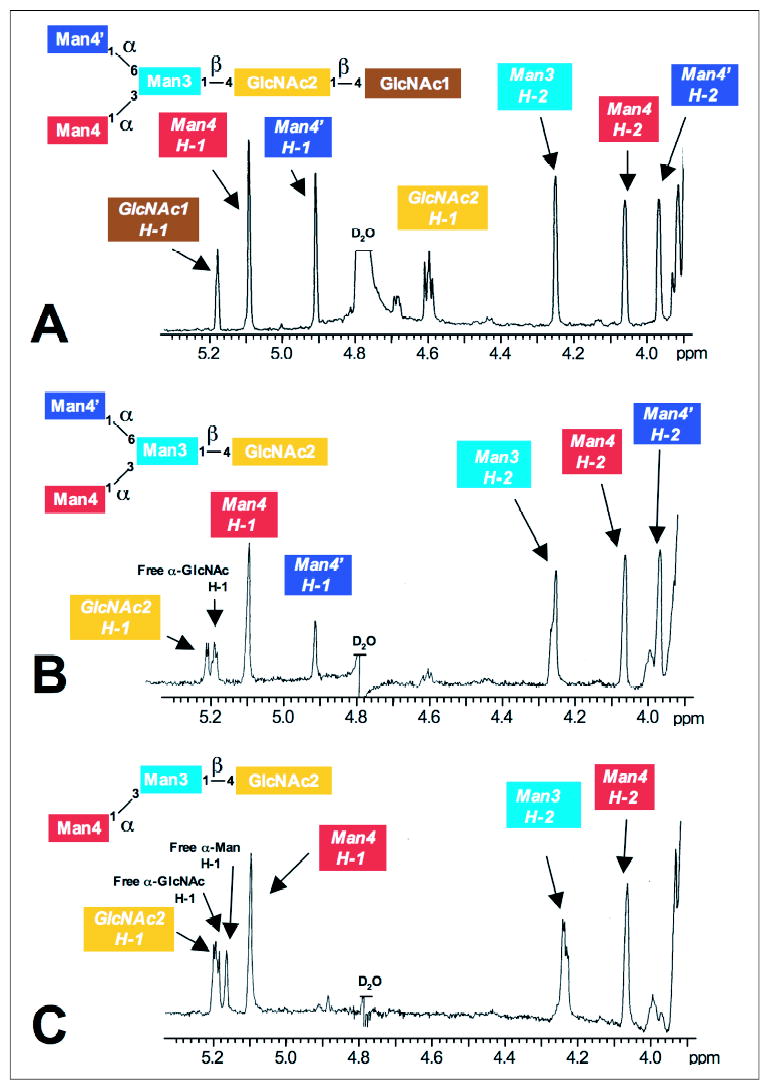
Downfield sections of the one-dimensional 1H NMR spectra are shown for the mannosyl oligosaccharides, Man3GlcNAc2 (A), Man3GlcNAc (following the digestion of Man3GlcNAc2 by chitobiase, B), and Man2GlcNAc (following digestion of Man3GlcNAc by the novel human α-mannosidase, C). The assignments of H-1 and H-2 resonances in the 1H NMR spectra are indicated by the color-coded labels relative to the structures shown at the top of each panel. The spectra of the Man3GlcNAc structure generated by chitobiase digestion (B) indicates a shift of a Glc-NAc H-1 resonance and the generation of a free GlcNAc enzymatic product. Because the resonance at δ = 5.181 ppm for the reducing terminal GlcNAc1 residue in the Man3GlcNAc2 structure (A) and the GlcNAc2 residue in Man3GlcNAc (B) have a similar chemical shift, the loss of the GlcNAc2 signal at δ = 4.591 ppm in Man3GlcNAc2 (compare A and B) and the appearance of the free GlcNAc signal at δ = 5.184 ppm following chitobiase digestion is indicative of the cleavage of GlcNAc1 by the enzyme. Digestion of the Man3GlcNAc structure by the novel human α-mannosidase resulted in the disappearance of the α1– 6Man residue (Man4′ H-1 resonance at δ = 4.902 ppm) and the appearance of a free mannose α-anomer resonance at δ = 5.164 ppm (C). The β-anomer of the monosaccharide product was obscured by the water peak in B and C. The H-2 resonance for Man4′ at δ = 3.976 ppm was also lost from the spectrum in C, but the H-1 and H-2 signals for Man4, Man3, and GlcNAc2 were unchanged, indicating the cleavage of a single mannose residue with the formation of a Manα1–3Manβ1– 4GlcNAc product by the novel human α-mannosidase. The spectrum shown in B was the zero time point for the novel human α-mannosidase time course digestion (Fig. 8) and thus contained the novel human α-mannosidase. As a result there is a slight reduction in the peak signal for the α1– 6-linked Man residue (Man4′) because of a partial digestion of this linkage within the time frame of the experiment (compare A and B).
FIGURE 8. Time course studies for hydrolysis of Man3GlcNAc2 and Man3GlcNAc by the novel human α-mannosidase and human LysMan.
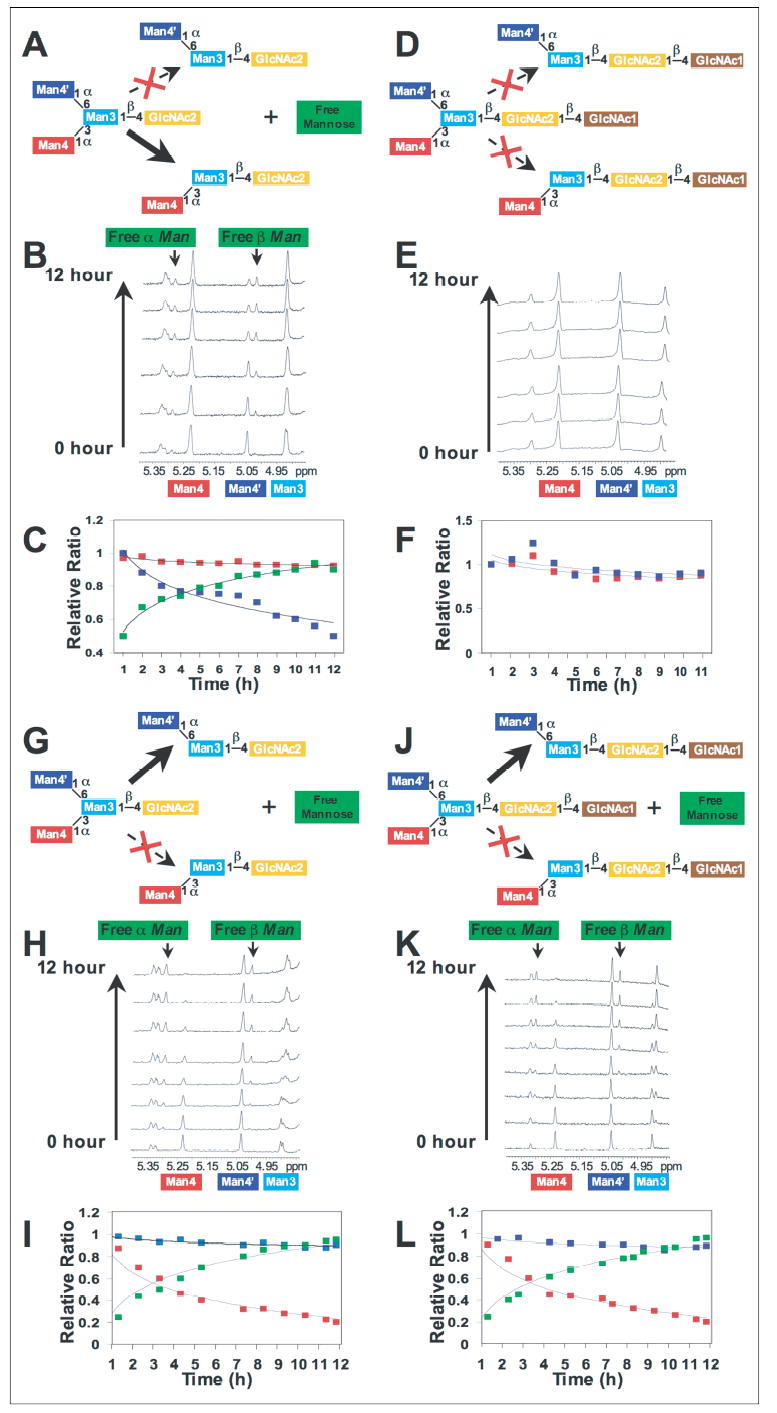
The novel human α-mannosidase was incubated with Man3GlcNAc (A–C) or Man3GlcNAc2 (D–F) for defined time points. Aliquots of the digestion reactions were removed at each time point and prepared for 1H NMR spectroscopy as described under “Experimental Procedures.” 1H NMR spectra of the individual time points are shown in B and E for the digestion of Man3GlcNAc and Man3GlcNAc2, respectively. Quantitation of the peak areas for the resonances of the Man4 and Man4′ residues, as well as the sum of the peak areas for the α- and β-anomers of the released free mannose residue, are indicated in the plots in C and F (Man4 residue, red boxes; Man4′ residue, blue boxes; free mannose, green boxes). The time course data indicated that only the Man4′ residue is cleaved from the Man3GlcNAc substrate by the novel α-mannosidase (A–C), but no significant cleavage of either residue was detected with the Man3GlcNAc2 substrate (D–F). Similar studies were performed with human LysMan (G–L), where digestion of Man3GlcNAc (G–I) or Man3GlcNAc2 (J–L) both resulted in the cleavage of residue Man4 (H and K). No appreciable cleavage of residue Man4′ was detected with either substrate.
Tissue Distribution of mRNA Transcripts Encoding the Human Core-specific α1,6-Mannosidase
Transcript levels for the core-specific α1,6-mannosidase were determined in human tissues by Northern blot analysis. A major transcript of ~4.5 kb was found in all tissues (Fig. 9), consistent with the size of the human GenBankTM reference sequence (GenBankTM accession number NM_015274, 4242 bp), including ~37 bp of 5′-untranslated region, a coding region of 3027 bp, ~1.2-kb 3′-untranslated sequence, and a poly(A) tail. The transcripts encoding human LysMan (12) and the novel human α-mannosidase were similarly expressed in most human tissues, with the exception of brain where human LysMan had lower expression levels and skeletal muscle and kidney where the α1,6-mannosidase had slightly lower transcript levels.
FIGURE 9. Tissue distribution of mRNA transcripts for the human core-specific α1,6-mannosidase and human LysMan.
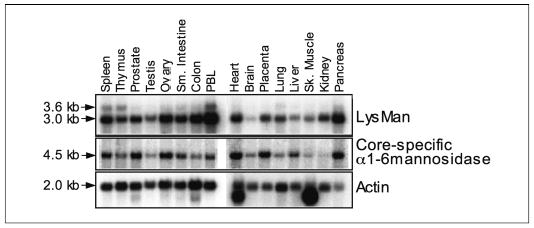
A Northern blot of human tissue poly(A+) RNAs was hybridized with radiolabeled probes from the coding regions of human LysMan (top panel) or human core-specific α1,6-mannosidase (middle panel) as described under “Experimental Procedures.” The blot was rehybridized with β-actin cDNA as a control (bottom panel). Lanes on the blot represent the RNA isolated from the tissues indicated at the top (PBL, peripheral blood leukocytes). The sizes of the transcripts indicated by the arrows were estimated based on the electrophoretic mobility of radiolabeled RNA standards.
Comparison of Core-specific α1,6-Mannosidase and Chitobiase Transcript Expression in Mammalian Species
Previous studies have indicated that the chitobiase and the core-specific α1,6-mannosidase enzyme activities were expressed in a similarly restricted set of mammalian species (21, 22). To determine whether the varied chitobiase and core-specific α1,6-mannosidase enzyme activity levels were also reflected by differences in the respective transcript levels, we examined the relative abundance of expressed sequence tags (ESTs) encoding the enzymes in a collection of mammalian species. cDNA or genomic sequences encoding the human, mouse, cow, dog, and pig versions of the core-specific α1,6-mannosidase, chitobiase, and LysMan sequences were identified by cross-species TBLASTN searches (TABLE THREE). Subsequent searches of species-specific EST databases then revealed the total number ESTs specific for each gene as a surrogate measure of relative transcript abundance in each species (TABLE THREE). The number of α1,6-mannosidase- or chitobiase-specific ESTs were then compared with the number of LysMan-specific ESTs as an internal control, because this latter lysosomal enzyme has been shown to be expressed in each of the respective species (12, 15–18, 21, 22, 54, 59). When the total numbers of EST sequences encoding chitobiase or α1,6-mannosidase were compared with the LysMan-specific ESTs, their abundance was consistently lower in all species. In the dog and pig databases, both chitobiase and α1,6-mannosidase ESTs were present, but their abundance was variable. Pig ESTs encoding the chitobiase were quite numerous (88% relative to LysMan ESTs), whereas the number of α1,6-mannosidase-specific ESTs were rather rare (8% relative to LysMan ESTs). In contrast, dog ESTs encoding the α1,6-mannosidase were numerous (95% relative to LysMan ESTs), whereas the chitobiase ESTs in dog tissues were relatively rare (10% relative to LysMan ESTs). In the bovine EST data base no sequences were detected with identity to either the chitobiase or the α1,6-mannosidase, despite the identification of >70 LysMan-specific EST sequences in this species. Two partial gene sequences with similarity to human α1,6-mannosidase were identified within the incompletely sequenced bovine genome (TABLE THREE), but in neither instance were the ESTs encoded by these genes detected in database searches.
TABLE THREE. Comparison of total number of species-specific ESTs with identity to chitobiase, LysMan, or core-specific α1– 6Mannosidase.
cDNA sequences encoding the respective species-specific orthologs of chitobiase, LysMan, and core-specific α1,6-mannnosidase (core-specific α1–6Man) were identified by TBLASTN sequence searches (46) using the respective protein sequences of the human orthologs for each enzyme as query sequences (GenBankTM accession numbers NP_004379, NP_000519, and NP_056089 for human chitobiase, LysMan, and core-specific α1,6-mannnosidase protein sequences, respectively). The GenBankTM accession numbers for the respective cDNA reference sequences are shown in the “Sequence” column for each enzyme. For pig chitobiase and LysMan, reference sequences were not available, so EST sequences of the corresponding coding regions were used for subsequent analyses. For both bovine chitobiase and core-specific α1,6-mannnosidase, cDNA or EST sequences were not available. In these instances coding region sequences from the corresponding genes were used in subsequent analyses. Two bovine α1,6-mannnosidase gene homologs were identified in the sequence search, and the corresponding accession numbers are shown. BLASTN searches (www.ncbi.nlm.nih.gov/BLAST) were subsequently performed using the respective DNA sequences identified for each coding region against the GenBankTM sequence data base filtered for EST sequences from the respective species. EST sequences with >98% identity over a span of at least 60 bp were scored as positive “hits” for each coding region. The total number of ESTs was tallied and listed in the respective column (total no.). The relative ratio of the ESTs identified for each coding region by comparison to the number of LysMan-specific ESTs for that species was calculated and is shown in parentheses and italics in each column. The total number of EST sequences in GenBankTM for each respective species is as follows: human, 6.1 × 10⁶; mouse, 4.3 × 10⁶; cow, 6.1 × 10⁵; dog, 3.5 × 10⁵; and pig, 4.4 × 10⁵.
| Chitobiase | LysMan | Core-specific α1–6Man | ||||
|---|---|---|---|---|---|---|
| Species | ESTs | Sequence | ESTs | Sequence | ESTs | Sequence |
| total no. (%) | total no. (%) | total no. (%) | ||||
| Human | 116 (23) | NM_004388 | 502 (100) | NM_000528 | 209 (42) | NM_015274 |
| Mouse | 36 (8) | NM_028836 | 436 (100) | NM_010764 | 111 (25) | NM_008550 |
| Cow | 0a | XM_602828 | 74 (100) | NM_174561 | 0a | XM_606608 |
| 0a | XM_601622 | |||||
| Dog | 2 (10) | XM_547309 | 20 (100) | XM_542048 | 19 (95) | XM_545897 |
| Pig | 22 (88) | BX671403 | 25 (100) | BP464100 | 2 (8) | NM_213849 |
No EST sequences were identified in the BLASTN searches of the bovine EST data base for the chitobiase or α1,6-mannnosidase.
Pairwise sequence comparisons between the 5′-flanking sequence of the human α1,6-mannosidase gene and the corresponding flanking sequences of the two putative partial bovine α1,6-mannosidase genes revealed no appreciable sequence similarity (Fig. 10, A and B). A lack of sequence similarity was also revealed in the pairwise comparison of the human and bovine chitobiase genes (Fig. 10C), confirming a divergence in 5′-flanking sequences for this latter gene (27). In contrast, the sequence similarity in the 5′-flanking sequences of the human and bovine LysMan was clearly evident by dot-plot analysis (Fig. 10D). Thus, similar to prior data on the chitobiase (27), alterations in the 5′-flanking sequence of the bovine α1,6-mannosidase genes relative to the corresponding human gene may account for the loss of α1,6-mannosidase transcripts and enzyme activity.
FIGURE 10. Dot-plot analysis comparing the 5′-flanking sequences and partial coding regions for human and bovine core-specific α1,6-mannosidase, chitobiase, and LysMan.
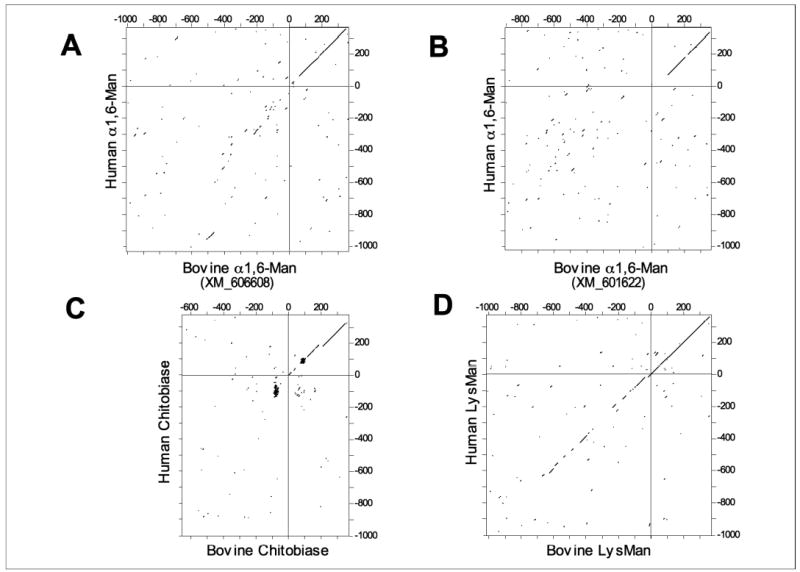
Two partial bovine gene homologs encoding the core-specific α1,6-mannosidase were identified by BLAST searches of bovine genomic sequences in the GenBankTM sequence database (accession numbers XM_606608 and XM_601622). Sequences corresponding to the first 375 bp of the respective enzyme coding regions (numbering starting at 1 with the ATG translation start site) and as much as 1 kb of 5′-flanking sequence (negative numbering relative to the translation start site) were identified for the human and bovine LysMan (1 kb of 5′-flanking sequence for each; D), human and bovine chitobiase (1 kb and 660 bp, respectively, for each; C), and the human and two bovine core-specific α1,6-mannosidase homologs (1 kb each for human and bovine (GenBankTM accession numbers XM_606608) homolog sequences, A; and 910 bp for the bovine (GenBankTM accession number XM_601622) homolog sequence; B). Pairwise sequence comparisons of the corresponding bovine and human homologs for each gene were performed and displayed as a dot-plot diagram, where each dot in the corresponding two-dimensional plot indicates a sequence identity of at least 14 residues over a sliding window of 21 residues (see “Experimental Procedures”). A diagonal line indicates an extended sequence similarity between the two sequences. In each plot, the upper right quadrant corresponds to the first 375 bp of the respective coding region. The lower left quadrant corresponds to the respective 5′-flanking regions. An extended diagonal line is detected in the upper right quadrant in each plot, but only the dot-plot corresponding to a comparison of the bovine and human LysMan sequences contains an extended diagonal line into the lower left quadrant, indicating an extended sequence similarity in the 5′-flanking sequences for these two sequence homologs.
DISCUSSION
The catabolism of N-glycosylated proteins in mammalian lysosomes occurs through a bidirectional process (28). Polypeptides are digested by lysosomal proteases, and the associated N-glycans are released from Asn side chains at their reducing termini by glycosylasparaginase action. Cleavage from the nonreducing termini of complex type and oligomannose glycans proceeds through the action of glycone- and linkage-specific exoglycosidases leading to the formation of a Man3GlcNAc2 core structure that must be further degraded to monosaccharides in lysosomes. Catabolism of this core structure appears to be handled differently in some mammals (i.e. humans and mice) versus others (ungulates and carnivora) (21, 22). In the former species, further glycan catabolism requires a complex interplay between cleavage at the reducing and non-reducing termini of the Manα1–3[Manα1–6]Manβ1–4GlcNAcβ1–4GlcNAc structure (21, 28). Removal of a single GlcNAc residue from the reducing terminus by chitobiase is a prerequisite for efficient trimming of the nonreducing terminal α1–6Man branch by α1,6-mannosidase (Figs. 7, 8, and 11) (26). However, the nonreducing terminal α1–3Man branch can be cleaved from either Man3GlcNAc2 or Man3GlcNAc structures by LysMan (Figs. 8 and 11) (10). In contrast, ungulates and carnivora do not contain detectable chitobiase activity and thus presumably cleave their respective glycans exclusively from the nonreducing terminus by exoglycosidase action (21, 22, 28). In these latter species it is not clear how the cleavage of the α1–6Man linkage is accomplished in the absence of α1,6-mannosidase action, because Lys-Man cleaves this linkage quite inefficiently (Fig. 8) (10), even in cats and cows (11).
FIGURE 11. Schematic diagram for the lysosomal degradation of Man3GlcNAc2-Asn glycans.
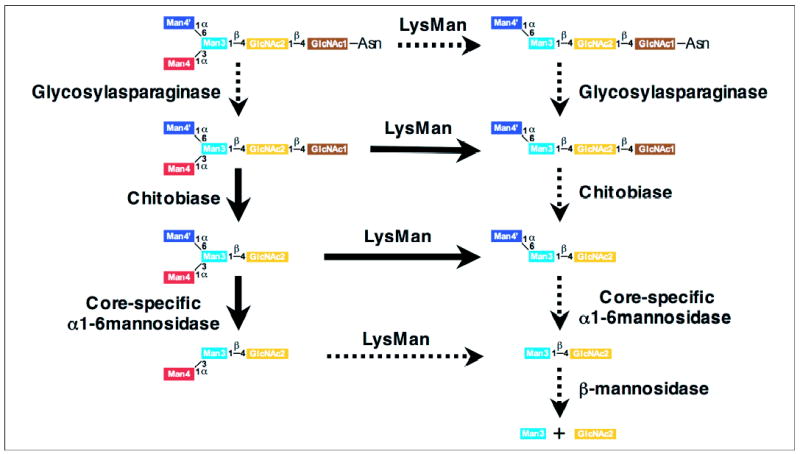
Arrows in the diagram indicate the catabolic pathway for degradation of Man3GlcNAc2-Asn by glycosylasparaginase, chitobiase, LysMan, core-specific α1,6-mannosidase, and β-mannosidase (26). The ability of LysMan to cleave the α1–3Man is not influenced by the reducing terminal glycan structure based on the known substrate specificity for the enzyme (10, 11), but the core-specific α1,6-mannosidase can act only after chitobiase action (26). The bold solid arrows in the diagram indicate the reactions that were demonstrated in this study. The dotted arrows indicate reactions that were not tested here but have been demonstrated in the literature (10, 11, 21, 28), including prior data indicating that the core-specific α1,6-mannosidase can cleave the α1– 6Man linkage in Manα1–3Manβ1– 4GlcNAc (21, 25, 26).
Identification of the cDNA or gene encoding the α1,6-mannosidase had been hampered previously by difficulties in enzyme purification from crude tissue or membrane extracts and the complexity of assaying the enzyme with small oligosaccharide substrates (24, 25). We decided to take an alternative approach for the identification of the cDNA encoding the α1,6-mannosidase. The characteristics of the core-specific α1,6-mannosidase from lysosomal membrane extracts were similar in several respects to other GH38 enzymes, including pH optimum, response to inhibitors, large size, stimulation by divalent cations, and the ability to cleave α1–6Man linkages (2, 24, 25). Among the various GH38 sequences from vertebrate and nonvertebrate sources, four subgroups were detected by phylogenetic analysis (Fig. 1). Members of three of those subgroups (Golgi α-mannosidase II subgroup, LysMan subgroup, and ER/cytosolic α-mannosidase subgroup) had well defined functions in glycan biosynthesis or catabolism (2). The fourth subgroup containing the novel α-mannosidase studied here was uniquely restricted to vertebrates, and none of the known members of this latter group had been expressed or characterized for detailed oligosaccharide substrate specificity. As candidates for the α1,6-mannosidase activity, we chose to clone, express, purify, and characterize the human member of this subgroup and to compare its substrate specificity with the well characterized human LysMan, which we had cloned and expressed previously (12). Consistent with the hypothesis that members of this subgroup exhibit core-specific α1,6-mannosidase activity, all of the characteristics of the recombinant enzyme, including low pH optimum, potent sensitivity to SW and DIM, high Km values for the 4MU-Man substrate, stimulation by Co2+ and Zn2+, and cleavage of the α1–6Man linkage in a Man3GlcNAc substrate were in agreement with prior data for the partially purified α1,6-mannosidase (24–26).
Although prior data on the substrate specificity of the purified porcine epididymal ortholog of the novel human α-mannosidase detected weak cleavage of Man8GlcNA2-PA to Man6GlcNA2-PA (29), our data on the recombinant α-mannosidase showed no detectable cleavage of larger PA-tagged N-glycans except for a weak activity toward Man5GlcNA2-PA. Incomplete cleavage of the glycan and insufficient quantities of the Man5GlcNA2-PA substrate precluded the further characterization of this enzymatic product. However, high activity was found for the cleavage of the α1–6Man linkage on a Man3GlcNAc substrate as characterized by 1H NMR time course studies. The rate of cleavage of this substrate was comparable with the rate of cleavage of the α1–3Man linkage in the same substrate by LysMan. The low pH optimum and the prior data demonstrating the lysosomal localization for the core-specific α1,6-mannosidase (21, 22, 24–26) indicate that the human α1,6-mannosidase characterized here is involved in lysosomal N-glycan catabolism. The absence of any detectable activity toward Man3GlcNAc2 substrates or larger high mannose substrates would likely preclude a role for this enzyme in the modification of sperm-surface glycoproteins in the epididymis or testis as originally proposed for the porcine and murine forms of the enzyme (29, 31).
Prior data on the mouse and pig orthologs of the α1,6-mannosidase indicated a tissue-restricted transcript expression pattern. The enzyme was initially isolated from porcine caudal epididymal fluid, and Northern blots indicated transcript expression restricted to the border of the caput and corpus epididymis (29). Mouse transcripts encoding the enzyme were found exclusively in type A spermatogonia at stages IX–XI of spermatogenesis (31). In contrast, subsequent studies have shown that transcripts encoding the murine ortholog of the α1,6-mannosidase are not restricted to reproductive tissues, but they are ubiquitously expressed (32), consistent with our present data demonstrating a ubiquitous expression of transcripts encoding the human enzyme (Fig. 9). A broadly distributed transcript expression profile for the core-specific α1,6-mannosidase is also supported by the identification of numerous ESTs encoding the α1,6-mannosidase from a wide variety of mammalian tissues and cells (TABLE THREE).
Analysis of transcript expression levels based on species-specific EST searches indicated the greatest relative abundance for chitobiase ESTs was in pig tissues, followed in descending relative abundance by ESTs from human, dog, and mouse tissues and cells. No ESTs were detected from bovine tissue sources. This distribution of ESTs was unexpected, because chitobiase catalytic activity was not detected in pig tissues in previous studies (28). In contrast, the relative abundance of α1,6-mannosidase-specific ESTs was greatest in the dog tissues, whereas numerous ESTs were also identified in the human and mouse EST database. Low EST abundance was found in pig tissues, but similar to chitobiase, no ESTs were detectable in the bovine database. Again these EST abundance data were unexpected because the low frequency of α1,6-mannosidase-specific ESTs in pig tissues contrasts with the initial identification of the α1,6-mannosidase as an epididymal α-mannosidase in this species (29). The relatively lower number of total ESTs in the cow, pig, and dog databases (>8-fold smaller than the human or mouse EST databases) may result in some bias in the detection of the gene-specific ESTs. However, these data strongly indicate that transcript abundance for the chitobiase does not directly parallel the levels of enzyme activity detected in tissue extracts from the respective species (28). Thus, in pigs and dogs the absence of chitobiase enzyme activity is contrasted with numerous ESTs encoding the enzyme in the respective databases. Although it is reasonable to expect that transcript levels will generally reflect the levels of enzyme activity in the respective species and tissues, we cannot rule out additional controls of enzyme activity at the translational and posttranslational levels. In contrast, the data suggest that the lack of ESTs encoding chitobiase and α1,6-mannosidase in bovine tissues likely results from the loss of conserved 5′-flanking sequences that may result in the loss of promoter elements and defective transcription (27).
The dependence of α1,6-mannosidase catalytic activity on prior action by chitobiase suggests that there is a functional cooperation between these two enzymes for the full and efficient catabolism of the N-glycan core structures in mammalian lysosomes (21, 22). The common occurrence of both catalytic activities in a similar collection of mammalian species correlates with the glycan structures that accumulate in corresponding mammalian α-mannosidosis models (21, 22). Human and rodent species predominantly accumulate structures based on a core Manα1–3Manβ1–4GlcNAc structure as a result of the presence of both lysosomal chitobiase and α1,6-mannosidase. Bovine and feline α-mannosidosis models accumulate structures based on the Manα1–3[Manα1–6]Manβ1–4GlcNAc2 core structure as a result of an absence of these latter enzymes. Thus, despite the fact that the genes encoding both enzymes appear to be present in all mammals that have been examined, the benefit of the “accessory” hydrolase functions of the chitobiase and α1,6-mannosidase are achieved only in a restricted subset of mammalian species. The mechanism by which these enzymes were initially recruited for glycan catabolism, maintained through vertebrate evolution, and selectively lost in distinctive subsets of mammalian species will be an area of continuing study.
Acknowledgments
We thank Dr. Nathan Aronson (University of South Alabama) for the kind gift of recombinant human chitobiase and Dr. Lance Wells for assistance in performing the liquid chromatography/tandem mass spectrometry sequencing analysis of the recombinant proteins.
Footnotes
This work was supported by National Institutes of Health Research Grants GM47533, CA91295, and RR05351 (to K. W. M.).
The abbreviations used are: LysMan, lysosomal mannosidase; ER, endoplasmic reticulum; SW, swainsonine; DIM, 1,4-dideoxy-1,4-imino-d-mannitol; 4MU, 4-methylumbelliferyl-; NMR, nuclear magnetic resonance; HPLC, high performance liquid chromatography; GH, glycosylhydrolase; EST, expressed sequence tag; HA, hemagglutinin; PA, pyridylamine.
References
- 1.Moremen KW, Trimble RB, Herscovics A. Glycobiology. 1994;4:113–125. doi: 10.1093/glycob/4.2.113. [DOI] [PubMed] [Google Scholar]
- 2.Moremen, K. (2000) in Oligosaccharides in Chemistry and Biology: A Comprehensive Handbook (Ernst, B., Hart, G., and Sinay, P., eds) Vol. II, pp. 81–117, John Wiley & Sons, Inc., New York
- 3.Henrissat B. Biochem J. 1991;280:309–316. doi: 10.1042/bj2800309. [DOI] [PMC free article] [PubMed] [Google Scholar]
- 4.Henrissat B. Biochem Soc Trans. 1998;26:153–156. doi: 10.1042/bst0260153. [DOI] [PubMed] [Google Scholar]
- 5.Henrissat B, Bairoch A. Biochem J. 1993;293:781–788. doi: 10.1042/bj2930781. [DOI] [PMC free article] [PubMed] [Google Scholar]
- 6.Henrissat B, Bairoch A. Biochem J. 1996;316:695–696. doi: 10.1042/bj3160695. [DOI] [PMC free article] [PubMed] [Google Scholar]
- 7.Henrissat B, Davies G. Curr Opin Struct Biol. 1997;7:637–644. doi: 10.1016/s0959-440x(97)80072-3. [DOI] [PubMed] [Google Scholar]
- 8.Helenius A, Aebi M. Annu Rev Biochem. 2004;73:1019–1049. doi: 10.1146/annurev.biochem.73.011303.073752. [DOI] [PubMed] [Google Scholar]
- 9.Moremen KW. Biochim Biophys Acta. 2002;1573:225–235. doi: 10.1016/s0304-4165(02)00388-4. [DOI] [PubMed] [Google Scholar]
- 10.al Daher S, de Gasperi R, Daniel P, Hall N, Warren CD, Winchester B. Biochem J. 1991;277:743–751. doi: 10.1042/bj2770743. [DOI] [PMC free article] [PubMed] [Google Scholar]
- 11.DeGasperi R, al Daher S, Daniel PF, Winchester BG, Jeanloz RW, Warren CD. J Biol Chem. 1991;266:16556–16563. [PubMed] [Google Scholar]
- 12.Liao YF, Lal A, Moremen KW. J Biol Chem. 1996;271:28348–28358. doi: 10.1074/jbc.271.45.28348. [DOI] [PubMed] [Google Scholar]
- 13.Carroll M, Dance N, Masson PK, Robinson D, Winchester BG. Biochem Biophys Res Commun. 1972;49:579–583. doi: 10.1016/0006-291x(72)90450-0. [DOI] [PubMed] [Google Scholar]
- 14.Sun H, Wolfe JH. Exp Mol Med. 2001;33:1–7. doi: 10.1038/emm.2001.1. [DOI] [PubMed] [Google Scholar]
- 15.Hocking JD, Jolly RD, Batt RD. Biochem J. 1972;128:69–78. doi: 10.1042/bj1280069. [DOI] [PMC free article] [PubMed] [Google Scholar]
- 16.Burditt LJ, Chotai K, Hirani S, Nugent PG, Winchester BG, Blakemore WF. Biochem J. 1980;189:467–473. doi: 10.1042/bj1890467. [DOI] [PMC free article] [PubMed] [Google Scholar]
- 17.Berg T, Tollersrud OK, Walkley SU, Siegel D, Nilssen O. Biochem J. 1997;328:863–870. doi: 10.1042/bj3280863. [DOI] [PMC free article] [PubMed] [Google Scholar]
- 18.Stinchi S, Lullmann-Rauch R, Hartmann D, Coenen R, Beccari T, Orlacchio A, von Figura K, Saftig P. Hum Mol Genet. 1999;8:1365–1372. doi: 10.1093/hmg/8.8.1365. [DOI] [PubMed] [Google Scholar]
- 19.Crawley AC, Jones MZ, Bonning LE, Finnie JW, Hopwood JJ. Pediatr Res. 1999;46:501–509. doi: 10.1203/00006450-199911000-00003. [DOI] [PubMed] [Google Scholar]
- 20.Yamashita K, Tachibana Y, Mihara K, Okada S, Yabuuchi H, Kobata A. J Biol Chem. 1980;255:5126–5133. [PubMed] [Google Scholar]
- 21.Daniel PF, Winchester B, Warren CD. Glycobiology. 1994;4:551–566. doi: 10.1093/glycob/4.5.551. [DOI] [PubMed] [Google Scholar]
- 22.Winchester B. Glycobiology. 2005;15:R1–R15. [Google Scholar]
- 23.Abraham D, Blakemore WF, Jolly RD, Sidebotham R, Winchester B. Biochem J. 1983;215:573–579. doi: 10.1042/bj2150573. [DOI] [PMC free article] [PubMed] [Google Scholar]
- 24.Daniel PF, Evans JE, De Gasperi R, Winchester B, Warren CD. Glycobiology. 1992;2:327–336. doi: 10.1093/glycob/2.4.327. [DOI] [PubMed] [Google Scholar]
- 25.De Gasperi R, Daniel PF, Warren CD. J Biol Chem. 1992;267:9706–9712. [PubMed] [Google Scholar]
- 26.Haeuw JF, Grard T, Alonso C, Strecker G, Michalski JC. Biochem J. 1994;297:463–466. doi: 10.1042/bj2970463. [DOI] [PMC free article] [PubMed] [Google Scholar]
- 27.Liu B, Ahmad W, Aronson NN., Jr Glycobiology. 1999;9:589–593. doi: 10.1093/glycob/9.6.589. [DOI] [PubMed] [Google Scholar]
- 28.Aronson NN, Jr, Kuranda MJ. FASEB J. 1989;3:2615–2622. doi: 10.1096/fasebj.3.14.2531691. [DOI] [PubMed] [Google Scholar]
- 29.Okamura N, Tamba M, Liao HJ, Onoe S, Sugita Y, Dacheux F, Dacheux JL. Mol Reprod Dev. 1995;42:141–148. doi: 10.1002/mrd.1080420203. [DOI] [PubMed] [Google Scholar]
- 30.Okamura N, Dacheux F, Venien A, Onoe S, Huet JC, Dacheux JL. Biol Reprod. 1992;47:1040–1052. doi: 10.1095/biolreprod47.6.1040. [DOI] [PubMed] [Google Scholar]
- 31.Hiramoto S, Tamba M, Kiuchi S, Jin YZ, Bannai S, Sugita Y, Dacheux F, Dacheux JL, Yoshida M, Okamura N. Biochem Biophys Res Commun. 1997;241:439–445. doi: 10.1006/bbrc.1997.7768. [DOI] [PubMed] [Google Scholar]
- 32.Tascou S, Nayernia K, Engel W, Burfeind P. Biochem Biophys Res Commun. 2000;272:951–952. doi: 10.1006/bbrc.2000.2868. [DOI] [PubMed] [Google Scholar]
- 33.Field J, Nikawa J, Broek D, MacDonald B, Rodgers L, Wilson IA, Lerner RA, Wigler M. Mol Cell Biol. 1988;8:2159–2165. doi: 10.1128/mcb.8.5.2159. [DOI] [PMC free article] [PubMed] [Google Scholar]
- 34.Wu Y, Swulius MT, Moremen KW, Sifers RN. Proc Natl Acad Sci U S A. 2003;100:8229–8234. doi: 10.1073/pnas.1430537100. [DOI] [PMC free article] [PubMed] [Google Scholar]
- 35.Wilkinson, J. M. (1986) in Practical Protein Chemistry: A Handbook (Darbre, A., ed) pp. 121–148, Plenum Press, New York
- 36.Gharahdaghi F, Weinberg CR, Meagher DA, Imai BS, Mische SM. Electrophoresis. 1999;20:601–605. doi: 10.1002/(SICI)1522-2683(19990301)20:3<601::AID-ELPS601>3.0.CO;2-6. [DOI] [PubMed] [Google Scholar]
- 37.Ducret A, Van Oostveen I, Eng JK, Yates JR, III, Aebersold R. Protein Sci. 1998;7:706–719. doi: 10.1002/pro.5560070320. [DOI] [PMC free article] [PubMed] [Google Scholar]
- 38.Moremen KW, Robbins PW. J Cell Biol. 1991;115:1521–1534. doi: 10.1083/jcb.115.6.1521. [DOI] [PMC free article] [PubMed] [Google Scholar]
- 39.Li B, Kawatkar SP, George S, Strachan H, Woods RJ, Siriwardena A, More-men KW, Boons GJ. Chembiochem. 2004;5:1220–1227. doi: 10.1002/cbic.200300842. [DOI] [PubMed] [Google Scholar]
- 40.Siriwardena A, Strachan H, El-Daher S, Way G, Winchester B, Glushka J, Moremen K, Boons GJ. Chembiochem. 2005;6:845–848. doi: 10.1002/cbic.200400397. [DOI] [PubMed] [Google Scholar]
- 41.Segel, I. (1975) Enzyme Kinetics: Behavior and Analysis of Rapid Equilibrium and Steady-state Enzyme Systems, John Wiley & Sons, Inc., New York
- 42.McIlvaine TC. J Biol Chem. 1921;49:183–186. [Google Scholar]
- 43.Karaveg K, Moremen KW. J Biol Chem. 2005;280:29837–29848. doi: 10.1074/jbc.M505130200. [DOI] [PubMed] [Google Scholar]
- 44.Karaveg K, Siriwardena A, Tempel W, Liu ZJ, Glushka J, Wang BC, Moremen KW. J Biol Chem. 2005;280:16197–16207. doi: 10.1074/jbc.M500119200. [DOI] [PubMed] [Google Scholar]
- 45.Lal A, Pang P, Kalelkar S, Romero PA, Herscovics A, Moremen KW. Glycobiology. 1998;8:981–995. doi: 10.1093/glycob/8.10.981. [DOI] [PubMed] [Google Scholar]
- 46.Altschul SF, Madden TL, Schaffer AA, Zhang J, Zhang Z, Miller W, Lipman DJ. Nucleic Acids Res. 1997;25:3389–3402. doi: 10.1093/nar/25.17.3389. [DOI] [PMC free article] [PubMed] [Google Scholar]
- 47.Bateman A, Birney E, Cerruti L, Durbin R, Etwiller L, Eddy SR, Griffiths-Jones S, Howe KL, Marshall M, Sonnhammer EL. Nucleic Acids Res. 2002;30:276–280. doi: 10.1093/nar/30.1.276. [DOI] [PMC free article] [PubMed] [Google Scholar]
- 48.Thompson JD, Higgins DG, Gibson TJ. Nucleic Acids Res. 1994;22:4673–4680. doi: 10.1093/nar/22.22.4673. [DOI] [PMC free article] [PubMed] [Google Scholar]
- 49.Page RD. Comput Appl Biosci. 1996;12:357–358. doi: 10.1093/bioinformatics/12.4.357. [DOI] [PubMed] [Google Scholar]
- 50.Maizel JV, Jr, Lenk RP. Proc Natl Acad Sci U S A. 1981;78:7665–7669. doi: 10.1073/pnas.78.12.7665. [DOI] [PMC free article] [PubMed] [Google Scholar]
- 51.Moremen KW, Touster O, Robbins PW. J Biol Chem. 1991;266:16876–16885. [PubMed] [Google Scholar]
- 52.Misago M, Liao YF, Kudo S, Eto S, Mattei MG, Moremen KW, Fukuda MN. Proc Natl Acad Sci U S A. 1995;92:11766–11770. doi: 10.1073/pnas.92.25.11766. [DOI] [PMC free article] [PubMed] [Google Scholar]
- 53.Nilssen O, Berg T, Riise HM, Ramachandran U, Evjen G, Hansen GM, Malm D, Tranebjaerg L, Tollersrud OK. Hum Mol Genet. 1997;6:717–726. doi: 10.1093/hmg/6.5.717. [DOI] [PubMed] [Google Scholar]
- 54.Merkle RK, Zhang Y, Ruest PJ, Lal A, Liao YF, Moremen KW. Biochim Biophys Acta. 1997;1336:132–146. doi: 10.1016/s0304-4165(97)00023-8. [DOI] [PubMed] [Google Scholar]
- 55.Cacan R, Duvet S, Kmiecik D, Labiau O, Mir AM, Verbert A. Biochimie (Paris) 1998;80:59–68. doi: 10.1016/s0300-9084(98)80057-6. [DOI] [PubMed] [Google Scholar]
- 56.Heikinheimo P, Helland R, Leiros HK, Leiros I, Karlsen S, Evjen G, Ravelli R, Schoehn G, Ruigrok R, Tollersrud OK, McSweeney S, Hough E. J Mol Biol. 2003;327:631–644. doi: 10.1016/s0022-2836(03)00172-4. [DOI] [PubMed] [Google Scholar]
- 57.van den Elsen JM, Kuntz DA, Rose DR. EMBO J. 2001;20:3008–3017. doi: 10.1093/emboj/20.12.3008. [DOI] [PMC free article] [PubMed] [Google Scholar]
- 58.Michalski JC, Haeuw JF, Wieruszeski JM, Montreuil J, Strecker G. Eur J Biochem. 1990;189:369–379. doi: 10.1111/j.1432-1033.1990.tb15498.x. [DOI] [PubMed] [Google Scholar]
- 59.Riise HM, Berg T, Nilssen O, Romeo G, Tollersrud OK, Ceccherini I. Genomics. 1997;42:200–207. doi: 10.1006/geno.1997.4668. [DOI] [PubMed] [Google Scholar]
- 60.Berg T, King B, Meikle PJ, Nilssen O, Tollersrud OK, Hopwood JJ. Mol Genet Metab. 2001;73:18–29. doi: 10.1006/mgme.2001.3173. [DOI] [PubMed] [Google Scholar]