
Fig. 4.
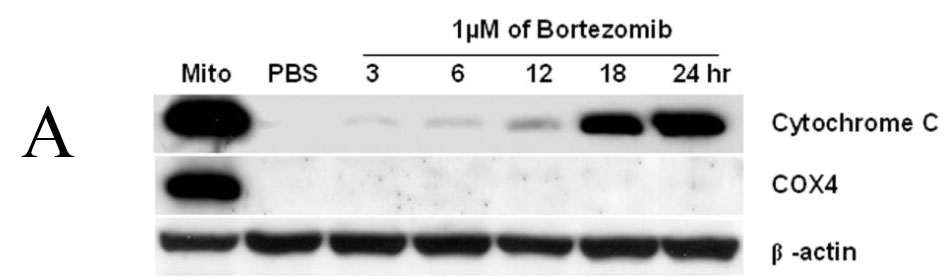

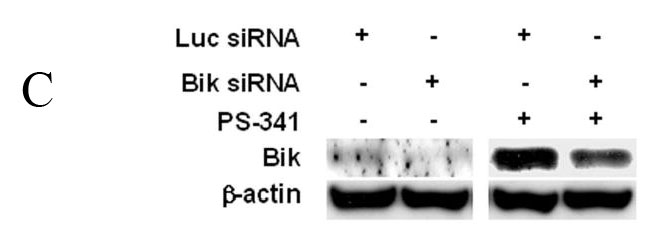

Bortezomib-induced apoptosis in DLD1 cells. (A) and (B) Apoptosis induction. Cells were treated with 1 μM bortezomib for 3–24 hours. Cell lysates were then analyzed by Western blotting. Mito, mitochondria control. Data represent one of two independent experiments with similar results. (C) Bik/NBK levels after treatment with siRNA ± bortezomib. (D) Bortezomib-mediated cell killing. Cells were pretreated with PBS, luciferase siRNA or Bik/NBK siRNA for 24 h and then treated with 1 μM bortezomib for another 24 h. Cell viability was determined in quadruplet and was normalized with cells treated with PBS alone, which was arbitrarily set as 1. Each value represents the mean +SD. * indicates p <0.01.