

Abstract
People differ in the extent to which their verbal reports of experienced emotion are valence focused or arousal focused. Three multimethod studies are reported to explore whether differential focus reflects individual differences in the cognitive structure of emotion language versus differences in phenomenological experience. Although there was some evidence that valence focus and arousal focus were linked to variations differences in cognitive structure, the findings are also consistent with the view that self-report ratings are being driven by the properties of the feelings that are being reported. Implications for the study of experienced emotion are discussed.
People report how they feel using words. In everyday life, when we want to know how someone is feeling, we ask. “How are you feeling?” is one of the most ubiquitous questions in our culture. Likewise, for over half a century, psychologists have relied on self-reports to find out how people feel, and for good reason. Decades of behavioral, cognitive, and psychophysiological research have failed to provide clear and consistent measures that unambiguously correspond to the categories of experienced emotion that are found in Western cultures (e.g., anger, sadness, fear): There are neither distinct autonomic footprints for categories of emotion (Cacioppo, Berntson, Larsen, Poehlmann, & Ito, 2000) nor direct connections between the experience of these emotions and facial movements that are perceived as coordinated “expressions” (Russell, Bachorowski, & Fernández-Dols, 2003).1 As a result, there is no known objective, external measure of the subjective, internal events that we experience as anger, sadness, fear, and so on. If we want to know whether people feel these emotions, we have to ask them.
When self-reports are treated as verbal behaviors that can be observed and studied, people use the same emotion words in very different ways to communicate their feelings. For example, the word tired, which is generally understood to refer to a state that is unpleasant and low in arousal, can be used to communicate a feeling of sleepiness (emphasizing the low arousal property), annoyance and misery (as in “I am tired of this,” emphasizing the unpleasantness), or fatigued (emphasizing both low arousal and displeasure properties). A key question facing researchers is whether differences in self-report ratings of experienced emotion reflect differences in actual feelings or merely reflect differences in the way that people understand the words that are used in the rating process. One way to address the question of whether self-reports reflect feelings or language is to examine the granularity in such reports. When asked to report how they feel, some individuals represent their experiences with a good deal of precision (high granularity), whereas others represent their experiences in more global terms (low granularity, primarily in terms of pleasure or displeasure). This article examines whether the granularity of self-reports reflects differential attention to feelings or whether they merely reflect differential attention to the properties of words. In doing so, it addresses the question of whether the contents of self-reports of emotional experience are driven by individual differences in language or in feelings.
Mapping the Contents of Verbal Reports: Variations in the Relatedness of Emotional Experiences
In previous research, we have found that people vary greatly in how they distinguish emotions when reporting their experience of them in a natural environment (Feldman, 1995a; Feldman Barrett, 1998; Feldman Barrett, Gross, Christensen, & Benvenuto, 2001). In these studies, participants received a set of emotion-related adjectives (happy, anxious, annoyed, etc.) at each measurement instance and rated, on a Likert scale, how closely each adjective described their emotional state at that moment. These ratings were then used to calculate the relatedness between emotional states for each person separately. Some individuals had strong correlations between feeling states of the same valence, so that when they reported feeling sadness, for example, they also reported feeling anxious and angry. These individuals are low in emotional granularity: They reported their experience in global terms, using discrete emotion labels to communicate only the most general of information (typically pleasure and displeasure). Other individuals had weaker correlations between emotional states of the same valence, indicating that they made finer distinctions in their experiences. These individuals are higher in emotional granularity and reported their emotional experience in more precise, differentiated terms, using discrete emotion labels such as happy, sad, angry, and so forth, in a way that captured the distinctiveness in these words.
The Circumplex
Differences in emotional granularity can be depicted in geometric space. Because reports of emotional experiences are heterogeneous (i.e., contain multiple properties), they can be represented in a circular relationship, forming a structure called a circumplex (Guttman, 1957). The shape of a person’s circumplex structure represents the amount of granularity in his or her emotion reports. Specifically, proximity around the perimeter of the structure reflects the similarity between emotion reports. For example, Figure 1a might be the configuration that results when one person’s correlation matrix (containing self-reports of experienced emotion) is projected into geometric space. The similarity between emotion reports is determined solely by their position in the circle—this similarity might be due to two properties, or three, or even fourthe point is there is more than one property. As a result, the relative positions of adjectives reflect qualitative differences in how the adjectives are used rather than quantitative differences along any one dimension (Guttman, 1957). When reports of two emotions are relatively close over time (e.g., happy and satisfied), then they can be thought of as forming a domain of experience, or a local region of homogeneity. Obviously, as the minimal arc distance between reports of two emotions increases (e.g., happy and enthusiastic), the degree of similarity decreases (i.e., the correlation becomes smaller), suggesting that the emotions are reported as qualitatively different. When emotions are separated by an arc distance of 90° (e.g., happy and surprised), the reports are completely independent. When the arc distance increases to 180° (e.g., happy and sad), the reports represent opposite emotional experiences. Past 180°, the reports become increasingly similar again until the original starting point is reached.
Figure 1.
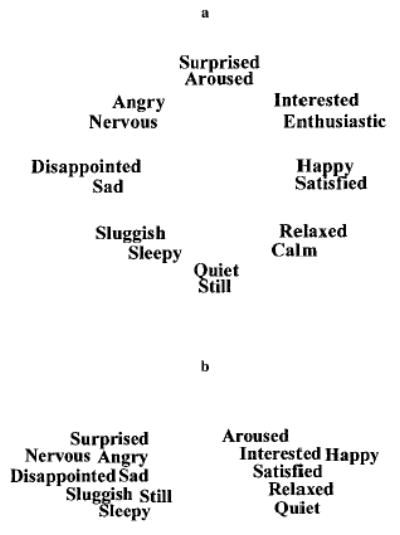
Illustrative representation of a prototypical (a) and nonproto-typical (b) circumplex structure.
People who are high in emotional granularity produce a circumplex structure like that depicted in Figure 1a (for an example of actual data, see Figure 2a). These individuals use emotion adjectives to represent many distinct regions of experience. Their self-report ratings produce a correlation matrix that yields a prototypical circumplex structure with a uniform, symmetrical structure that is circular in nature, depicting smaller regions of homogeneity and more precise domains of experience. A circumplex structure need not be perfectly circular with equally spaced elements (for a discussion, see Browne, 1992; Fabrigar, Visser, & Browne, 1997), however. As such, people who are lower in emotional granularity produce a structure that is flatter, more elliptical in shape, reflecting fewer regions of homogeneity and correspondingly fewer domains of experience (see Figure 1b and Figure 2b). These individuals are using the same emotion adjectives to report their experience as are those higher in emotional granularity, but they use these terms to represent many fewer regions of distinctiveness.
Figure 2.
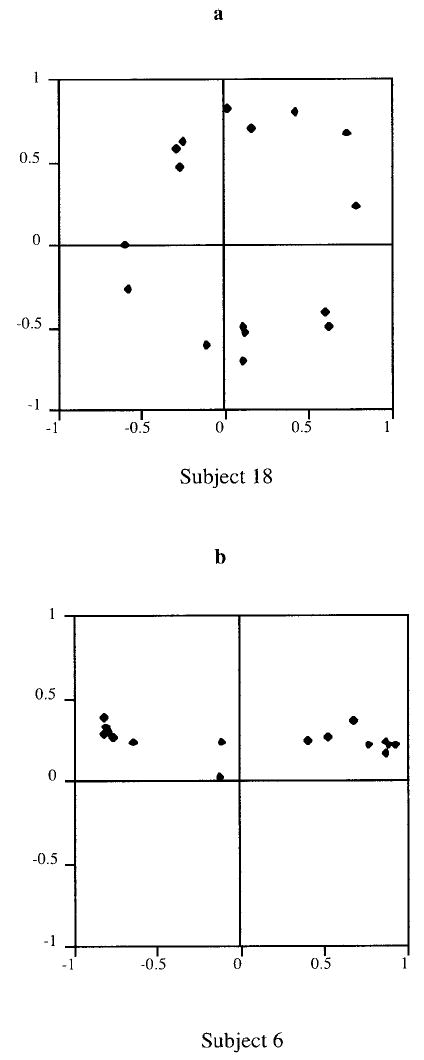
Examples of idiographically derived circular structures. Adapted from “Valence Focus and Arousal Focus: Individual Differences in the Structure of Affective Experience,” by L. A. Feldman, 1995, Journal of Personality and Social Psychology, 69, p. 160. Copyright 1995 by the American Psychological Association.
The description of these domains, and the properties of experiences that characterize them, cannot be determined by examining the circular ordering alone. The circumplex, as Guttman (1957) conceived it, was defined solely in terms of ordinal relationships and so, alone, does not allow a quantitative analysis of emotional experiences—it merely depicts their nonparametric relatedness in geometric space. From an ordinal standpoint, the similarities depicted in the circumplexes presented in Figure 2 are nearly identical (for a discussion, see Shepard, 1978, pp. 50–52). This means that differences in granularity (or in the number of experiential domains) can be depicted but not quantified using a circumplex alone. To understand what domains of experience are being represented, the descriptive content of people’s self-reports of experienced emotion must be quantified. This is achieved by embedding the circumplex within a Euclidean space of two dimensions (Shepard, 1978).
Quantifying the Contents of Verbal Reports: Valence Focus and Arousal Focus
I anchor the circumplex structure in valence and arousal dimensions (for a review, see Russell & Feldman Barrett, 1999). Valence refers to the hedonic quality (pleasure or displeasure) of, and arousal to the felt activation associated with, affective phenomena. All affective stimuli (i.e., emotion-related language; facial expressions of emotion; emotional episodes such as anger, sadness, and fear; and nonemotional affective states like fatigue, sleepiness, and placidity) can be characterized as combinations of these two independent dimensions. As is discussed later, it is of particular importance to this report that all emotion-related words can be characterized in terms of valence and arousal properties (even though valence and arousal are not sufficient to capture all of the important aspects of any emotion-related word).
Individual differences in the granularity of experienced emotion (such as those illustrated in Figure 2a and Figure 2b) can be described according to the emphasis that individuals place on valence and arousal when reporting their experiences. The more that individuals emphasize valence (or arousal) during the reporting process, the more their self-reports will contain information about each property of experience. Valence focus represents the amount of information about pleasure or displeasure contained in verbal reports of emotional experience. Individuals high in valence focus emphasize pleasure and displeasure in the content of their verbal reports more than do those lower in valence focus. Similarly, arousal focus represents the amount of information about felt activation or deactivation contained in those verbal reports. The higher an individual’s arousal focus, the more activation and deactivation are emphasized in the contents of his or her verbal reports.
Descriptively, valence focus and arousal focus describe the implicit content in self-reports of experienced emotion and suggest how participants apply adjectives to their experience during the self-report process. Consider what participants do when they apply emotion adjectives to their experience during the self-report process. At a given measurement instance, participants introspect to assess their momentary experience and then hold that experience in mind as they report that feeling by rating the extent to which each emotion adjective (happy, anxious, annoyed, etc.) describes their current emotional state on a Likert-type scale. When people high in valence focus rate emotion adjectives to report their experience of emotion, they primarily emphasize pleasure and displeasure, whereas people low in valence focus take valence into account less during the rating process. When people high in arousal focus rate emotion adjectives to communicate their experience of emotion, they emphasize activation and deactivation more so than those lower in arousal focus.
The next question is why people differentially emphasize valence and arousal during the reporting process. Are they driven by their feelings or their understanding of the emotion adjectives used in the rating process? One possible explanation for individual differences in valence focus and arousal focus is that people differ in the intensity and frequency with which they experience feelings of pleasure–displeasure and activation–deactivation. Differential experience leads to differential attention to these affective feelings, such that people adjust their word use during the self-report process to reflect the contents of their experiences. The result would be individual differences in valence focus and arousal focus. As evidence for this hypothesis, recent findings suggest that valence focus is related to a general sensitivity to pleasant and unpleasant cues in the environment (Feldman Barrett & Bliss-Moreau, 2003; Feldman Barrett & Gross, 2001; Feldman Barrett & Niedenthal, in press), whereas arousal focus is related to interoceptive sensitivity (Feldman Barrett, Quigley, Bliss-Moreau, & Aronson, 2003). Another possibility is that people differentially emphasize valence and arousal in the reporting process not because their experience of emotion differs, but because they differ in the extent to which they weigh valence and arousal in their definitions of the words (separate from what is being communicated with those words). Indeed, the main criticism that appraisal theorists levy against the use of self-reports to study the experience of emotion is that such reports tell us more about emotion language than about the phenomenal contents of the experience itself (e.g., Frijda, Markam, Sato, & Wiers, 1995; Ortony, Clore, & Collins, 1988). Self-reports have even been called “shackles” (Cacioppo, 2002) to illustrate that they are limiting in the study of affective reactions.
Overview of Studies
The purpose of this article was to examine the degree to which self-reports of experienced emotion are driven by the semantic understanding of words versus the phenomenological feelings. In the three studies reported here, I empirically compared individual differences in the extent to which people emphasize valence and arousal in their self-reported emotion experience with individual differences in the extent to which those same individuals emphasize valence and arousal in the structure of emotion language. This allowed a direct test of whether an individual’s valence focus and arousal focus in reports of experienced emotion were distinct from his or her semantic representation of emotion language.2 Semantic representations were obtained by having participants judge the similarity in a set of emotion-related words, and focus estimates were computed on participants’ reports on their own experiences of emotion in a number of different settings. In Studies 2 and 3, the identical emotion words were used for both tasks (e.g., participants rated the similarity between the words nervous and sad as well as reported on their momentary feelings of nervousness and sadness at each measurement moment in experience-sampling paradigms and in laboratory procedures).
In Study 1, I examined the relationship between two estimates of valence focus and arousal focus derived from the experience-sampling ratings (each set of estimates derived from a different set of items) and two estimates of semantic representations derived from similarity ratings (one taken before and the other after the experience-sampling period). In Studies 2 and 3, I examined the relationship between semantic representations, focus indices derived from experience-sampling ratings, and focus indices derived from ratings of experience taken in another context (to a set of evocative slides in Study 2 and to laboratory emotion inductions in Study 3).
Study 1
Method
Participants
Participants were 53 psychology undergraduates (21 men, 32 women) at the Pennsylvania State University.3 These sample sizes reflect the number of participants available for analysis. The sample began with 64 participants. Six participants were dropped from the sample because they reported using memory to complete their momentary emotion ratings in excess of 25% of the time (9.4% of cases), and 5 were dropped because they did not comply with experimental procedures (7.8% of cases). All participants received extra credit for their participation and had an opportunity to participate in a cash lottery.
Procedure
Participants in Study 1 made similarity ratings for a set of 16 emotion-related adjectives both before and after the experience-sampling period. At the beginning of the study, participants completed a set of similarity ratings (called the presampling similarity ratings), which was followed by the instructions for the experience-sampling portion of the study. During the experience-sampling procedure, participants completed a rating online of their momentary emotional experiences in the morning (7 a.m. to 12 p.m.), afternoon (12 p.m. to 5 p.m.), and evening (5 p.m. to 12 a.m.) for each of 60 consecutive days. Participants chose the moment of measurement within each time block, and they were asked to report on their current emotional experience at the moment of rating (not a summary of the time period). Occasionally participants completed questionnaires for more than 60 days, and these were included in the analyses. Participants returned completed forms on Monday, Wednesday, and Friday of each week. Research assistants contacted participants within 48 hr if participants failed to return their emotional experience ratings and interviewed participants three times during the study to ensure compliance with the research procedures.
After participants completed the experience-sampling portion of the study, they provided another set of similarity ratings (the postsampling similarity ratings) on the same set of words used for the presampling ratings. After these were completed, experimenters explained the purpose of the study and then asked a number of questions regarding compliance with study procedures. In particular, participants estimated the percentage of time that they used recall to complete their emotion experience ratings, and they were dropped from the final sample if they reported using memory for more than 25% of the sampling period.
Similarity of Emotion-Related Words
In Study 1, participants rated the similarity of all possible pairs of 16 emotion-related adjectives that equally sampled all parts of the space associated with the circumplex model of affect. The terms used included excited, lively, cheerful, pleased, calm, relaxed, idle, still, dulled, bored, unhappy, disappointed, nervous, fearful, alert, and aroused. Each term served both as the referent and as the comparison in each pairing, resulting in 240 judgments. Participants were asked to rate the similarity of the words on a 7-point Likert scale (1 = extremely dissimilar, 4 = unrelated, 7 = extremely similar). Terms appeared equally spaced throughout the measure (see Davison, 1983). The adjective pairs were presented in a single random order. The 240 similarity ratings were reduced to 120 ratings by averaging the ratings across the corresponding word pairs. This procedure was followed for the presampling and postsampling ratings. Individual differences in semantic representations of emotion language were derived from these ratings.
Experience-Sampling Ratings of Experienced Emotion
At each measurement moment, participants indicated on a 7-point Likert scale the extent to which each of 88 emotion-related adjectives described their current emotional state (0 = not at all, 3 = a moderate amount, 6 = a great deal). Sixty adjectives were taken from the Positive Affect and Negative Affect Schedule—Expanded Form (Watson & Clark, 1994), and an additional 28 items sampled remaining portions of the affect circumplex (see Larsen & Diener, 1992). Of these 88 items, 32 items (two sets of 16 terms that sampled equally from all portions of the circumplex space) were sampled to compute estimates of the relatedness between reported emotional experience (i.e., to estimate emotional granularity). The number of usable measurement moments ranged from 163 to 203 (M = 175.0, SD = 6.1). None of the participants missed more than 16.0% of the observations, and the average percentage of missed observations was 3.2%. Valence focus and arousal focus were computed for each estimate of emotional granularity. Comparing focus indices for each estimate of emotional granularity allowed a test of convergent validity for valence focus and arousal focus across distinct sets of items.
Results
By examining the correspondence between individual differences in the semantic representation of emotion-related adjectives (computed from the similarity ratings) and individual differences in valence focus and arousal focus (derived from self-reports of experienced emotion), it was possible to empirically determine whether self-report ratings primarily tell us something about words rather than about feelings. If individual differences in emotion language were strongly related to valence focus and arousal focus in self-reports of experience, then this would support the hypothesis that self-reports of experienced emotion tell us about the differential attention to properties of words rather than about the properties of feelings, per se. If the two are not strongly related, then we have evidence consistent with the hypothesis that valence focus and arousal focus reflect the focus of attention to feelings of pleasure–displeasure and felt activation–deactivation, suggesting that self-reports reflect the actual experience of emotions. Before comparisons could be made of semantic representations of emotion language with valence focus and arousal focus, it was necessary to compute both from participants’ rating behavior.
Individual Differences in Semantic Representations of Emotion Language
Similarity judgments are thought to be an index of mental structure (e.g., Shepard, 1987; Tversky, 1977). When rendered in geometric space by a multidimensional scaling (MDS) procedure, similarity ratings for pairs of words map the cognitive structure of those words. The words are placed in N-dimensional geometric space, where the dimensions characterize the attributes or properties of the words (Davison, 1983). People do not explicitly use these properties during the similarity-rating task, however: They merely rate the similarity of word pairs. The dimensions that result represent implicit components of the cognitive structure for emotion-related adjectives. The words are represented by their coordinates on the dimensions, indicating how much of each property they contain.
When derived from pairwise similarity judgments of emotion-related words, MDS solutions routinely yield valence and arousal dimensions to anchor the semantic representation of emotion language (Russell & Feldman Barrett, 1999). Valence and arousal dimensions have been identified in emotion-related language across many cultures (e.g., Russell, 1983; Russell, Lewicka, & Niit, 1989), across words sets that differ in size and elements (e.g., Block, 1957; Bush, 1973; Feldman, 1995b, Russell, 1980), and even in very young children (e.g., Russell & Ridgeway, 1983). They represent the basic, semantic properties contained in our knowledge about emotion-related words and the concepts that those words represent (cf. Feldman Barrett & Fossum, 2001; Russell, 1980; Russell & Feldman Barrett, 1999). The identification of these dimensions as valence and arousal has been verified by empirically comparing the dimension coordinates for the words against explicit ratings of the words on valence and arousal; the explicit judgments were made by independent groups of respondents (Feldman, 1995b; Feldman Barrett & Fossum, 2001; Kring, Feldman Barrett, & Gard, 2003). Such analyses confirm that the MDS dimensions do, indeed, represent the hedonic and activation properties of the words. On the basis of past research, I hypothesized that an MDS solution of similarity ratings would yield valence and arousal dimensions.
Although valence and arousal dimensions might describe the cognitive structure of emotion language for a group of respondents, it is possible that there are individual differences in the degree to which each person implicitly weighs valence and arousal when generating similarity ratings. In general, we know that the more a person attends to a given property (e.g., valence), the more the property will influence the perceived similarity in a set of objects (e.g., emotion words). These attentional differences can be estimated using an individual difference multidimensional scaling procedure (INDSCAL; Carroll & Chang, 1970). INDSCAL computes dimension weights to quantify the extent to which properties (represented by the dimensions) influenced the judged similarity among objects (see Arabie, Carroll, & DeSarbo, 1987). Heavier weights reflect greater attention to the property (Nosofsky, 1986, 1992). INDSCAL weights have been used to index differential attention in previously published studies (e.g., Fazio & Dunton, 1997; Halberstadt & Niedenthal, 1997). In this study, the INDSCAL weights indexed individual differences in the semantic representation of emotion-related words.
The pre- and postsampling similarity ratings of emotion-related words were subjected to separate INDSCAL analyses using the ALSCAL procedure (Takane, Young, & DeLeeuw, 1976). The primary approach to ties (allowing data to become untied) was used in the analysis because it typically results in a better fit to the data (Davison, 1983, p. 86). According to convention, the fit of each solution was determined by (a) a stress value that indicates the extent of a solution’s departure from the observed data, (b) the interpretability of the solution, and (c) the reproducibility of each solution (Davison, 1983).
Two-dimensional MDS solutions best modeled both sets of similarity ratings. Stress × Dimensions plots for the analyses of the pre- and postsampling similarity ratings revealed a clear elbow at the two dimensional solution in both cases (stress = .16, RSQ = .85, and stress = .17, RSQ = .84, for pre- and postsampling solutions, respectively).4 The squared correlation for each solution was high, indicating that a large proportion of variance in the scaling solutions was accounted for in the distances between emotion-related words, as estimated by their similarity ratings. The words fell, as predicted, in a circular order around two dimensions, as depicted in Figure 3a and Figure 3b. An inspection of these solutions suggested that the axes were easily interpretable as the valence and arousal denoted by the emotion words. The solutions were highly replicable. The pre- and postsampling semantic solutions were practically identical to one another, as indicated by a congruence coefficient (Davison, 1983) of .998. The strong correspondence between these two structures is important because it indicates that 60 days of intervening attention to emotional experience did not substantially alter the group semantic solutions or the similarity ratings from which they were derived. Furthermore, the solutions were reliable when compared with other estimates of the cognitive structure of emotion language. Both the pre- and postsampling group solutions were highly similar to the MDS semantic solutions depicted in Figure 3c (taken from Feldman, 1995a) and Figure 3d (derived from similarity ratings provided by a sample of Boston College participants, N = 15). Coefficients of congruence (Davison, 1983) were high between the Study 1 solutions and the other two MDS group solutions (above .90), even though they were derived from different subjects making pairwise similarity ratings on a different set of emotion-related words. (Coefficients of congruence were computed by comparing the MDS coordinates for synonyms or for words that were predicted to fall in similar locations in affective space.)
Figure 3.
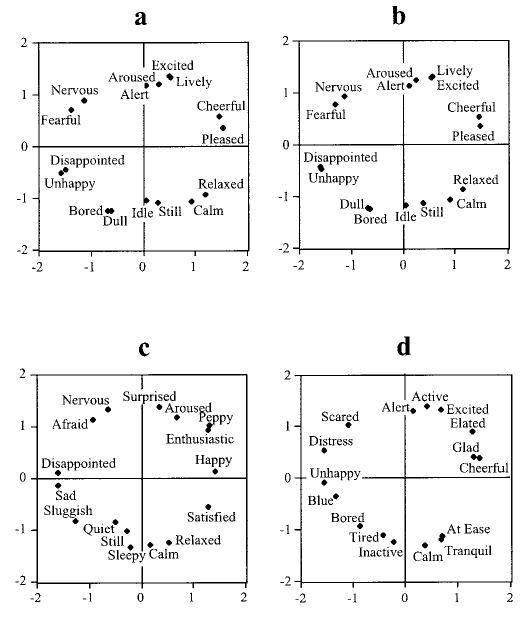
Semantic representations of the core affective knowledge. Valence is the horizontal axis, and arousal is the vertical axis. A and b were derived from pre- and postsampling similarity ratings, respectively (Feldman Barrett & Fossum, 2001); c was derived from similarity ratings taken from Feldman (1995a); d was derived from similarity ratings obtained from a separate sample of Boston College participants.
To estimate how important the valence and arousal properties were in the semantic representation of emotion language for each participant, I examined the subject weights derived from the pre-and postsampling group solutions; descriptive statistics are presented in Table 1. In absolute terms, weights could range from 0 to 1, where 0 indicated that the dimension was unimportant to a participant’s structure and 1 indicated that it was very important (Young & Harts, 1994). The variability in the subject weights indicated that participants varied in their attention to the valence-and arousal-based properties of the emotion-related words. Furthermore, the dimension weights from the pre- and postsampling solutions were largely consistent with one another, indicating that there was stability in the extent to which individuals emphasized each semantic component in their definitions of the words (r = .51, p<.001 for valence weights; r = .74, p < .001 for arousal weights). This stability was evident even though the two sets of similarity ratings were obtained 60 days apart, during which time participants were cued to attend to their ongoing experiences of emotion. Interestingly, on average, individuals tended to weigh arousal-based properties of the emotion words more than valence-based properties in both sets of ratings, t(52) = 7.89, p < .001, for the presampling solution; t(52) = 5.76, p < .001, for the postsampling solution.
Table 1.
Descriptive Statistics for Individual Differences in Semantic Structure
| Study 1
|
Study 2
|
Study 3
|
||||||
|---|---|---|---|---|---|---|---|---|
| Presampling INDSCAL weights
|
Postsampling INDSCAL weights
|
INDSCAL weights
|
INDSCAL weights
|
|||||
| Descriptive statistic | Valence | Arousal | Valence | Arousal | Valence | Arousal | Valence | Arousal |
| M | .53 | .74 | .55 | .71 | .54 | .68 | .55 | .69 |
| SD | .10 | .11 | .11 | .13 | .09 | .10 | .06 | .07 |
| Minimum | .27 | .40 | .30 | .26 | .35 | .28 | .41 | .52 |
| Maximum | .75 | .91 | .86 | .87 | .86 | .86 | .71 | .84 |
Note. INDSCAL = individual difference multidimensional scaling procedure.
Estimating Valence Focus and Arousal Focus in Experienced Emotion
In estimating valence focus and arousal focus, I am asking the question: “How much of the granularity in the experience of two emotions is due to a person’s emphasis on valence and arousal?” In operational terms, I am asking, “How much of the correlation between ratings of two emotional experiences is accounted for by the valence- or arousal-based similarity of the words?” For example, sadness is characterized as an unpleasant state that is low in activation and anxiety is an unpleasant state that is high in activation; the two words are similar in terms of the valence they denote, but different in arousal. If a person sometimes reports feeling both anxious and sad and other times feels one but not the other, this will result in a correlation of zero, as the person is rating anxiety and sadness in distinct ways, using both valenced- and arousal-based information in the words’ meaning to represent experiences of emotion. In contrast, if a person consistently reports both together (or neither) at every measurement instance, this will produce a correlation of 1, as the person is using the words to represent what the states have in common (i.e., valence) and ignoring how they differ (i.e., arousal).
It is possible to estimate the granularity in a person’s report of experienced emotion by computing a P-correlation matrix for a given set of items for that person over time. It is possible to estimate how much a person emphasizes valence and arousal in the rating of his or her experience by correlating that person’s P-correlation matrix with external criteria indicating the valence-and arousal-based similarity of the words. These correlations reflect the variance in the self-report ratings attributable to each property (Feldman, 1995a; Feldman Barrett, 1998). If the valence-based similarity of the words accounts for a large proportion of variance in the correlations between ratings of emotional experiences for a given person, then this person is high in valence focus. If the valence-based similarity of the words accounts for a small proportion, then the person is low in valence focus. A similar argument can be made for arousal focus.5
Estimating emotional granularity
Two P-correlation matrices were computed for each person, thereby providing two estimates of the relatedness between reports of experienced emotion. P-correlation matrix–1 was computed for each participant and contained self-report ratings of the words enthusiastic, peppy, happy, satisfied, calm, relaxed, quiet, still, sleepy, sluggish, sad, disappointed, nervous, afraid, surprised, and aroused. The correlation matrix was computed for each participant by correlating his or her ratings across the observation period. P-correlation matrix–2 contained ratings of excited, elated, glad, cheerful, at ease, calm, tranquil, inactive, tired, bored, blue, unhappy, distressed, scared, active, and alert. Word Sets 1 and 2 contained one overlapping item (.063%). Fisher’s r-to-z transformations were performed on the P-correlations so that the correlations could be used in further analyses.
Estimating valence- and arousal-based similarity of emotion-related words
The similarities of emotion words in terms of valence and arousal were derived from the general cognitive structure of emotion language (i.e., a group MDS solution that represents the definitions of the words used in the rating process). I could have used either the pre- or the postsampling MDS group solutions for this purpose, but this would have resulted in concerns about data overlap in the final analyses (because both the estimates of semantic structure and focus in self-reports would be based in part on the same data). A stronger option was to quantify valence focus and arousal focus using the cognitive structure of emotion language derived from similarity ratings provided by other participants. Thus, the structures used here were those presented in Figure 3c (derived from participants reported in Feldman, 1995a) and Figure 3d (derived from a Boston College sample of 15 participants). The MDS group solution presented in Figure 3c contained the same words as those used to compute P-correlation matrix–1, and this was also the case for the solution in Figure 3d and P-correlation matrix–2.
A valence-based distance matrix for each MDS group solution was computed by taking the absolute difference between coordinates for all pairs of emotion-related words along the valence dimension. Each word had one coordinate on the valence dimension of each solution, so the result was 120 valence-based distances for each MDS solution. These distances reflected the similarity between every pair of affect words in terms of their pleasure or displeasure. The smaller the absolute value between two coordinates, the smaller the distance between two terms on a dimension, and the more similar those terms are in terms of valence. A similar procedure was followed for coordinates along the arousal dimension. This produced two valence-based and two arousal-based distance matrices (one from theFeldman [1995a] sample and one from the Boston College sample).
Correlating each P-correlation matrix to valence- and arousal-based word distances
Finally, each P-correlation matrix for each participant (constituting an estimate of relatedness in reports of emotional experiences for that person) was correlated with the valence- and arousal-based semantic similarity matrix that contained the same word set. P-correlation matrix–1 was correlated to the MDS solution depicted in Figure 3c. P-correlation matrix–2 was correlated to the MDS solution depicted in Figure 3d. The signs of these resulting correlations were reversed to produce one valence focus and arousal focus index for each P-correlation matrix (such that higher values would represent greater focus). Because the resulting indices are themselves correlation coefficients, they too were subjected to a Fisher’s r-to-z transformation before being used in further analyses.
The descriptive statistics for the two valence focus and two arousal focus indices are presented in the final data columns of Table 2. On average, individuals tended to focus more on the valence of their experience than on their level of activation; t(52) = 12.40, p<.001, for the first set of focus indices, t(52) = 6.77, p < .001, for the second set of focus indices. Also presented in Table 2 are the correlations between the valence focus and arousal focus indices. Correlations representing the criterion validity for valence focus indices and for arousal focus indices are presented in bold text. Several things are notable about the correlations presented in Table 2. First, both valence focus and arousal focus indices displayed strong criterion validity across different word sets, even though they were computed using semantic structures from independent groups of participants. Second, moderately strong negative correlations were observed between valence focus–2 and arousal focus–2, replicating previous findings that the two are inversely related to one another (Feldman, 1995a; Feldman Barrett, 1998), although this relationship did not appear for valence focus–1 and arousal focus–1.
Table 2.
Criterion Validity for Valence Focus and Arousal Focus in Reports of Experience: Study 1
| Valence focus
|
Arousal focus
|
Descriptive
|
||||
|---|---|---|---|---|---|---|
| Variable | 1 | 2 | 3 | 4 | M | SD |
| Valence focus | ||||||
| 1. Word Set 1 | — | .63 | .22 | |||
| 2. Word Set 2 | .77*** | — | .66 | .24 | ||
| Arousal focus | ||||||
| 3. Word Set 1 | .03 | −.21 | — | .21 | .13 | |
| 4. Word Set 2 | −.16 | −.49*** | .80*** | — | .29 | .22 |
Note. Means and standard deviations are reported for Fisher’s transformed valence focus and arousal focus indices. Correlations representing criterion validity are in bold.
p < .001.
Do Individual Differences in Semantic Representation Account for Variations in Reports of Experienced Emotion?
There was evidence for a link between people’s semantic representation of emotion language and their degree of arousal focus when reporting their experience of emotion. Zero-order correlations between the INDSCAL weights and the arousal focus indices are presented in the right half of Table 3. When a person attended more to the arousal-based components of the emotion-related words in making similarity judgments, that person’s verbal reports of emotional experience also contained more arousal-related information. There was little evidence in support of a correspondence between semantic focus and valence focus. Curvilinear relationships were not significant and are not reported here.6
Table 3.
Correlations Between Individual Differences in Self-Report and Individual Differences in Semantic Structure: Study 1
| Valence INDSCAL weight
|
Arousal INDSCAL weight
|
|||
|---|---|---|---|---|
| Variable | Presampling MDS | Postsampling MDS | Presampling MDS | Postsampling MDS |
| Valence focus | ||||
| Word Set 1 | .18 | .15 | −.24† | −.24† |
| Word Set 2 | .24† | .18 | −.27* | −.17 |
| Arousal focus | ||||
| Word Set 1 | −.26† | −.23† | .44*** | .43*** |
| Word Set 2 | −.30* | −.26† | .47*** | .40*** |
Note. INDSCAL = individual difference multidimensional scaling procedures; MDS = multidimensional scaling.
p < .10.
p < .05.
p < .001.
Discussion
Overall, the evidence from Study 1 did not provide support for a purely language-based interpretation of self-reported emotional experience. There was no evidence that individuals who attended more to the valenced properties of words also represented more pleasure–displeasure in the contents of their emotional experience. On the basis of these findings, it seems unlikely that valence focus in reports of emotion experience is primarily a property of emotion language, separate and distinct from differential attention to feelings of pleasure–displeasure. The findings for arousal focus suggested more of a link between people’s attention to the arousal properties of the words and the contents of their reported experience. Individuals who attended more to the arousal properties of emotion-related words also focused their self-reports of emotional experience more on felt activation than did those who attended less. This correspondence is consistent with the hypothesis that arousal focus is, in part, a property of emotion language.
Study 2
The purpose of Study 2 was to test the correspondence between the structure of experienced emotion (valence focus and arousal focus) and the semantic structure of emotion language in another sample of participants. In particular, Study 2 was aimed at replicating and expanding the evidence for the finding that arousal focus in self-reports of experienced emotion is partly a word-based phenomenon. Study 2 used a computerized experience-sampling procedure to obtain ratings of momentary emotional experience from which valence focus and arousal focus could be estimated. Computerized experience-sampling procedures have various advantages over the pencil-and-paper method used in Study 1, including better tracking of participants’ compliance, randomizing item delivery to minimize context effects during the rating process, and recording response latencies with which ratings are made (Conner, Feldman Barrett, Bliss-Moreau, Lebo, & Kaschub, 2003; Feldman Barrett & Barrett, 2001). I also used a computerized version of the similarity judgment task.
Finally, to examine the generalizability of the finding that arousal focus in self-reports of experienced emotion is partly a word-based phenomenon, I had participants in Study 2 also rate their emotional reactions to a set of evocative slides (Lang, Ohman, & Vaitl, 1988) presented in the lab. Attention to stimulus properties can be influenced by context (for a general discussion, see Smith & Zarate, 1992), so having participants report their experiences of emotion in response in a controlled laboratory environment was important. Also, having reports of experienced emotion in two settings (in response to the slides and in natural settings) provided an opportunity to compute valence focus and arousal focus in two different conditions and examine their relationship.
Method
Participants
Participants were 118 undergraduates (39 men, 79 women) at Boston College. These sample sizes reflect the number of participants available for analysis. One hundred forty-three participants began the study; 21 participants dropped out either before or during the experience-sampling portion of the study (14.7%); 4 were dropped because they did not comply with experimental procedures (2.80% of remaining cases). All participants received $50 and had an opportunity to participate in a cash lottery.
Procedure
Participants visited the laboratory five times during the course of the study. During the first laboratory session, participants were assigned a palm-top computer (Hewlett Packard 360 LX) and received instructions regarding the experience-sampling portion of the study. The palm-tops ran on custom software (Experience Sampling Program; ESP; Barrett & Feldman Barrett, 1999). Affect terms were presented in a random order at each trial. Participants made their ratings on a 7-point Likert scale (0 = not at all, 3 = a moderate amount, 6 = a great deal) measured by pressing numbers on the keyboard of the palm-top computer.
Participants were told that they would be beeped randomly 10 times per day for a 28-day period and asked about their momentary affective experience using 29 emotion-related terms (potentially resulting in 280 affect measurement trials per participant, each of which contained ratings for 29 terms). Participants were told to respond as quickly as possible without compromising their accuracy. They were told that if they did not respond to the first prompt, they would be beeped again 2 min later. If they failed to respond to that prompt as well, then the trial was recorded as missing data. Participants went through a practice trial of ESP and received a written set of instructions about the experience-sampling procedure before leaving the laboratory. Both ratings of experience and latencies to make those ratings were recorded.
Participants attended four additional weekly laboratory sessions in which an experimenter uploaded their data to a host personal computer. They were given immediate feedback regarding their level of trial completion (using a companion program called ESPCount; Barrett & Feldman Barrett, 1999). In addition, they performed laboratory tasks, including providing similarity judgments of emotion-related words and their emotional reactions to evocative slides.
Similarity of Emotion-Related Words
Participants made a set of similarity judgments using SuperLab for a Macintosh platform. Participants were seated in front of a G3 or a PowerMac 7600/120 and asked to judge the similarity for all pairs of circumplex markers (120 pairs in all). For a given pair, each term served either as the referent or as the comparison. Pairs were presented in a different random order for each participant. The intertrial interval was 1,000 ms (1 s). Participants made their ratings on a 7-point Likert scale (1 = extremely dissimilar, 4 = unrelated, 7 = extremely similar) by pressing numbers on the keyboard of the Macintosh. Participants were told to respond as quickly as possible without compromising their accuracy. Both similarity judgments and latencies to make those judgments were recorded.
Emotional Reactions to Evocative Slides
Participants viewed a series of 16 slides from the International Affective Picture System (IAPS; Lang et al., 1988). Normative ratings from Lang et al. (1988) were used to select the slide set that, taken together, represented all combinations of valence and arousal in circumplex space. Descriptive information regarding the slide set is presented in Table 4. The IAPS task was implemented using SuperLab for a personal computer platform. Participants were seated in front of a personal computer and asked to report how they felt in response to viewing each slide. Participants rated their affective reaction to each picture using the same 16 terms included in the similarity and experience-sampling tasks, yielding a 16 by 16 matrix of ratings for each participant. Participants made their ratings on a 7-point Likert-type scale (0 = not at all, 3 = a moderate amount, 6 = a great deal) by pressing numbers on the keyboard of the computer. Participants were told to respond as quickly as possible without compromising their accuracy.
Table 4.
International Affective Picture System Slides Used in Study 2
| Valence rating
|
Arousal rating
|
||||
|---|---|---|---|---|---|
| Slide no. | Slide description | M | SD | M | SD |
| 1710 | Puppies | 8.34 | 1.12 | 5.41 | 2.34 |
| 2050 | Baby | 8.20 | 1.31 | 4.57 | 2.53 |
| 2205 | Hospital | 1.95 | 1.58 | 4.53 | 2.23 |
| 2800 | Crying boy | 1.78 | 1.14 | 5.49 | 2.11 |
| 5000 | Flower | 7.08 | 1.77 | 2.67 | 1.99 |
| 5621 | Sky divers | 7.57 | 1.42 | 6.99 | 1.95 |
| 5760 | Outdoors | 8.05 | 1.23 | 3.22 | 2.39 |
| 5920 | Volcano | 5.16 | 1.92 | 6.23 | 2.08 |
| 6230 | Aimed gun | 2.37 | 1.57 | 7.35 | 2.01 |
| 6550 | Knife | 2.73 | 2.38 | 7.09 | 1.98 |
| 7010 | Basket | 4.94 | 1.07 | 1.76 | 1.48 |
| 7080 | Fork | 5.27 | 1.09 | 2.32 | 1.84 |
| 7234 | Ironing board | 4.23 | 1.58 | 2.96 | 1.90 |
| 8160 | Man on cliff | 5.07 | 1.97 | 6.97 | 1.62 |
| 8190 | Skiers | 8.10 | 1.39 | 6.28 | 2.57 |
| 9001 | Cemetery | 3.10 | 2.02 | 3.67 | 2.30 |
Note. Valence and arousal norms were taken from Lang et al. (1988).
For each trial, a slide appeared on the computer screen with 1 of the 16 emotion-related terms below it. Participants rated their response on this adjective. Once they pressed a key registering their response, another term appeared for rating. The slides remained visible on the screen until all 16 terms were rated. After completing the ratings in response to 1 slide, another slide appeared immediately, and the participant continued rating his or her affective responses. Slides were presented in random order to each participant, and adjectives were presented in random order within each slide. Both emotional reactions to the IAPS slides and latencies to make those ratings were recorded.
Experience-Sampling Ratings of Experienced Emotion
At each measurement moment, participants were presented with 29 emotion-related adjectives in random order. Participants used 7-point Likert-type scales (1 = not at all, 4 = a moderate amount, 7 = a great deal) to indicate the extent to which each adjective described their current emotional state as quickly and accurately as possible by pressing numbers on the keyboard of the palm-top computer. Of the 29 adjectives used, 16 were sampled to construct P-correlation matrices as described in Study 1 (enthusiastic, peppy, happy, satisfied, calm, relaxed, quiet, still, sleepy, sluggish, sad, disappointed, nervous, afraid, surprised, and aroused). These words are the same as those used to compute P-correlation matrix–1 in Study 1. The number of usable trials ranged substantially from 35 to 251 (M = 125.7, SD = 47.9). The number of trials available for analysis was used as a covariate in all of the analyses reported later to determine whether it systematically altered the results. In every case, the results containing the covariate were identical to those without. The results without the covariate are reported.
Results
As in Study 1, the goal was to examine whether reports of experienced emotion were primarily word-based judgments (instead of judgments about subjective feeling states). I examined the relation between participants’ emphasis on the valence- and arousal-based properties of words in their semantic representation of emotion language (computed from their similarity ratings of emotion words) and their focus on valence and arousal when self-reporting their feelings (during experience-sampling and in response to evocative slides).
Individual Differences in Semantic Representations of Emotion Language
The similarity ratings were subjected to an INDSCAL analysis using the ALSCAL procedure as described for Study 1. A two-dimensional group MDS solution proved most suitable (stress = .19, RSQ = .78), and the dimensions corresponded to the valence and arousal denoted by the words. The congruence coefficient for this solution and the one presented in Figure 3c (depicting a semantic structure for the same words derived from Feldman, 1995a) was .88, indicating that the semantic structure replicated at a group level. The descriptive statistics for the subject weights associated with the INDSCAL analysis are presented in Table 1. As in Study 1, on average, individuals tended to weigh arousal-based properties of the emotion words more than valence-based properties when making their similarity judgments, t(117) = 9.12, p < .001.
Estimating Valence Focus and Arousal Focus in Experienced Emotion
As in Study 1, valence focus and arousal focus indices were computed by quantifying the proportion of variance in participants’ reports of emotional experience accounted for by valence-and arousal-based meaning of the words used in the rating process. Each of two P-correlation matrices (one derived from the self-report ratings of experience and the other from reactions to IAPS slides) was compared to valence- and arousal-based semantic distance matrices (derived from theFeldman [1995a] MDS group solution). The result was two valence focus and two arousal focus indices for each participant. The descriptive statistics for both sets of valence focus and arousal focus indices are presented in Table 5, along with their intercorrelations. Criterion validity coefficients are presented in bold text in Table 5. As expected, both valence focus and arousal focus displayed moderate criterion validity across experience-sampling and IAPS-induced ratings of experienced emotion. Once again, negative correlations were observed between indices of valence focus and arousal focus, replicating previous findings. Furthermore, as in Study 1, on average, individuals tended to focus more on the valence of their experience than on their level of activation, t(117) = 11.79, p < .001, for the experience-sampling focus indices, t(117) = 15.64, p < .001, for the IAPS focus indices.
Table 5.
Criterion Validity for Valence Focus and Arousal Focus in Reports of Experience: Study 2
| Valence focus
|
Arousal focus
|
Descriptives
|
||||
|---|---|---|---|---|---|---|
| Variable | 1 | 2 | 3 | 4 | M | SD |
| Valence focus | ||||||
| 1. Experience sampling | — | .63 | .18 | |||
| 2. IAPS Reactions | .29** | — | .65 | .16 | ||
| Arousal focus | ||||||
| 3. Experience sampling | −.41*** | −.14 | — | .31 | .17 | |
| 4. IAPS Reactions | −.06 | −.47*** | .28** | — | .28 | .14 |
Note. Means and standard deviations are reported for Fisher’s transformed valence focus and arousal focus indices. Correlations representing criterion validity are in bold. IAPS = International Affective Picture System.
p < .01.
p < .001.
Do Individual Differences in Semantic Representation Account for Variations in Reports of Experienced Emotion?
As in Study 1, there was essentially no evidence that valence focus in self-reports of experienced emotion was a word-based phenomenon, but there was evidence that arousal focus was partly due to individual differences in the way that participants understood emotion words. As indicated in Table 6, there was moderate correspondence between INDSCAL arousal weights and arousal focus indices, but no significant correspondence between INDSCAL valence weights and valence focus indices. Curvilinear relationships were not statistically significant and are not reported here.
Table 6.
Correlations Between Individual Differences in Self-Report and Individual Differences in Semantic Structure: Study 2
| Variable | Valence INDSCAL weight | Arousal INDSCAL weight |
|---|---|---|
| Valence focus | ||
| Experience sampling | .11 | .00 |
| IAPS reactions | .03 | −.08 |
| Arousal focus | ||
| Experience sampling | −.16† | .36*** |
| IAPS reactions | −.15† | .37*** |
Note. INDSCAL = individual difference multidimensional scaling procedure; IAPS = International Affective Picture System.
p< .10.
p < .001.
Discussion
The evidence from Study 2, like that from Study 1, did not support a purely language-based interpretation of valence focus and arousal focus. The importance of valence in a person’s emotion vocabulary had little to do with the focus on valence when rendering ratings of experienced emotion. Individuals for whom arousal figured more prominently in the structure of their emotion vocabulary emphasized activation and deactivation information to a greater extent when verbally representing their emotional experience, both when reporting their experience on a moment-to-moment basis and in response to evocative visual stimuli. In fact, the two indices of arousal focus in reports of experience correlated as strongly with individual differences in emotion language as they did with one another. This may have occurred, in part, because the size of the validity coefficients was reduced because of the fact that there were only 16 evocative slides, meaning that the P-correlation matrices based on IAPS reactions were considerably less stable than those computed using the experience-sampling ratings (which were computed over hundreds of measurement instances). As in Study 1, the findings suggest that arousal focus in self-reports of experienced emotion is partly a word-based phenomenon.
Study 3
Study 3 was similar to Study 2, except that participants reported their experiences of emotion after a series of laboratory procedures designed to induce specific emotions rather than reporting their reactions to evocative slides. This was an important test of the convergent validity of valence focus and arousal focus because the inductions were designed to elicit specific emotional responses and therefore to maximize emotional granularity. Furthermore, by estimating valence focus and arousal focus for these ratings, it was possible to examine the generalizability of the finding that arousal focus in self-reports of experienced emotion is partly a word-based phenomenon.
Method
Participants
Participants in Study 3 were 85 Boston College undergraduates (45 men, 40 women) who were paid $120 for their participation. One hundred twenty-two participants began the study; 33 participants dropped out either before or during the experience-sampling portion of the study (27%).7 Another 4 participants were excluded because they failed to complete the similarity-ratings procedure. Participants completed 28 days of recording their experiences of emotion (although a few sampled for more days). The number of usable measurement moments ranged substantially from 107 to 368 (M = 218.13, SD = 57.38). Participants also made similarity judgments of the same emotion-related words as described in Study 2.
Procedure
In addition, participants experienced six experimental inductions intended to induce three positive (amusement, calm, and interest) and three negative (anger, sadness, and nervousness) experiences of emotion. The emotion inductions were presented in two orders that were counterbalanced across all participants. No order effects emerged in data analysis. Immediately after each emotion induction, participants completed self-reports of emotional experience using the same adjectives as those in the experience-sampling and similarity-rating procedures. Participants made these ratings using pencil-and-paper measures. Subsequent to rating their experience, participants performed a simple cognitive task (e.g., sorting cards in numerical and suit order) to facilitate returns to baseline before the next emotion induction began.
Amusement
To induce experiences of amusement, we asked participants to view portions of a comedy routine (Sweat the Small Stuff, James, 2001). The audiovisual presentation was presented on a 17-in. (0.43 m) computer monitor, and participants listened to the audio portion via headphones. The duration of the comedy film clip was 4 min 54 s.
Interest
The interest induction involved a two-part procedure. First, we induced boredom by instructing participants to circle vowels on sheets of paper that contained random letters that filled a page. They completed the letter-circling task for 3 min. Immediately afterward, participants were asked to stop circling and switch to a novel task, which involved playing a pinball arcade computer game (Microsoft Office XP) for an additional 3 min. The pinball game was presented on a 17-in. (0.43 m) computer monitor. The technique of switching from a relatively mundane task to a video game to induce the subjective experience of interest was adapted from Reeve (1989, 1993).
Calm
Participants took part in a guided relaxation procedure (adapted from Redfield, 1995). Participants listened via headphones to a female voice that led the guided relaxation procedure. The duration of the guided relaxation procedure was 13 min 11 s.
Anger
Experiences of anger were induced with two consecutive procedures. First, participants viewed a film clip from Witness (Weir, 1985) depicting a group of young men taunting, ridiculing, and insulting a group of Amish men driving by on a horse-drawn carriage (1 min 40 s). This film clip has been shown to reliably induce subjective experiences of anger (Fredrickson & Branigan, in press). Second, immediately after viewing the film, participants were quickly (ostensibly because of time constraints) escorted by the experimenter to another room to complete the rest of the tasks for the session. To arrive at the other laboratory room participants were required to walk down a long hallway, cross two double-doors, and turn a corner. Meanwhile, a confederate of the same gender as the participant and wearing headphones (presumably listening to music), walked in the approaching direction. The confederate timed his or her approach so as to turn the corner at the same time as the approaching participant. While passing, the confederate bumped into the participant with his (or her) shoulder in a brusque manner, called the participant an “asshole,” and quickly continued down the hallway out of the sight of the participant. This procedure has been shown to reliably induce feelings of anger (Cohen, Nisbett, Bowdle, & Schwarz, 1996).
Sadness
Participants were told to imagine the death of their mother, who died for unexpected and inexplicable reasons. Participants were asked to try to experience the event as vividly as possible by imagining what they would feel like and think about and to imagine people they know as characters in the episode. The scenario was divided into five paragraphs to which participants devoted 2 min each. This procedure for inducing feelings of sadness has been used to induce sadness in other research studies (Keltner, Edwards, & Ellsworth, 1993). The guided imagery procedure was accompanied by a musical selection (Adagio for Strings, Op. 11; Barber, 1990) shown to reliably elicit subjective experiences of sadness (Krumhansl, 1997, 2002); participants listened via headphones while they read the scenario.
Nervousness
Participants completed a working memory task under increasing cognitive load. In this task, a face depicting an emotion (e.g., anger) was displayed on the left-hand side of a computer screen along with an emotion-related word (e.g., frustrated) displayed on the right-hand side of the screen. Participants were asked to judge whether the face–word pair matched or not (i.e., was the same or different) and indicated their answer using keys on the computer keyboard. Additionally, while making the judgments, participants were instructed to remember the words of the face–word pairs from previous trials for later recall. Trials were presented in blocks of 2, 3, 4, 5, or 6 face–word presentations. At the end of each block, participants were asked to recall the words, and then they started another block. This task was modeled after standard working-memory-span tasks used in cognitive psychology (Rosen & Engle, 1997; Turner & Engle, 1989).
Results
Individual Differences in Semantic Representations of Emotion Language
As in Studies 1 and 2, an INDSCAL analysis of the similarity ratings of emotion words produced a two-dimensional group MDS solution (stress = .19, RSQ = .78) with valence and arousal as the two dimensions. The congruence coefficient for this solution and the one presented in Figure 3c (depicting a semantic structure for the same words derived from Feldman, 1995a) was .95, and the congruence coefficient with the group solution for Study 2 was .99, indicating that the semantic structure replicated at a group level. The descriptive statistics for the subject weights associated with the INDSCAL analysis are presented in Table 1. As in Studies 1 and 2, individuals tended to weigh arousal-based properties of the emotion words more than valence-based properties when computing their similarity judgments, t(84) = 12.02, p < .001.
Estimating Valence Focus and Arousal Focus in Experienced Emotion
As in Studies 1 and 2, valence focus and arousal focus indices were computed by quantifying the proportion of variance in participants’ reports of emotional experience accounted for by valence- and arousal-based meaning of the words used in the rating process. P-correlation matrices were computed using the same emotion-related adjectives as described in Study 2. Two P-correlation matrices for each person (one derived from the self-report ratings of experience during experience sampling and the other from ratings of experience in response to the emotion inductions) were compared with valence- and arousal-based semantic distance matrices (derived from an independent sample of participants; Feldman Barrett & Niedenthal, in press). The result was two valence focus and two arousal focus indices for each participant. The descriptive statistics for both sets of valence focus and arousal focus indices are presented in Table 7, along with their intercorrelations. Criterion validity coefficients are presented in bold text. Both valence focus and arousal focus displayed criterion validity across experience-sampling and emotion induction contexts, although the magnitudes of the coefficient (especially for valence focus) were smaller than expected. This may have been due, in part, to the fact that there were only six inductions, meaning that the P-correlation matrices for induced emotional experiences were considerably less stable than those derived from the experience-sampling ratings (which were computed over hundreds of instances). Furthermore, as in Studies 1 and 2, on average, individuals tended to focus more on hedonics than on their level of activation when reporting their experiences, t(84) = 3.70, p < .001, for the experience-sampling focus indices, t(84) = 11.39, p < .001, for the induction focus indices.
Table 7.
Criterion Validity for Valence Focus and Arousal Focus in Reports of Experience: Study 3
| Valence focus
|
Arousal focus
|
Descriptive
|
||||
|---|---|---|---|---|---|---|
| Variable | 1 | 2 | 3 | 4 | M | SD |
| Valence focus | ||||||
| 1. Experience sampling | — | .53 | .22 | |||
| 2. Emotion inductions | .22* | — | .55 | .18 | ||
| Arousal focus | ||||||
| 3. Experience sampling | −.28** | −.16† | — | .40 | .18 | |
| 4. Emotion inductions | −.21* | −.35*** | .29** | — | .20 | .16 |
Note. Means and standard deviations are reported for Fisher’s transformed valence focus and arousal focus indices. Correlations representing criterion validity are in bold.
p < .10.
p < .05.
p < .01.
p < .001.
Do Individual Differences in Semantic Representation Account for Variations in Reports of Experienced Emotion?
Unlike Studies 1 and 2, there was support for both valence focus and arousal focus being related to the way that participants understood emotion words. As indicated in Table 8, there was a significant correspondence between INDSCAL arousal weights and arousal focus indices, as well as between INDSCAL valence weights and valence focus indices.
Table 8.
Correlations Between Individual Differences in Self-Report and Individual Differences in Semantic Structure: Study 3
| Variable | Valence INDSCAL weight | Arousal INDSCAL weight |
|---|---|---|
| Valence focus | ||
| Experience sampling | .28* | −.12 |
| Emotion inductions | .22* | −.23* |
| Arousal focus | ||
| Experience sampling | −.20* | .23* |
| Emotion inductions | .02 | .21* |
Note. INDSCAL = individual difference multidimensional scaling procedure.
p < .05.
General Discussion
If we want to know something about how a person is feeling, all we can do is ask them. There is currently no other way to study experiences of discrete emotional states like anger, sadness, fear, and so on. Our challenge as scientists is to determine whether self-report ratings are useful and valid indicators of what a person is experiencing. Because experience is an internal, subjective event, there is no way to measure what a person is “really” feeling and compare it to his or her report of that experience. When studying the experience of emotion via self-report, the only viable approach is to rule out explanations for the reporting behavior that we observe, other than that they follow directly from feelings. Once these explanations are ruled out, there is only one plausible explanation for the observed ratings: They reflect how people feel.
The purpose of this article was to examine the degree to which self-reports of experienced emotion are driven by the semantic understanding of words versus the phenomenological feelings. In this report, I carefully describe (a) individual differences in the structure of emotion language and (b) individual differences in their reports of experienced emotion and (c) examine the relation between the two.
The first step was to describe individual mappings of the language domain. This yielded the novel finding that there are individual differences in the cognitive structure of emotion language. People differ in the amount of attention they give to the valence-and arousal-related properties of emotion-related words when making similarity judgments about them. Some people focus more on the hedonic value of words than do others; some focus more on the level of activation denoted by words than do others. These semantic differences were reliable over a 60-day period and did not change much in response to ratings of emotional experience made during the intervening time. This last finding largely reduces the concern that attention to ongoing experience is largely shaping what people understand emotion words to mean. Consider that at every measurement instance in an experience-sampling paradigm, participants must introspect to assess their momentary experience and then attend to that experience to hold it in mind. They then report that feeling by rating each emotion adjective (happy, anxious, annoyed, etc.) on a Likert-type scale. Viewed in this way, it can be said that experience sampling prompts people to attend to their experience multiple times a day, across multiple days. If attention to emotional experience influences emotion language, then the structure of emotion language will look different after experience sampling than it did before. This was not the case, however.
Second, as in past research (Feldman, 1995a; Feldman Barrett, 1998), people differed in the extent to which they emphasized valence- and arousal-based information in their verbal reports of emotional experience. Some people reported their feelings with more pleasure and displeasure than did others. Some people reported their feelings with more activation and deactivation than did others. It was possible to examine the criterion validity of the focus estimates by comparing valence focus and arousal focus in experience-sampling reports to a second estimate using (a) a different set of experience-sampling reports (Study 1), (b) reports of experience in response to evocative slides (Study 2), and (c) reports of experience in response to laboratory inductions (Study 3). The findings demonstrated that estimates of valence focus and arousal focus were robust across different sets of items used in the reporting process (Study 1) and across different reporting contexts (Studies 2 and 3), thereby adding a crucial piece to this developing program of research.
Although not every emotion was sampled for estimates of focus computed in these studies, other findings give confidence that valence focus and arousal focus characterize propensities to focus on the properties of experience in a general sense and are not specifically linked to the emotions that are included in a specific set of computations. For example, estimates of valence focus and arousal focus computed without reference to anger feelings (similar to the focus estimates computed in Studies 1 through 3) were nonetheless related to the granularity in self-reports of anger, sadness, and nervousness (Feldman Barrett, 1998). Furthermore, compared with those lower in valence focus, individuals who were highly valence focused (when valence focus was computed using self-reports of anger) experienced more labile self-esteem in response to positive and negative interpersonal cues, providing evidence that individuals who are valence focused are more sensitive to evaluative cues around them (Feldman Barrett & Pietromonaco, 2004).
It might be argued that, although there was evidence of criterion validity for people’s focus on valence and arousal when reporting their experiences of emotion, the effect sizes were small for Studies 2 and 3, indicating that the evidence for validity is not very strong. This is certainly one way to view the findings. Consider, however, that the focus estimates used for validity purposes were based on 16 measurement moments (1 measurement instance for each slide) in Study 2 and only 6 measurement instances (1 for each induction) in Study 3 (as compared with literally hundreds of measurement moments in the experience-sampling procedures). It is very likely that the P-correlation matrices (from which the focus estimates were derived) in Studies 2 and 3 contained some instability because of these small within-subject sample sizes, which would, in turn, attenuate the size of the validity coefficients. Clearly, this is a matter for future research to address. Taking the within-subject sample size into account, however, suggests that the criterion validity estimates from Study 3 might be considered remarkable, in that valence focus and arousal focus demonstrated some validity even with only 6 samples of reported experience.
Most important, by comparing individual differences in emotion language to those in reports of experience, it is clear that how a person goes about rating his or her emotional experience reflects more than just how that person thinks about emotion words. True, there were small but inconsistent relationships between valence focus and the tendency to emphasize the hedonic meaning of emotion-related words. This relationship was stronger for arousal focus—as strong as the criterion validity coefficients reported in Studies 2 and 3. Yet the relation between the structure of language and the report of experience is not strong enough to clearly indicate that self-reports of experienced emotion are merely a reflection of emotion language. A further observation supports this claim: In all three studies, on average across individuals, semantic representations were dominated by arousal, but experiential reports were dominated by valence. Amid the individual differences in emphasis on valence and arousal, then, there was a different average pattern observed for the two types of ratings. People seemed to weigh the arousal-based properties of emotion words relatively more than the valence-based properties when making judgments of the words themselves (as evidenced by the fact that arousal dimensions are routinely the first and larger dimension in MDS solutions of similarity ratings for emotion words), yet they weighed valence-based properties relatively more when making judgments of their emotion experience using those words (consistent with the finding that valence dimensions tend to be larger than arousal dimensions in analyses of cross-sectional self-report ratings of experienced emotion; Feldman, 1995b). Taken together, these findings are an important piece of the puzzle that demonstrate that self-report ratings tell us more than just how a person understands emotion-related words.
Another piece of the puzzle would be a demonstration that valence focus and arousal focus, as characteristics of verbal representations of experienced emotion, are uniquely related to independent measures of psychological processes that are unrelated to individual differences in emotion language. Such investigations are currently underway in my laboratory, and we are beginning to see such evidence. For example, valence focus in reports of experienced emotion was related to a heightened sensitivity in the perceptual processing of facial expressions stimuli (Feldman Barrett & Niedenthal, in press). Individuals higher in valence focus showed an enhanced perceptual sensitivity to negative information contained in facial expressions of emotion, such that they perceived the onset of angry and sad facial expressions earlier than did those lower in valence focus. The tendency to attend to the valenced properties of emotion words was not related to this sensitivity. Furthermore, arousal focus in reports of experienced emotion was related to greater interoceptive sensitivity (as indexed by a heartbeat-detection task; Feldman Barrett et al., 2003). The tendency to attend to the activation-based properties of emotion words was not related to this sensitivity. Taken together, the growing evidentiary basis suggests that although self-report ratings might be influenced by individual differences in emotion vocabulary, they are not solely determined by them. Self-report ratings of emotional states are driven by the properties of the feelings that are being reported, such that people use what they know about emotion-related words to report core affective feelings of pleasure–displeasure and felt activation.
The evidence, though suggestive, is not conclusive. To confirm the hypothesis that valence focus and arousal focus are driven by feelings, it would be necessary to show (a) that individuals high in valence focus actually experience more affective feelings of pleasure and displeasure than do those who are low in valence focus, a similar demonstration would be necessary for arousal focus, and (b) that more intense and frequent experiences of affect influence how attention is allocated during the self-report process. The first question, whether individuals high in valence focus or arousal focus actually experience affect with greater frequency and intensity, presents the biggest stumbling block because it is not currently possible to directly measure emotional experiences separate from their verbal representation. The second question, in the absence of a decisive answer to the first, is no easier to deal with. What determines people’s focus of attention when reporting on their internal feeling states? Experimentally inducing affective experience would not answer the question, because it is not clear what would serve as an adequate manipulation check. Also, the problem of causal inference would remain. It could be that people attend to the valence- or arousal-based properties of their feelings because they have to focus on the valence- or arousal-based properties of all objects. This is probably not the case, because then one would have observed a stronger relationship between valence focus, arousal focus, and attention to the semantic properties of words in the studies presented here. It could be that people’s attention is focused by their beliefs about what they feel; this would be consistent with the view that verbal reports of experience are reports of people’s beliefs about what they feel and are not a window on their contents per se (e.g., Dennett, 1991). On this view, valence focus and arousal focus would merely indicate how a person focuses his or her attention during the reporting process. The cause of attention allocation would remain a mystery.
A simpler answer might be that the more people feel something, the more they attend to it. People will attend to feelings of pleasure and displeasure, thereby emphasizing that property to a greater extent when reporting their emotional experience, because their feelings are largely characterized as pleasant or unpleasant. People will attend to feelings of activation or deactivation, thereby emphasizing that property to a greater extent when reporting their feelings, because their feelings are largely characterized in discrete terms, and activation is an important (although not the only) property that distinguishes between distinct feeling states like anger and sadness. This is consistent with the view that the contents of awareness are largely congruent with the contents of consciousness (Chalmers, 1996).
At this stage, if scientists are to learn anything about the experience of emotion, the discoveries must be made in the absence of a clear, unambiguous measure of experience? So how should a science of emotional experience proceed? I argue that we should treat self-reports like any other behavior. We can extract and interpret the psychological information that they contain. In doing so, we have come closer to a formal understanding of what reports of experience do, and do not, tell us. This, according toFrith (2002, p. 374) is “a major program for 21st century science.” In this research, I have adopted the circumplex model and have shown how it can be a useful tool to extract and interpret the patterns contained in self-report behavior. The circumplex can describe the contents of verbally represented emotional experiences. It can be used to illustrate that emotion words have a largely different pattern when rated for similarity than when they are used to communicate emotional experiences. As a result, it is not completely tenable to argue that self-reports tell us more about emotion language than they do about emotional experience.
Finally, in principle, the contents of experience should be distinguished from the processes that generated them (Lambie & Marcel, 2002) as well as from the processes that are used to represent them. However, there is a history in social and personality psychology of using content to leverage knowledge about process (e.g., Wegner, 1994; Wenzlaff & Wegner, 2000). In the absence of an objective, external way to measure emotional experience, perhaps the best place to start is to offer evidence for what people feel by examining how they represent their feelings. Simply observing the patterns in what people say about their feelings over time will provide us with an empirical basis to begin understanding the processes by which people come to verbally represent their feelings and, perhaps someday, how they generate those feelings in the first place.
Acknowledgments
I thank Thyra Fossum, Tracey Madden, Eliza Bliss-Moreau, and Michele Tugade for their help in collecting the data used in the report. I am also grateful to Batja Mesquita and Wayne Bylsma for their helpful comments on the article. Preparation of this article was supported by National Institute of Mental Health Grant K02 MH001981 as well as by National Science Foundation Grants SBR-9727896 and BCS 0074688.
Footnotes
Patterning in autonomic activity does not correspond to specific emotions like anger, sadness, fear, and so on because it corresponds to perceived or expected metabolic demands that are associated with specific behaviors, which themselves are heterogeneous within each category of emotion (e.g., Fanselow & Lester, 1988; cf. Bradley, 2000; Lang, Bradley, & Cuthbert, 1990).
The term semantic is used throughout this report to refer to the source of the words’ definitions. “Semantic” knowledge refers to a corpus of impersonal, conceptual knowledge that is shared by members of the same culture (Tulving, 1972), as well as to semanticized episodic knowledge (Nadel & Moscovitch, 1998) consisting of ensembles of aggregated episodic memories that exist without reference to time and place. The term semantic is not used to refer to the content of the knowledge, as when some researchers distinguish between evaluative and semantic (i.e., nonevaluative) information.
Some of these data were used to address questions about accuracy and calibration in similarity ratings of emotion terms (Feldman Barrett & Fossum, 2001).
Fit of a solution is determined by producing a Fit × Dimensionality plot, in which a fit statistic (called stress) for each solution of a given dimensionality is plotted against the number of dimensions contained in each solution. The stress value indicates the extent of the solution’s departure from the observed data. Identifying the “elbow” in the Stress × Dimensionality plot indicates the optimal number of dimensions needed to represent the stimulus structure (rather like the use of the scree plot for identifying dimensionality in an exploratory factor analysis; Gorsuch, 1983). Because a two-dimensional solution was expected to provide the best fit to the data, it was important to estimate the fit of a one-dimensional MDS solution. The INDSCAL procedure will only produce solutions with two or more dimensions. To estimate the fit of a one-dimensional solution, nonmetric group Euclidean distance analyses were required. This MDS procedure produced identical stress values to the INDSCAL group solutions and was only for the purpose of assessing fit. The INDSCAL analyses were the main analyses of interest and are discussed in detail.
There is another way to compute valence focus and arousal focus. Each participant’s P-correlation matrix can be factor analyzed; the first two unrotated factors extracted are typically valence and arousal, and the size of each factor represents the variance in the self-report ratings accounted for by each property. The factor-analytic estimates of valence focus and arousal focus, although strongly related to the more externally based estimates (Feldman, 1995a; Feldman Barrett, 1998), are less optimal because they contain the usual ambiguities associated with factor analysis (such as factor identification).
Individual INDSCAL weights not only represent the importance of each dimension to each participant (relative to the group solution) but also contain information regarding the degree to which the solution fits each participant’s data (Young & Harts, 1994). Larger weights represent the relative importance of the dimension, but they also indicate a better fit of the analysis to the data (squared subject weights summed across dimensions equal the squared correlation for each participant). To ensure that the findings thus far were not due to differences in fit of the valence–arousal solution across participants, the squared correlation values for participants were entered as a covariate in a series of regression analyses to determine the unique relationship between valence focus and arousal focus indices (serving as the criteria) and dimension weights (serving as the predictors). When controlling for variations in overall fit, the pattern of results did not change: Dimension weights continued to predict arousal focus, but not valence focus.
After the 4 weeks of sampling participants’ experiences of emotion, we then sampled their use of emotion regulation strategies for 2 weeks. These data are not relevant to this report and so are not discussed further here.
References
- Arabie, P., Carroll, J. D., & DeSarbo, W. S. (1987). Three-way scaling and clustering Newbury Park, CA: Sage.
- Barber, S. (1990). Adagio for strings (sadness induction) [CD]. New York: Sony.
- Barrett, D., & Feldman Barrett, L. (1999). Experience-sampling program (ESP 2. 0). Retrieved April 30, 2004 from http://www2.bc.edu/~barretli/esp/
- Block J. Studies in the phenomenology of emotions. Journal of Abnormal and Social Psychology. 1957;54:358–363. doi: 10.1037/h0040768. [DOI] [PubMed] [Google Scholar]
- Bradley, M. M. (2000). Emotion and motivation. In J. T. Cacioppo, L. G. Tassinary, & G. G. Berntson (Eds.), Handbook of psychophysiology (pp. 602–642). New York: Cambridge University Press.
- Browne MW. Circumplex models for correlation matrices. Psychometrika. 1992;57:469–497. [Google Scholar]
- Bush LE. Individual differences multidimensional scaling of adjectives denoting feelings. Journal of Personality and Social Psychology. 1973;25:50–57. doi: 10.1037/h0034274. [DOI] [PubMed] [Google Scholar]
- Cacioppo, J. T. (2002, May). Built for pleasure: How mood and emotion reflect our hedonic instincts Keynote address presented at the 15th Annual Convention of the American Psychological Society, Atlanta, GA.
- Cacioppo, J. T., Berntson, G. G., Larsen, J. T., Poehlmann, K. M., & Ito, T. A. (2000). The psychophysiology of emotion. In M. Lewis & J. M. Haviland-Jones (Eds.), The handbook of emotion (2nd ed., pp. 174–191). New York: Guilford Press.
- Carroll JD, Chang JJ. Analysis of individual differences in multidimensional scaling via N-way generalization of “Eckart-Young” decomposition. Psychometrika. 1970;35:238–319. [Google Scholar]
- Chalmers, D. J. (1996). The conscious mind New York: Oxford University Press.
- Cohen D, Nisbett RE, Bowdle BF, Schwarz N. Insult, aggression, and the southern culture of honor: An “experimental ethnography. Journal of Personality and Social Psychology. 1996;70:945–960. doi: 10.1037//0022-3514.70.5.945. [DOI] [PubMed] [Google Scholar]
- Conner T, Feldman Barrett L, Bliss-Moreau E, Lebo K, Kaschub C. A practical guide to experience-sampling procedures. Journal of Happiness Studies. 2003;4:53–78. [Google Scholar]
- Davison, M. L. (1983). Multidimensional scaling Toronto, Ontario, Canada: Wiley.
- Dennett, D. (1991). Consciousness explained Boston: Little, Brown.
- Fabrigar LR, Visser PS, Browne MW. Conceptual and methodological issues in testing the circumplex structure of data in personality and social psychology. Personality and Social Psychology Bulletin. 1997;1:184–203. doi: 10.1207/s15327957pspr0103_1. [DOI] [PubMed] [Google Scholar]
- Fanselow, M. S., & Lester, L. S. (1988). A functional behavioristic approach to aversively motivated behavior: Predatory imminence as a determinant of the topography of defensive behavior. In R. C. Bolles & M. D. Beecher (Eds.), Evolution and learning (pp. 185–212). Hillsdale, NJ: Erlbaum.
- Fazio RH, Dunton BC. Categorization by race: The impact of automatic and controlled components of racial prejudice. Journal of Experimental Social Psychology. 1997;33:451–470. [Google Scholar]
- Feldman LA. Valence focus and arousal focus: Individual differences in the structure of affective experience. Journal of Personality and Social Psychology. 1995a;69:153–166. [Google Scholar]
- Feldman LA. Variations in the circumplex structure of emotion. Personality and Social Psychology Bulletin. 1995b;21:806–817. [Google Scholar]
- Feldman Barrett L. Discrete emotions or dimensions? The role of valence focus and arousal focus. Cognition and Emotion. 1998;12:579–599. [Google Scholar]
- Feldman Barrett L, Barrett DJ. Computerized experience-sampling: How technology facilitates the study of conscious experience. Social Science Computer Review. 2001;19:175–185. [Google Scholar]
- Feldman Barrett, L., & Bliss-Moreau, E. (2003). Valence focus and automatic evaluation Manuscript in preparation, Boston College.
- Feldman Barrett L, Fossum T. Mental representations of affect knowledge. Cognition and Emotion. 2001;15:333–364. [Google Scholar]
- Feldman Barrett, L., & Gross, J. J. (2001). Emotion representation and regulation: A process model of emotional intelligence. In T. Mayne & G. Bonnano (Eds.), Emotion: Current issues and future directions (pp. 286–310). New York: Guilford Press.
- Feldman Barrett L, Gross J, Christensen T, Benvenuto M. Emotion differentiation and regulation. Cognition and Emotion. 2001;15:713–724. [Google Scholar]
- Feldman Barrett, L., & Niedenthal, P. (in press). Valence focus and perceptual sensitivity to valenced cues. Emotion
- Feldman Barrett, L., & Pietromonaco, P. (2004). Valence focus and self-esteem lability Manuscript in preparation, Boston College.
- Feldman Barrett, L., Quigley, K., Bliss-Moreau, E., & Aronson, K. R. (2003). Interoceptive sensitivity and self-reports of emotional experience Manuscript submitted for publication. [DOI] [PMC free article] [PubMed]
- Fredrickson, B. L., & Branigan, C. (in press). Positive emotions broaden the scope of attention and thought-action repertoires. Cognition and Emotion [DOI] [PMC free article] [PubMed]
- Frijda, N. H., Markam, S., Sato, K., & Wiers, R. (1995). Emotion and emotion words. In J. A. Russell, J. M. Fernández-Dols, A. S. R. Manstead, & J. C. Wellenkamp (Eds.), Everyday conceptions of emotion (pp. 121–143). New York: Kluwer Academic.
- Frith C. How can we share experiences? Trends in Cognitive Science. 2002;6:374. doi: 10.1016/s1364-6613(02)01978-2. [DOI] [PubMed] [Google Scholar]
- Gorsuch, R. L. (1983). Factor analysis (2nd ed.). Hillsdale, NJ: Erlbaum.
- Guttman, L. (1957). A new approach to factor analysis: The radex. In P. F. Lazarsfeld (Ed.), Mathematical thinking in the social sciences (pp. 258–348). New York: Columbia University Press.
- Halberstadt JB, Niedenthal PM. Emotional state and the use of stimulus dimensions in judgment. Journal of Personality and Social Psychology. 1997;72:1017–1033. doi: 10.1037//0022-3514.72.5.1017. [DOI] [PubMed] [Google Scholar]
- James, K. (Writer), & K. James, P. Miller, K. Rickabaugh, J. Sussman (Executive Producers). (2001, July). Sweat the small stuff [television broadcast]. New York: Comedy Central.
- Keltner D, Edwards K, Ellsworth PC. Beyond simple pessimism: Effects of sadness and anger on social perception. Journal of Personality and Social Psychology. 1993;64:740–752. doi: 10.1037//0022-3514.64.5.740. [DOI] [PubMed] [Google Scholar]
- Kring AM, Feldman Barrett L, Gard D. On the broad applicability of the affective circumplex: Representations of affective knowledge among schizophrenia patients. Psychological Science. 2003;14:207–214. doi: 10.1111/1467-9280.02433. [DOI] [PubMed] [Google Scholar]
- Krumhansl CL. An exploratory study on musical emotions and psychophysiology. Canadian Journal of Experimental Social Psychology. 1997;51:336–352. doi: 10.1037/1196-1961.51.4.336. [DOI] [PubMed] [Google Scholar]
- Krumhansl CL. Music: A link between cognition and emotion. Current Directions in Psychological Science. 2002;11:45–50. [Google Scholar]
- Lambie JA, Marcel AJ. Consciousness and the varieties of emotion experience: A theoretical framework. Psychological Review. 2002;109:219–259. doi: 10.1037/0033-295x.109.2.219. [DOI] [PubMed] [Google Scholar]
- Lang PJ, Bradley MM, Cuthbert BN. Emotion, attention, and the startle reflex. Psychological Review. 1990;97:377–395. [PubMed] [Google Scholar]
- Lang, P. J., Ohman, A., & Vaitl, D. (1988). The International Affective Picture System [photographic slides]. Gainesville: Center for Research in Psychophysiology, University of Florida.
- Larsen RJ, Diener E. Promises and problems with the circumplex model of emotion. Review of Personality and Social Psychology. 1992;13:25–59. [Google Scholar]
- Nadel L, Moscovitch M. Hippocampal contributions to cortical plasticity. Neuropharmacology. 1998;37:431–439. doi: 10.1016/s0028-3908(98)00057-4. [DOI] [PubMed] [Google Scholar]
- Nosofsky RM. Attention, similarity, and the identification-categorization relationship. Journal of Experimental Psychology: General. 1986;115:39–57. doi: 10.1037//0096-3445.115.1.39. [DOI] [PubMed] [Google Scholar]
- Nosofsky RM. Similarity scaling and cognitive process models. Annual Review of Psychology. 1992;43:25–53. [Google Scholar]
- Ortony, A., Clore, G. L., & Collins, A. (1988). The cognitive structure of emotions New York: Cambridge University Press.
- Redfield, S. M. (1995). Joy of meditating New York: Warner Books.
- Reeve J. The interest–enjoyment distinction in intrinsic motivation. Motivation & Emotion. 1989;13:83–103. [Google Scholar]
- Reeve J. The face of interest. Motivation & Emotion. 1993;17:353–375. [Google Scholar]
- Rosen VM, Engle RW. The role of working memory capacity in retrieval. Journal of Experimental Psychology: General. 1997;126:211–227. doi: 10.1037//0096-3445.126.3.211. [DOI] [PubMed] [Google Scholar]
- Russell JA. A circumplex model of affect. Journal of Personality and Social Psychology. 1980;39:1161–1178. doi: 10.1037//0022-3514.79.2.286. [DOI] [PubMed] [Google Scholar]
- Russell JA. Pancultural aspects of the human conceptual organization of emotions. Journal of Personality and Social Psychology. 1983;45:1281–1288. [Google Scholar]
- Russell JA, Bachorowski J, Fernández-Dols J. Facial and vocal expressions of emotion. Annual Review of Psychology. 2003;54:329–349. doi: 10.1146/annurev.psych.54.101601.145102. [DOI] [PubMed] [Google Scholar]
- Russell JA, Feldman Barrett L. Core affect, prototypical emotional episodes, and other things called emotion: Dissecting the elephant. Journal of Personality and Social Psychology. 1999;76:805–819. doi: 10.1037//0022-3514.76.5.805. [DOI] [PubMed] [Google Scholar]
- Russell JA, Lewicka M, Niit T. A cross-cultural study of a circumplex model of affect. Journal of Personality and Social Psychology. 1989;57:848–856. [Google Scholar]
- Russell JA, Ridgeway D. Dimensions underlying children’s emotion concepts. Developmental Psychology. 1983;19:795–804. [Google Scholar]
- Shepard, R. N. (1978). The circumplex and related topological manifolds in the study of perception. In S. Shye (Ed.), Theory construction and data analysis in the behavioral sciences (pp. 29–80). Washington, DC: Jossey-Bass.
- Shepard RN. Toward a universal law of generalization for psychological science. Science. 1987 September;237:1317–1323. doi: 10.1126/science.3629243. [DOI] [PubMed] [Google Scholar]
- Smith ER, Zarate MA. Exemplar-based models of social judgment. Psychological Review. 1992;99:3–21. [Google Scholar]
- Takane Y, Young F, DeLeeuw J. Nonmetric individual differences multidimensional scaling: An alternating least squares method with optimal scaling features. Psychometrika. 1976;42:7–67. [Google Scholar]
- Tulving, E. (1972). Episodic and semantic memory. In E. Tulving & W. Conaldson (Eds.), Organization of memory (pp. 381–403). New York: Academic Press.
- Turner ML, Engle RW. Is working memory capacity task dependent? Journal of Memory & Language. 1989;28:127–154. [Google Scholar]
- Tversky A. Features of similarity. Psychological Review. 1977;76:31–48. [Google Scholar]
- Watson, D., & Clark, L. A. (1994). Manual for the Positive Affect and Negative Affect Schedule (expanded form) Unpublished manuscript, University of Iowa.
- Watson D, Tellegen A. Toward a consensual structure of mood. Psychological Bulletin. 1985;98:219–235. doi: 10.1037//0033-2909.98.2.219. [DOI] [PubMed] [Google Scholar]
- Wegner DM. Ironic processes of mental control. Psychological Review. 1994;101:34–52. doi: 10.1037/0033-295x.101.1.34. [DOI] [PubMed] [Google Scholar]
- Weir, P. (Director). (1985). Witness [Film]. Los Angeles: Paramount Studios.
- Wenzlaff RM, Wegner DM. Thought suppression. Annual Review of Psychology. 2000;51:59–91. doi: 10.1146/annurev.psych.51.1.59. [DOI] [PubMed] [Google Scholar]
- Young, F. W., & Harts, H. (1994). Multidimensional scaling. In M. J. Norusis (Ed.), SPSS professional statistics, 6.1 (pp. 155–222). Chicago: SPSS.