

Abstract
The oxidation of 11-cis-retinol to 11-cis-retinal in the retinal pigment epithelium (RPE) represents the final step in a metabolic cycle that culminates in visual pigment regeneration. Retinol dehydrogenase 5 (RDH5) is responsible for a majority of the 11-cis-RDH activity in the RPE, but the formation of 11-cis-retinal in rdh5−/− mice suggests another enzyme(s) is present. We have previously shown that RDH11 is also highly expressed in RPE cells and has dual specificity for both cis- and trans-retinoid substrates. To investigate the role of RDH11 in the retinoid cycle, we generated rdh11−/− and rdh5−/− rdh11−/− mice and examined their electrophysiological responses to various intensities of illumination and during dark adaptation. Retinoid profiles of dark-adapted rdh11−/− mice did not show significant differences compared with wild-type mice, whereas an accumulation of cis-esters was detected in rdh5−/− and rdh5−/− rdh11−/− mice. Following light stimulation, 73% more cis-retinyl esters were stored in rdh5−/− rdh11−/− mice compared with rdh5−/− mice. Single-flash ERGs of rdh11−/− showed normal responses under dark- and light-adapted conditions, but exhibited delayed dark adaptation following high bleaching levels. Double knockout mice also had normal ERG responses in dark- and light-adapted conditions, but had a further delay in dark adaptation relative to either rdh11−/− or rdh5−/− mice. Taken together, these results suggest that RDH11 has a measurable role in regenerating the visual pigment by complementing RDH5 as an 11-cis-RDH in RPE cells, and indicate that an additional unidentified enzyme(s) oxidizes 11-cis-retinol or that an alternative pathway contributes to the retinoid cycle.
In retinal photoreceptors, a photon of light isomerizes 11-cis-retinal to all-trans-retinal, a reaction that initiates a signal transduction cascade culminating in a visual sensation (1–3). Both rod and cone opsin visual pigments contain the light-absorbing chromophore 11-cis-retinal (4). Vision is sustained through biochemical reactions involving the regeneration of isomerized chromophores in rod and cone photoreceptors in a multistep retinoid cycling pathway (reviewed in Refs. 5 and 6). The mechanism to regain light sensitivity is not completely understood, but it has been proposed to involve two distinct pathways, one for cone and the other for rod photoreceptors (7). Both pathways ultimately regenerate 11-cis-retinal conjugated to opsins by a retinylidene bond. However, cone visual pigments are regenerated much faster than rhodopsin in rods (reviewed by McBee et al. (5)). To complete the visual cycle, photoisomerized all-trans-retinal is first reduced to all-trans-retinol within the photoreceptors. This reaction is followed by the movement of all-trans-retinol to the retinal pigment epithelium (RPE)1 for storage in retinosomes as all-trans-retinyl esters (8, 9), which are available for isomerization to 11-cis-retinol. The final reaction in the pathway involves oxidation of 11-cis-retinol to 11-cis-retinal and movement of the chromophore back to the photoreceptors (Fig. 1).
Fig. 1. Chemistry of the retinoid cycle reactions in the vertebrate retina.
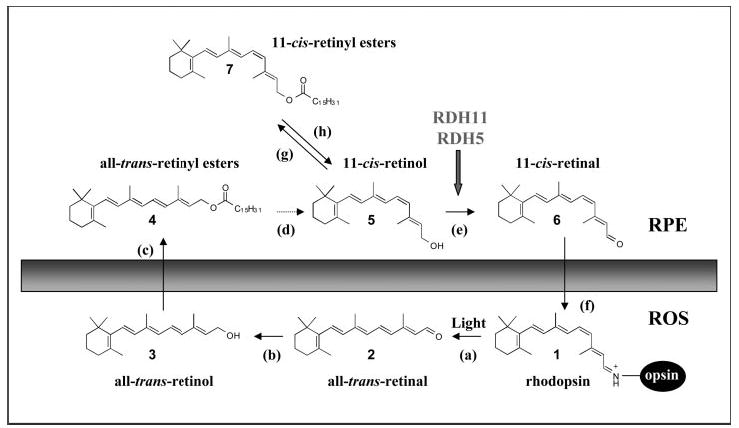
The retinoid cycle reactions were reviewed recently (5). In the ROS, light causes the isomerization (reaction a) of the rhodopsin chromophore, 11-cis-retinylidene (1), to all-trans-retinylidene. All-trans-retinal (2) is hydrolyzed and then reduced (reaction b) in the reaction catalyzed by all-trans-retinal-specific RDH(s). All-trans-retinol (3) diffuses to RPE where it is esterified by LRAT (reaction c) to all-trans-retinyl esters (4). All-trans-retinyl esters can be hydrolyzed by a yet unidentified retinyl hydrolase (reaction d) generating all-trans-retinol. Next, the pathway branches and all-trans-retinol, or its derivative, is isomerized to 11-cis-retinol (5) in a reaction that involves an abundant RPE protein, termed RPE65 (poorly defined reaction d). 11-cis-retinol is then oxidized by 11-cis-RDH (RDH5, RDH11) and other dehydrogenases (13) to 11-cis-retinal (6) (reaction e) to complete the cycle. In the dark, under conditions of low 11-cis-retinal utilization, 11-cis-retinol can also be esterified by LRAT to form 11-cis-retinyl esters (7) (reaction g). With chromophore depletion, hydrolysis of 11-cis-retinyl esters by retinyl ester hydrolase (REH) occurs (reaction h) (60). 11-cis-retinal diffuses across the extracellular space (reaction f), is taken up by the outer segment, and recombines with aporhodopsin to regenerate rhodopsin.
The importance of the retinoid cycle for the development and maintenance of normal vision has prompted efforts to identify the critical enzymes and cofactors responsible for regulating each reaction of the cycle. Hereditary mutations in key regulatory enzymes involved in this pathway underlie a range of disorders from mild visual acuity problems to severe retinal dystrophies (see Retnet at www.sph.uth.tmc.edu). Although the enzymatic components of many retinoid cycle reactions are well characterized, the key mediator(s) for 11-cis-retinol oxidation to 11-cis-retinal remains to be identified. Leading candidates include one or more of the retinol dehydrogenase (RDH) enzymes, a subfamily of the short chain dehydrogenase/reductase (SDR) superfamily. RDH5 is expressed in RPE cells and has been shown to oxidize 11-cis-retinol in vitro. Mutations in the RDH5 gene have been linked to the clinical diagnosis of fundus albipunctatus and are associated with delayed dark adaptation (10). However, rdh5−/− mice display no retinal degeneration and have normal dark adaptation kinetics at bleaching levels that cause a delay in patients with fundus albipunctatus (11, 12). This finding indicates that there are other RDH enzymes that facilitate retinol oxidation in the RPE.
We have recently identified additional members of the RDH family that are expressed in the eye and exhibit the ability to catalyze reduction/oxidation reactions involving retinoids (13). One of these enzymes, RDH11, was initially designated as prostate short chain dehydrogenase reductase 1 (PSDR1) based on its hallmark SDR protein motifs and its high transcript expression level in the human prostate (14). Subsequently RDH11 was identified as a gene regulated by sterol regulatory element-binding protein (SREBP), a transcription factor that functions to coordinately regulate the expression of enzymes involved in cholesterol and fatty acid synthesis (15). SDR enzymes also utilize steroids including RDH5. RDH11, however, lacks reactivity with steroid substrates but reduces other short chain aldehydes such as nonanal and 4-hydroxy-2-nonenal (15). RDH5 has NADH cofactor specificity and is more efficient in oxidizing retinols rather than reducing retinals in vitro (16). In contrast, RDH11 has NADPH specificity and catalyzes the reduction of retinals ~50-fold more efficiently than it does the oxidation of retinol in vitro (17). However, the in vivo substrate of RDHs might depend upon the relative concentration of substrates in the immediate environment, and several lines of evidence indicate that RDH11 can have 11-cis-RDH activity in the RPE. First, RDH11 is expressed in RPE cells. Second, the remaining enzymatic activity in rdh5−/− RPE exhibited NADPH cofactor specificity and reduced all-trans-, 9-cis-, and 11-cis-retinal (11, 18). Third, the residual 11-cis-RDH activity in the rdh5−/− RPE was membrane-associated (18), a characteristic consistent with the known subcellular localization of RDH11 (19).
In this study, we examine the physiological role of RDH11 and in particular its role in the visual retinoid cycle by generating and characterizing mice with a targeted deletion of the rdh11 gene (rdh11−/−) and combined deletions of RDH5 and RDH11 (rdh5−/− rdh11−/−). Electrophysiological and biochemical measurements demonstrate that RDH11 plays a minor but complementary role to RDH5 in the flow of retinoids and thus in dark adaptation. Analyses of the rdh5−/− rdh11−/− mice reveal the existence of additional enzymes in the retina with 11-cis-RDH(s) activity, or the presence of an alternative pathway capable of generating the visual pigment.
MATERIALS AND METHODS
Animals
All animal experiments employed procedures approved by the Fred Hutchinson Cancer Research Center and the University of Washington Animal Care Committees, and conformed to recommendations of the American Veterinary Medical Association Panel on Euthanasia and recommendations of the Association of Research for Vision and Ophthalmology. Animals were maintained in complete darkness, and all manipulations were done under dim red light employing a Kodak No. 1 Safelight filter (transmittance >560 nm).
Construction of Targeting Vector
A probe containing nucleotides 913–1213 of the mouse rdh11 cDNA was used to isolate the rdh11 genomic clone containing exons 2 to 7 from a 129S4 mouse library (P. Soriano, Fred Hutchinson Cancer Research Center, Seattle, WA). The genomic region between exon 1 and 2 was PCR amplified using primers O1, 5′-GTTTTCCCAGTCACGACGAACCGGGGTGTGTCTAGGAT-3′ and -O2, 5′ AGGAAACAGCTATGACCATCCGGGAAGCTGAACATTA-GA-3′ (Fig. 2) and the KOD XL polymerase (Novagen, Madison, WI). The targeting vector was generated by PCR using KOD HiFi polymerase (Novagen). The 5′-arm was generated by amplifying a 1.8-kb fragment using primers O3, 5′-AGAAGTCCGCGGCACGTGGT-CAAAGGATGGTTTC-3′ and O4, 5′-AAGTGCGGCCGCATGCTTGCC-TCTAAGCCTGTTG-3′, and an equivalent length 3′-arm was amplified using primers O5, 5′-AAGTGTCGACTCAGAACTCAATAGGGGCTTG-G-3′ and O6, 5′-AGTAAGCTTTGTGTAGGCAGAACGTGAAGCA-3′. The 5′-arm was subcloned into the NotI and SacII restriction sites of pPGKneolox2 DTA.2 (P. Soriano) whereas the 3′-arm was subcloned into the HindIII and SalI sites. Neomycin (neo) was used for positive selection and diphtheria toxin A-fragment (DTA) was used for negative selection.
Fig. 2. Generation of the rdh11 knock-out mouse.
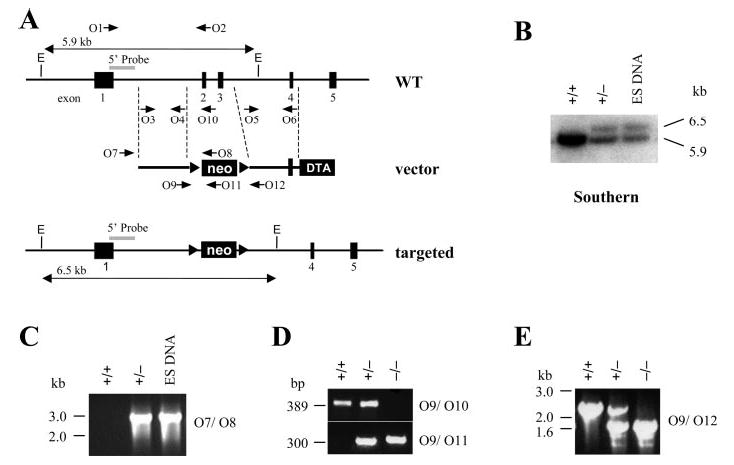
A, schematic diagram of rdh11 genomic organization of exons (black rectangles) 1 to 5, the targeting vector with neomycin (neo) and diphtheria toxin A-fragment (DTA) genes, and the targeted allele resulting from a homologous recombination event that replaces exons 2 and 3 with neomycin. EcoRV (E) restriction enzyme digested genomic fragments are indicated for the WT (5.9 kb) and targeted (6.5 kb) alleles, and the 5′ Southern probe flanking the targeting vector arm is shown as a gray box. Arrows O1 to O12 indicate PCR primers. B, Southern blot analysis with a 5′-probe (gray). C, PCR analysis of targeted ES DNA and WT (+/+) or heterozygous (+/−) mouse tail DNA. Primers O7/O8 amplify a 2.8-kb fragment from the targeted allele but not from the WT mice. D and E, PCR genotyping of WT (+/+), heterozygous (+/−), and homozygous null (−/ −) tail DNA with the indicated primer sets. Primers O9/O10 produce a 389-bp fragment from the WT allele and O9/O11 produce a 300-bp fragment from the targeted allele. Primers O9/O12 generate fragments of 1.6 kb for (+/+), 1.6 kb and 2.4 kb for (+/−), and a 2.4-kb fragment for (−/ −).
Homologous Recombination and Genotyping
Targeting vector was linearized with SacII and electroporated into R1_129 embryonic stem (ES) cells (20), and colonies were selected in 300 μg/ml G418 for 9 days. Homologous recombination events were screened by Southern blotting and PCR using primers O7, 5′-AGGAGGGTTGCACTTTTT-GCTCTCT-3′ and O8, 5′-GCCCAGTCATAGCCGAATAGCCTCT-3′ (Fig. 2A), which hybridized to the genomic sequence outside of the targeting arm construct and within the neo gene, respectively. Positive clones were microinjected into C57BL6 blastocysts and the resulting male chimeric mice were screened for germline transmission. Genotyping by PCR analysis was carried out using primers O9, 5′- ACTATG-GCGTGCATGTGGAAGT-3′ and O10, 5′-TCTCCTTCCCAATGCCT-GTG-3′ for wild-type (WT) (389 bp) and O9 and O11, 5′-GCTAAAGCGCATGCTCCAGA-3′ for targeted deletion (300 bp). The PCR product with primers O9 and O11 was cloned and sequenced to verify proper targeting of rdh11. A second PCR analysis with primers O9 and O12, 5′-GGACCCTACCCTTCTGCAACTG-3′ was used to determine WT (1.6 kb), heterozygous (1.6 and 2.4 kb), and homozygous (2.4 kb) genotypes.
RDH5 mice were previously generated and characterized by Drs. Carola A. G. G. Driessen and Jacques J. M. Janssen (18, 21). Genotypes of RDH5 mice were determined by PCR using primers, KORDH-s1, 5′-GGGCAGCTGCAGTCTGCACCATC-3′ and KORDH-a1 5′-GGGCA-AGACCTGACCTGGGGGC-3′, which produced a 2.9-kb fragment for the WT allele and a 1.5-kb fragment for the disrupted allele.
Southern Blotting
Genomic tail or ES cell DNA was digested overnight with EcoRV and electrophoresed on a 0.7% agarose gel. DNA samples were transferred onto a nylon membrane by capillary method. The membrane was incubated with a 700-bp DNA probe amplified with primers P13, 5′-ATAAGTCCCGCTGTCCTCTT-3′ and P14, 5′-TCTC-CTGGCTCCTAGTAATCTAA-3′ and was subsequently labeled with [α-32P]dCTP using the random primer labeling kit (Stratagene, La Jolla, CA).
Real-Time Quantitative PCR
RNA was TRIzol-extracted from liver and brain according to the manufacturer’s protocol. 5 μg of RNA was used to generate the cDNA using 0.14 mm oligo-dT (22-mer) primer and 0.2 mm of each dNTP and Superscript II reverse transcriptase (Invitrogen). Real-time PCR was carried out in triplicate for each sample using SYBR green PCR master mix (Applied Biosystems, San Francisco, CA), 0.2 μm of each primer, and 8 ng of cDNA. The PCR protocol used was 95 °C for 10 min followed by 40 cycles of 95 °C for 15 s, 60 °C for 30 s, and 72 °C for 30 s. PCR was performed and analyzed using an ABI Prism 7700 sequence detector. Mouse RDH11-14 gene expression was normalized to S16 expression. PCR without cDNA templates did not produce significant amplification products. Specificity of the primers was verified by the amplification of a single PCR product, which was determined by observing a single dissociation curve from each tissue. Primers for the real-time PCR are the following: mRDH11_F 5′-ACCAAGAGCACATGG-GTAGC-3′, mRDH11_R 5′-CTCATCAGTCCTGGGTGCTT-3′; mRDH-12_F 5′-CCAGGAACTCCTACCTGCTG-3′, mRDH12_R 5′-ACCCACAT-CCTCTTGCAGTC-3′; mRDH13_F 5′-GAGGAGCGAGTAGACATTCTG-G-3′, mRDH13_R 5′-CCAGGGACGAGAGATTGATG-3′; mRDH14_F 5′-TGGTCAGGAATGGCATGTTG-3′, mRDH14_R 5′-GCATGATTGCGGC-TAGACTG-3′; mS16_F 5′-AGGAGCGATTTGCTGGTGTGGA, mS16_R 5′-GCTACCAGGCCTTTGAGATGGA-3′.
Immunoblotting
Mouse testes were solubilized in 6 volumes (w/v) of T-PER tissue protein extraction buffer (Pierce Biotechnology). 30 μg of protein extract was separated on a 10% SDS-polyacrylamide gel and electrophoretically transferred onto 0.2-μm polyvinylidene difluoride membranes (Invitrogen). For immunoblotting, membranes were blocked in PBS containing 0.1% Tween (PBST) and 5% milk (PBSTM) and labeled with an anti-RDH11 polyclonal antibody (2479) diluted to 1:5000 in PBSTM. After washing membranes with PBST, blots were incubated with goat anti-rabbit IgG conjugated to horseradish peroxidase (Pierce) at 1:10,000 dilution, and antibody labeling was detected by chemiluminescence (Pierce). Anti-RDH11 polyclonal antibody was generated against the C-terminal peptide LWDVSCDLLGLPVDW conjugated to keyhole limpet hemocyanin by Genemed Synthesis Inc. (San Francisco, CA). Protein concentration was determined by the Bradford assay (Bio-Rad) using bovine serum albumin (Pierce) as the standard.
Analyses of Retinoids
All experimental procedures related to extraction, derivatization, and separation of retinoids from dissected mouse eyes were carried out as described previously (22–24). All reactions involving retinoids were carried out under dim red light. Retinoids were separated by normal phase HPLC (Beckman, Fullerton, CA, Ultrasphere-Si, 4.6 μ 250 mm) with 10% ethyl acetate and 90% hexane at a flow rate of 1.4 ml/min with detection at 325 nm, using an HP1100 HPLC with a diode array detector and HP Chemstation A.03.03 software.
Electroretinograms (ERGs)
Prior to recording, mice were dark-adapted overnight. Under safety light, mice were anesthetized by intraperitoneal injection using 20 μl/g body weight of 6 mg/ml ketamine and 0.44 mg/ml xylazine diluted with 10 mm sodium phosphate (pH 7.2) containing 100 mm NaCl. The pupils were dilated with 1% tropicamide. A contact lens electrode was placed on the eye, and a reference electrode and ground electrode were placed in the ear and on the tail. ERGs were recorded with the universal testing and electrophysiologic system UTAS E-3000 (LKC Technologies, Inc. Gaithersburg, MD). The light intensity was calibrated by the manufacturer and computer-controlled. The mice were placed in a Ganzfeld chamber, and scotopic and photopic responses to flash stimuli were each obtained from both eyes simultaneously.
Single Flash Recording
Flash stimuli had a range of intensities (−3.7–2.8 log cd·sμm−2), and white light flash duration was adjusted according to intensity (from 20 μs to 1 ms). 3–5 recordings were made with >10-s intervals, and for higher intensity intervals, intervals were 10 min or as indicated. There were no significant differences between the first and the fifth flash. Light-adapted responses were examined after bleaching at 1.4 log cd·m−2 for 15 min. Typically, four to eight animals were used for the recording of each point in all conditions.
Double Flash Recording
The protocol was followed as previously published with some modifications (25). A test flash was delivered to suppress the circulating current of the rod photoreceptors. The recovery of this current was monitored by delivering a second flash, termed the probe flash. The interval time between two flashes varied from 200 to 2000 ms. The intensity of the test flash and probe flash was 0.4 and 1.6 log cd·s·m−2, respectively. Each trial was performed separately with 120-s interval time for dark adaptation. The amplitude of the probe flash alone was confirmed throughout the experiment to ensure that this time was sufficient. These probe flashes were also used to normalize the response of probe flashes following a test flash. The normalized amplitude of the probe flash a-wave versus the time between two flashes was plotted and fit by the linear regression algorithm in the SigmaPlot 2002 ver. 8.02 program.
Dark Adaptation After Intense Constant Illumination
Mice were dark-adapted overnight and then bleached with the background light of a Ganzfeld chamber (500 cd·m−2) for 3 min. After the light was turned off, a single-flash ERG at −0.2 cd·s·m−2 was used to monitor recovery of a-wave amplitude every 5 min for 60 min. The recovery ratio was calculated by normalizing single flash a-wave amplitude responses at various times following bleaching to the WT dark-adapted a-wave response at the identical flash intensity of −0.2 cd·s·m−2. The recovery ratio versus time after bleaching was plotted and fit by the linear regression algorithm in the Sigma Plot 2002 ver. 8.02 program. Leading edges of the ERG responses were fitted with a model of rod photorecep-tor activation as described previously (23). Statistical analysis was carried out using the one-way ANOVA test.
Transmission Electron Microscopy (EM)
For transmission EM, mouse eyecups were fixed primarily in 2.5% glutaraldehyde and 1.6% paraformaldehyde in 0.08 m PIPES, pH 7.4, containing 2% sucrose, initially at room temperature for ~1 h then at 4 °C for 24 h. The eyecups were then washed with 0.13 m sodium phosphate, pH 7.3, and post-fixed with 1% osmium tetroxide in 0.1 m sodium phosphate, pH 7.3, for 1 h at room temperature. The eyecups were dehydrated through a methanol series and transitioned to the epoxy embedding medium with propylene oxide. The eyecups were embedded for sectioning in Eponate 812. Ultrathin sections (60–70 nm) were stained with aqueous saturated uranium acetate and Reynold’s formula lead citrate prior to viewing with a Philips CM10 EM.
RESULTS
Generation of rdh11 Knock-out Mice
To determine the physiological role of RDH11, we generated rdh11−/− -null mice by deleting exons 2 and 3 through homologous recombination (Fig. 2A). Exon 2 contains the NADP(H)-binding site, which is essential for enzyme activity. If the short transcript for exon 1 is stably expressed, it will produce a 22-amino acid long peptide. Alternative splicing of exon 1 to exons 4, 5, 6, or 7 creates a frameshift resulting in a premature stop codon. Southern blotting and PCR analysis identified embryonic stem (ES) cell clones with the proper homologous recombination event for germline transmission. Southern blotting probed with the 5′-fragment derived from the rdh11 gene labeled the anticipated DNA fragment sizes of 5.9 kb for the WT allele and 6.5 kb for the targeted allele (Fig. 2B). PCR screening with a primer outside the targeting vector arm and another within the neo gene verified the Southern results (Fig. 2C). Of three male chimeras with 80–90% agouti coat color, one had germline transmission of the mutant rdh11 allele. All the experiments in this report used mice originating from this ES cell clone. Crosses of heterozygous rdh11+/−mice produced offspring with genotypes in accordance with expected Mendelian ratios (Fig. 2, D and E). Breeding of homozygous rdh11−/− mice produced average litter sizes (~7–10 pups) and the offspring had normal survival and growth, indicating that rdh11−/− mice are fertile and healthy. Besides the retina, RDH11 is highly expressed in the liver and testes. At 2 months of age, tissues of rdh11−/− mice exhibited no histological differences grossly or upon microscopic analysis of hematoxylin- and eosin-stained tissues in comparison with organs from WT mice (data not shown).
Relative to WT mice, immunoblotting analysis demonstrated the loss or reduction of RDH11 protein in testes from rdh11−/− or rdh11+/−mice, respectively (Fig. 3A). Quantitative PCR results of rdh11 mRNA expression were concordant with the protein level for RDH11 (Fig. 3B). Rdh11 transcripts were not detected in rdh11−/− liver but were measured in liver tissue from rdh11+/−and rdh11+/+ mice. Expression levels of rdh11 homologues, rdh12, 13, and 14, were analyzed to ensure that rdh11 on chromosome 12 was targeted and not the homologues. Rdh12, which is located ~16 kb from rdh11 on chromosome 12, has the same intron-exon genomic organization and shares 43% nucleotide identity with rdh11. Transcripts of rdh11 homologues exhibited similar expression levels in the livers of different rdh11 genotypes (Fig. 3B), indicating the correct targeted disruption of rdh11 and a lack of transcriptionally based compensation for the loss of rdh11.
Fig. 3. Expression of RDH11 and homologues.

A, immunoblotting analysis of testes protein extract from WT (+/+), heterozygous (+/−), and homozygous (−/ −) mice using an anti-RDH11 polyclonal antibody. B, real-time quantitative PCR analysis of rdh11, 12, 13, and 14 transcript expression, using total RNA from liver of WT (+/+), heterozygous (+/−), and homozygous (−/−) mice. Each gene was analyzed separately and the transcript expression level was relative to that in the WT, which was set at 100%. *, cross-reactive protein with the antibody in the mouse extracts.
Retinoid Analysis
To investigate the in vivo role of RDH11 in vertebrate retinoid cycling between photoreceptors and RPE cells, retinoid levels in the eyes of WT, rdh11−/−, rdh5−/−, and rdh5−/− rdh11−/− mice were measured 48 h after dark adaptation, or 15 min after a probe flash. Typical HPLC separation profiles of retinoids are illustrated in Fig. 4. In dark-adapted conditions rdh11−/− eyes had similar levels of retinoids relative to those in WT mice. Relative to WT mice, rdh5−/− mice had elevated levels of 11/13-cis-retinyl esters, which further increased 15 min after a single light flash that photoactivated ~35% of rhodopsin (24) (Fig. 4, peaks 1 and 2 and Table I), in agreement with previously published data (11, 18). The separation of 13-cis- from 11-cis-retinyl esters was particularly challenging, and only partial separation of these esters was accomplished (identified by characteristic UV/visible spectra). Interestingly, after a flash probe, rdh5−/− rdh11−/− mice had even greater amounts of 11/13-cis-retinyl esters relative to those in rdh5−/− mice (Fig. 4, peaks 1 and 2). Conversely, after the first critical 15 min of dark adaptation, the 11-cis-retinal chromophore regenerated with similar kinetics in all the mice. The ratios for all-trans-retinal/11-cis-retinal (pmol/eye) are WT 31.3 ± 3.3%, rdh11−/− 28.3 ± 3.2%, rdh5−/− 29.2 ± 3.1%, and rdh5−/− rdh11−/− 32.7 ± 3.8%.
Fig. 4. Chromatographic separation of non-polar retinoids from mice of different genetic backgrounds used in this study.

Retinoids were extracted from the eye and separated on normal-phase HPLC. The peaks correspond to the following retinoids: 1, 13-cis-retinyl esters; 2, 11-cis-retinyl esters; 3, all-trans-retinyl esters; 4, 4′, syn- and anti-11-cis-retinal oximes; 5, 5′, syn- and anti-all-trans-retinal oximes; 6, 11-cis-retinol; 7, all-trans-retinol. *, artifact related to a change in the solvent composition.
Table I. Retinoid contents in dark-adapted mice from different genetic backgrounds.
Mice were dark-adapted for more than 48 h. The results are presented with S.E., and n was between 3 and 5.
| Retinoid | WT | rdh11−/− | rdh5−/− | rdh5−/−rdh11−/− |
|---|---|---|---|---|
| pmol/eye | pmol/eye | pmol/eye | pmol/eye | |
| 11/13-cis-Retinyl estersa | 18.8 ± 1.3 | 17.7 ± 0.5 | 189.6 ± 48.2 | 186.4 ± 34.5 |
| all-trans-Retinyl esters | 80.2 ± 5.8 | 68.1 ± 14.2 | 47.8 ± 10.3 | 71.6 ± 5.2 |
| 11-cis-Retinal | 527.1 ± 20.3 | 510.4 ± 14.8 | 510.4 ± 35.1 | 514.1 ± 36.9 |
| all-trans-Retinal | 34.3 ± 1.5 | 26.9 ± 0.5 | 32.1 ± 2.6 | 46.1 ± 2.1 |
| all-trans-Retinol | 13.6 ± 4.7 | 5.8 ± 2.1 | 4.8 ± 1.5 | 3.7 ± 2.2 |
| 11-cis-Retinol | 8.4 ± 5.8 | 7.5 ± 2.3 | 9.2 ± 1.4 | 9.8 ± 4.2 |
For calculations assumed as 1:1 mixture of 11-cis-retinyl and 13-cis-retinyl esters.
Retinal Morphology
Because we have previously shown that RDH11 is expressed in the RPE and the Müller cells of the nerve fiber layer (13), the retinal morphology of 2-month-old rdh11−/− mice was examined by light microscopy and EM. Histologically, all cell layers of the retina were comparable between the WT and rdh11−/− mice (data not shown). EM micrographs revealed no obvious abnormalities in the outer nuclear layer, photoreceptors, or RPE cells of rdh11−/−, rdh5−/−, or rdh5−/− rdh11−/− mice (Fig. 5). Higher magnification of RPE cells and photoreceptor outer segments demonstrated no discernible differences between mice with single or combined gene deletions.
Fig. 5. Montage of cross-section of the retinas of 2-month-old mice analyzed by transmission EM.

Upper panels show the cross-section of the RPE and the photoreceptor cells. Lower panels show a higher magnification of the RPE and ROS. The preparation of sections is described in “Materials and Methods.”
ERG Analysis
ERG response was examined under dark-adapted or light-adapted conditions using a single flash at different levels of intensity. The series of averaged waveforms obtained at different light stimuli for each genotype are shown in Fig. 6, A and C, and a- and b-wave amplitude responses are plotted in Fig. 6, B and D. Under dark-adapted conditions, rdh11−/− and rdh5−/− a- and b-wave amplitudes remained similar to those observed in WT mice (Fig. 6B). Rdh5−/− rdh11−/− mice, however, displayed slightly reduced a- and b-wave amplitude responses. Under light-adapted conditions, the genetically altered mice showed no significant changes in either a- or b-wave amplitudes (Fig. 6D). The leading edges of the a-wave of the ERG responses in dark-adapted conditions were fitted with a rod phototransduction model. The maximum amplitude and sensitivity of the photoresponses were reduced from maximal responses in dark-adapted conditions, and both parameters were compared with the results in WT mice as described previously (23). The maximal amplitude and sensitivity of the rdh11−/−, rdh5−/−, and rdh5−/− rdh11−/− mouse photoresponses remained unchanged relative to WT mice (Table I).
Fig. 6. Single flash ERG responses of increasing intensity for WT, rdh11−/−, rdh5−/−, and rdh5−/− rdh11−/− mice.
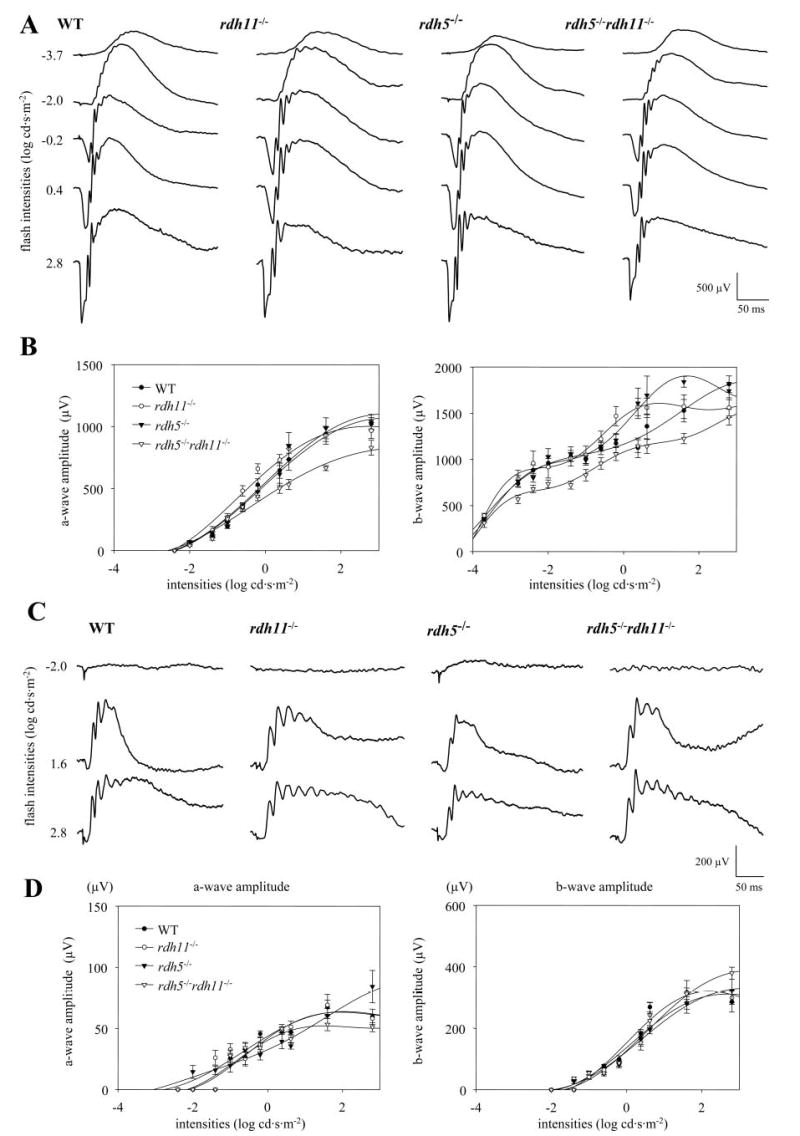
Serial responses to increasing flash stimuli were obtained for WT, rdh11−/−, rdh5−/−, and rdh5−/− rdh11−/− mice for selected intensities under dark-adapted conditions (A) and light-adapted conditions (C), and plotted as a function a-wave and b-wave versus light intensities under dark-adapted conditions (B) and light-adapted conditions (D). Error bars indicate the S.E. of the mean.
Recovery function of rod photoreceptors was further studied using paired flash responses. A test flash was used to desensitize rod photoreceptors, and then a second probe flash at various times following the initial flash was used to examine the recovery of dark adaptation by monitoring a-wave amplitude responses (Fig. 7, left panel). Recovery of the a-wave in rdh11−/−, rdh5−/−, and rdh5−/− rdh11−/− mice was normalized to a-wave amplitude responses in WT mice. Dark adaptation rates in rdh11−/− mice and rdh5−/− mice showed no significant difference, whereas photoreceptors in rdh5−/− rdh11−/− mice resensitized significantly more slowly compared with WT (p < 0.02; rdh5−/− rdh11−/−, 1230.3 ± 121.3 ms; WT, 893.3 ± 47.8 ms) after the test flash (Fig. 7, right panel and Table II). As mentioned above, other parameters of rod photoreceptor function (Table II) showed no significant differences between mice with different genotypes. Taken together these results suggest that the photoexcitation function of rod photoreceptors is not affected by the loss of either rdh11 or rdh5 alone but is slightly reduced when both genes are disrupted, and that both genes must be functional in order to maintain normal dark adaptation kinetics following illumination. These differences might be caused by a slower replacement of the chromophore once the flash is applied. To further evaluate the mild delay in dark adaptation, we determined if a more dramatic phenotype could be elicited by stressing the mice with an intense bleaching condition (500 cd·m−2 for 3 min) prior to monitoring the recovery of a-wave amplitude. Typical a-wave traces in the recovery phase following the bleach for WT, rdh11−/−, rdh5−/−, and rdh5−/− rdh11−/− mice are shown in Fig. 8A and the recovery ratios are plotted in Fig. 8B. Recovery in a-wave amplitude was slightly attenuated in rdh11−/− mice (p < 0.01), even slower in rdh5−/− mice (p < 0.0001), and further delayed in rdh5−/− rdh11−/− mice (p < 0.0001) compared with WT. To ascertain the reason for the mild but significant delay in dark adaptation kinetics, retinoid analysis was carried out immediately after the 3-min bleach and after 30 min in the dark. At time 0, photoexcitation caused the expected increase in all-trans-retinal and a concurrent decrease in 11-cis-retinal levels relative to the dark-adapted condition. No significant differences in the retinal levels were observed between the mice of different genotypes. In agreement with single flash ERGs, the loss of RDH11 or RDH5 does not cause a defect in the photoexcitation process even under sustained visual excitation conditions. Eyes of rdh5−/− and rdh5−/− rdh11−/− mice had elevated levels of 11/13-cis-retinyl esters (data not shown), which is consistent with data following a single flash. However, unlike the single flash experiment, mice of different genetic backgrounds had reduced levels of 11-cis-retinal and increased levels of all-trans-retinal relative to WT mice (Fig. 9). Mice with both rdh11 and rdh5 disrupted exhibited the lowest concentration of 11-cis-retinal and the most severe delay in dark adaptation, whereas rdh11−/− mice had higher levels of 11-cis-retinal and a milder delay. Concentrations of 11-cis-retinal appeared to correlate with dark adaptation kinetics, in agreement with the current retinoid cycle model. These results demonstrate that the subtle difference in ERG response produced by a double flash experiment can be accentuated to a more severe phenotype, provided a higher percent of rhodopsin molecules is photoactivated.
Fig. 7. Measurements of a-wave recovery with double-flash ERG.

ERG trace from WT mouse demonstrating the double-flash technique (left upper panel); recovery of a-wave after a test flash from WT mouse (left lower panel). The dark-adapted mice were conditioned first with the test flash (0.4 log cd·s·m−2) followed by a probe flash (1.6 log cd·s·m−2) with the delay time varied from 200 to 2000 ms. Each trace represents the average of recordings from n = 8 eyes. Normalized a-wave recovery of the probe flash at different times after the test flash is shown. Error bars indicate the S.E. of the mean.
Table II. Quantitative parameters of ERG a-wave.
ERGs were recorded as described in “Materials and Methods.” Leading edges (initial 5–20 ms depending on response) of dark-adapted ERG photoresponses evoked by 2.8 log cd·s·m−2 flashes are fitted with a model of phototransduction. The results are presented with S.E., and n was between 4 and 8. Maximum a-wave amplitude, sensitivity parameters, and time for 50% recovery of a-wave in rdh5−/− mice, rdh11−/−, and rdh5−/− rdh11−/− mice compared with WT mice.
| Parameters | WT | rdh11−/− | rdh5−/− | rdh11−/−rdh5−/− |
|---|---|---|---|---|
| Maximum a-wave amplitude (μV) | 964.6 ± 48.4 | 902.9 ± 152.4 | 1055.5 ± 113.6 | 885.5 ± 112.8 |
| Sensitivity (log cd−1 m2 s−3) | 6.2 ± 0.3 | 5.8 ± 0.8 | 5.7 ± 0.7 | 5.7 ± 0.4 |
| Time between flashes for 50% recovery a-wave amplitude recovery (ms) | 893.± 3 47.8 | 1039.0 ± 133.8 | 912.4 ± 66.9 | 1230.3 ± 121.3 |
Fig. 8. Measurements of a-wave recovery after constant light stimulation.

The representative wave forms during recovery phase from each genetic background (A). The dark-adapted mice were bleached with intense constant illumination (500 cd·m−2) for 3 min and the recovery of a-wave amplitudes was monitored with single-flash ERG (−0.2 cd·s·m−2) for 60 min; the recovery ratio is plotted (B). The ratio was significantly attenuated in rdh11−/− (p < 0.01), rdh5−/− (p < 0.0001), and rdh5−/− -rdh11−/− (p < 0.0001) compared with WT. Error bars indicate the S.E.
Fig. 9. Kinetics of retinoids after intense light bleaching.

Prior to the experiment, mice were dark-adapted for 48 h and bleached with background light at 500 cd·m−2 for 3 min. HPLC retinoid analysis was performed right after the intense light stimulation. Error bars indicate the S.E. (n = 3).
DISCUSSION
Retinoids play an essential role in vertebrate development, differentiation, and reproduction. In vitro studies have demonstrated the ability of RDH11 to catalyze the reduction/oxidation of cis- and trans-retinals/retinols (13, 17), thereby suggesting that this enzyme can play a role in retinoid homeostasis. Rdh11 is expressed during murine embryonic development, and levels gradually increase from embryonic day 7 to day 17 (26). Although RDH11 utilizes retinoid substrates and is expressed during embryogenesis, the studies reported here analyzing rdh11−/− mice did not identify any consistent abnormalities in development, postnatal survival, or fertility. The lack of a developmental phenotype in rdh11−/− mice can be caused by the overlapping expression of RDH11 homologues (13) or other enzymes compensating for the loss of rdh11. In addition, RDH 11 was hypothesized to play a protective role in cells by converting highly reactive and toxic short chain aldehyde byproducts of unsaturated fatty acid oxidation to non-reactive alcohols. Since SREBP regulates fatty acid and cholesterol synthesis as well as rdh11 expression, we examined the liver for a possible phenotype. Until 6 months of age, no histological difference in the liver of rdh11−/− compared with that of the rdh11+/+ mice was observed, suggesting that either a liver phenotype can have a late onset, RDH11 might not play a role in preventing oxidative damage, or the mice need to be put on a special diet in order to manifest a liver phenotype. Another dehydrogenase, RDH5, is also expressed during embryogenesis (27) and catalyzes the oxidation of cis-retinol. Interestingly, mice with both rdh11 and rdh5 genes disrupted also appear healthy with no defects in development and fertility, a finding that further supports the functional redundancy of the retinoid metabolic pathway.
Maintaining the retinoid cycle in the retina is also essential for vision. In dark-adapted conditions the retinoid levels in eyes of rdh11−/− mice were similar to measurements in eyes from WT mice, whereas rdh5−/− rdh11−/− mice had elevated levels of cis-retinol and cis-retinyl esters that were greater than in rdh5−/− eyes (Table I). The reason for elevated cis-retinol levels in dark-adapted conditions is unclear, because the rate of 11-cis-retinal formation remained unchanged. A possible explanation is that the slower rate of 11-cis-retinol oxidation did not disrupt the 11-cis-retinal supply because the oxidation reaction rate was still comparable to the rate-limiting step in the reti-noid cycling process, which is the reduction of all-trans-retinal (28, 29). One hypothesis could be that RDH5 acts as a modulator of RPE65-mediated isomerase activity such that the complex of RDH5 and RPE65 with a yet unidentified enzyme has lower isomerase activity compared with RPE65 free of RDH5 (16). Thus, the conversion of all-trans-retinyl ester to cis-retinol by the RPE65-mediated process (Fig. 1, reaction d) would accelerate in the absence of RDH5, whereas the subsequent oxidation of cis-retinol (Fig. 1, reaction e) by the remaining enzymes would not be affected by the loss of RDH5. This would result in increased levels of 11-cis-retinol, and thus cis-retinyl esters because of lecithin:retinol acyl transferase (LRAT; Fig. 1 and Ref. 30).
After a continuous 3-min bleach, 11-cis-retinal levels decreased in rdh5−/− and rdh5−/− rdh11−/− mice, which can explain the delayed dark adaptation kinetics. After prolonged illumination, enzymes responsible for steps b, c, and d in Fig. 1 are capable of handling the increase in substrate concentrations because of photoisomerization of 11-cis-retinal to all-trans-retinal, but a bottleneck effect occurs at step e because of the slower oxidation rate of the compensating enzymes. Thus, 11-cis-retinal demand following mild perturbations of ~30% bleach can be met by the remaining dehydrogenase activity, but these enzymes are insufficient to rapidly replenish large depletions of 11-cis-retinal chromophore following higher bleaches. Changes in retinoid levels in rdh5−/− rdh11−/− mice compared with rdh5−/− mice also provide evidence that RDH11 plays a role in the normal flow of retinoids.
Both rdh11−/− and rdh5−/− rdh11−/− mice have normal photopic and scotopic ERG kinetics (Fig. 6, Table II), indicating that these mice are capable of regenerating the visual chromophore and have normal rod and cone photoreceptor photo-transduction signaling. However, after prolonged intense illumination conditions delayed dark adaptation kinetics were observed in the single and double knock-out mice. The severity of the attenuated dark adaptation (Fig. 8) appeared to correlate with decreasing 11-cis-retinal concentrations observed in rdh11−/−, rdh5−/−, and rdh5−/− rdh11−/− mice relative to WT (Fig. 9). Photoreceptors in both rdh11−/− and rdh5−/− mice displayed biphasic recovery kinetics: a rapid initial phase followed by a slower period (Fig. 8). This biphasic recovery has been observed in patients exhibiting clinical fundus albipunctatus because of an R257W mutation in RDH5 (31). After a 0.5% bleach, patients have normal rod recovery, but following intermediate bleaches in the 2–12% range, a rapid partial recovery is followed by a transitory plateau. Both 11-cis-RDH-deficient mice and humans with RDH5 mutations are able to maintain normal visual recovery kinetics using the alternative pathway(s) to generate 11-cis-retinal, but mice are able to recover faster from stronger bleaching conditions than are humans. Part of the reason for these variations in the rate of dark adaptation may be due to anatomical differences between the mouse and human retina. Mice are nocturnal animals with a rod-dominant photoreceptor layer essential for scotopic vision, whereas humans have evolved for both day and night vision, resulting in a cone-dominant macula and a rod-dominant periphery. Hence, clinical retinopathies affecting dark adaptation often present as a less severe phenotype in mice, simply because of the nocturnal evolution of the rodent visual system compared with the diurnal primate one.
A mild visual phenotype in rdh5−/− rdh11−/− mice suggests that alternative enzymes can oxidize 11-cis-retinol to 11-cis-retinal in RPE cells. Likely candidates might be Dhrs9 (retsdr8), an oxidoreductase, which has dual substrate specificity for both 11-cis and all-trans-retinol with NADPH specificity (21) or RDH10, a SDR that catalyzes retinol oxidation with NADP specificity (32). Rather than a microsomal enzyme, perhaps the compensating enzyme can be the plasma membrane-associated 11-cis-RDH found in the RPE (33). Another possibility is that the remaining 11-cis-RDH activity observed in rdh5−/− RPE cells results from a NAD+-dependent enzyme (18). Candidate NADH-dependent enzymes might be among the eight SDR genes present as a cluster on mouse chromosome 10D3. Rdh5 is also located on chromosome 10D3 but it is separated from the other SDRs by ~1 Mb. RDH1, RDH5, RDH6 (CRAD1), RDH7 (CRAD2), and RDH9 (CRAD3) (34–37) catalyze retinol oxidation with NAD+ specificity, suggesting that these SDRs most likely originated through local intrachromosomal duplication events. If these enzymes are expressed in the RPE as demonstrated for RDH6 and RDH7, and if indeed RDH1, RDH7, and RDH9 lack a human orthologue, one or more of these enzymes can catalyze 11-cis-retinol oxidation and contribute to the more efficient dark adaptation mechanism in mice.
Biochemical and genetic studies indicate that alcohol dehydrogenase (ADH) metabolizes retinol to retinal (38). Data base searches have identified adh1 expressed sequence tags (EST) in mouse RPE and choroid libraries and adh4 ESTs in mouse and human RPE and choroid libraries. Recently, ADH4 has been immunolocalized to the RPE and shown to have significant enzymatic activity toward cis-retinoids (39). Although soluble ADHs catalyze retinal/retinol redox reactions, the soluble protein fraction of bovine RPE cells contained low amounts of retinol oxidative activity, which is insufficient to explain the remaining alternative enzyme(s) activity in rdh5−/− RPE. This indicates that soluble enzymes do not play a major role in the visual retinoid cycle (18). Thus, ADH1 and ADH4, although expressed in the RPE, most likely contribute a minor amount to redox activity toward cis-retinoids in RPE cells.
Factors that determine whether an enzyme catalyzes the reduction or oxidation of a substrate include the equilibrium constant, the reduced/oxidized cofactor, and substrate/product ratios. The pH-independent equilibrium constant is 3.3 × 10⁻⁹ for the oxidation of retinol (40). It was reported that RDH11 displayed ~50-fold more efficient activity for the NADPH-dependent reduction of all-trans-retinal than for the oxidation of all-trans-retinol (17). However, in the retina, the ratio of NADP to NAPDH is between 4 to 1 or 1.5 to 1 (41), suggesting that NADPH-dependent enzymes such as RDH11 and RDH5 have the ability to catalyze both oxidative and reductive reactions depending on the substrate concentrations. Rdh5−/−, rdh11−/−, and rdh5−/− rdh11−/− mice have elevated levels of cis-retinol, which is stored in the form of cis-retinyl esters, suggesting that RDH11 and RDH5 catalyze the oxidation of retinol to retinal. It should be considered that the oxidation reaction is preferred by the means of sequestering the 11-cis-retinal product by CRALBP. In other tissues where RDH11 is expressed at different substrate/product concentrations, it is conceivable that RDH11 might catalyze the reductive reaction.
EM results revealed no retinal degeneration in rdh11−/−, rdh5−/−, or rdh5−/− rdh11−/− retina, which is concordant with normal ERG kinetics. Contact between photoreceptor outer segments and RPE cells remained intact in all mice with different genotypes, suggesting that normal phagocytosis was occurring. Not surprisingly, disrupting both rdh11 and rdh5 genes did not elicit the white punctata in the fundus that is observed in patients with RDH5 mutations (data not shown). A number of mice models are providing evidence that disruption of genes known to play a role in the retinoid cycle exhibit a more severe degenerative retinal pathology in humans compared with mice, such as abcr (42, 43), cralbp (44, 45), and rgr (24, 46) mutations. These mouse models exhibit delayed dark adaptation kinetics at higher bleaching intensities but normal ERG kinetics under dark-adapted conditions. In contrast, mice models of other genes involved in the retinoid cycle such as lrat (30) and rpe65 (47) more closely mimic human retinal dystrophies. Mutations in LRAT cause early childhood onset retinal dystrophy (CSRD), and RPE65 has been identified as one of the disease-causing genes for Leber’s Congenital Amaurosis (LCA), also an early onset form of retinal dystrophy. Thus, genes associated with later onset of retinal degeneration in humans produce a mild phenotype in mice, whereas genes causing early childhood onset retinal dystrophies produce a severe phenotype.
A total of ten LCA genes have been mapped, 8 of which have been identified: retGC1, RPE65, CRX, AIPL1, RPGRIP1, CRB1, TULP1, and most recently RDH12 (reviewed in Refs. 48 and 49). Mutations in RDH12 were linked with progressive rod-cone dystrophy in a subset of LCA patients (50, 51). In humans, RDH12 is located on chromosome 14, ~27 kb apart from its homologue RDH11. Both RDH11 and RDH12 have the same substrate specificity and similar enzymatic properties, but RDH11 is localized to the RPE and Müller cells, whereas RDH12 is localized to the photoreceptor cell layer. Both groups screened their cohort of patients for polymorphisms in the RDH11 gene, but neither group found an association between the disease and RDH11. A lack of a severe phenotype in rdh11−/− mice provides additional evidence that loss of RDH11 function might not manifest in LCA. If this is indeed true, a defect in the rate-limiting step of all-trans-retinal reduction in photoreceptors appears to be the critical step in the retinoid cycle. RDH12 must be the dominant enzyme, given the redundancy of all-trans-retinal reducing enzymes such as retSDR1 (52) and prRDH (53) in photoreceptors. It will be interesting to examine whether rdh12−/− mice display a similar retinal electrophysiological and pathological phenotype as seen in LCA patients.
The fact that some fundus albipunctatus patients with RDH5 gene mutations develop cone dystrophy after the age of 40 (54) suggests that the RDH5 gene is important for maintenance of normal cone function, contrary to the proposed visual cycle for cone opsin regeneration (7). Seven genes have been identified to cause cone dystrophy, CRX (55), retGC1 (56), GUCA1A (57), GCAP1 (58), ABCR (59), RDH12 (51), and RDH5 (54), but only RDH5 is expressed in the RPE. In this study no cone dysfunctions were detected in rdh11−/−, rdh5−/−, and rdh5−/− rdh11−/− mice less than 6 months old.
Acknowledgments
We thank Drs. Carola A. G. G. Driessen and Jacques J. M. Janssen for providing the RDH5 mice, Daniel Possin for electron microscopy, Alice Davy and Josée Aubin for their assistance in generating the targeting vector, Carol Ware for ES cell injections, Matt Fero for setting up the mouse data base and all his helpful comments, Amy Look for help during the course of this study, and Rebecca Birdsong for help with manuscript preparation.
Footnotes
This research was supported by Grants CA85859 and DK65204 (to P. S. N.) and EY08061 from the National Institutes of Health (to K. P.), a grant from the Stargardt and Retinal Eye Disease Fund, and a grant from the E. K. Bishop Foundation.
The abbreviations used are: RPE, retinal pigment epithelium; EM, electron microscopy; ERG, electroretinogram; ES, embryonic stem; SDR, short chain dehydrogenase reductase; RDH, retinol dehydrogenase; ROS, rod outer segment(s); WT, wild type; PIPES, 1,4-pipera-zinediethanesulfonic acid; PBS, phosphate-buffered saline; ADH, alcohol dehydrogenase; EST, expressed sequence tag.
References
- 1.Okada T, Ernst OP, Palczewski K, Hofmann KP. Trends Biochem Sci. 2001;26:318–324. doi: 10.1016/s0968-0004(01)01799-6. [DOI] [PubMed] [Google Scholar]
- 2.Pugh EN, Jr, Nikonov S, Lamb TD. Curr Opin Neurobiol. 1999;9:410–418. doi: 10.1016/S0959-4388(99)80062-2. [DOI] [PubMed] [Google Scholar]
- 3.Polans A, Baehr W, Palczewski K. Trends Neurosci. 1996;19:547–554. doi: 10.1016/s0166-2236(96)10059-x. [DOI] [PubMed] [Google Scholar]
- 4.Filipek S, Stenkamp RE, Teller DC, Palczewski K. Annu Rev Physiol. 2003;65:851–879. doi: 10.1146/annurev.physiol.65.092101.142611. [DOI] [PMC free article] [PubMed] [Google Scholar]
- 5.McBee JK, Palczewski K, Baehr W, Pepperberg DR. Prog Retin Eye Res. 2001;20:469–529. doi: 10.1016/s1350-9462(01)00002-7. [DOI] [PubMed] [Google Scholar]
- 6.Saari JC. Invest Ophthalmol Vis Sci. 2000;41:337–348. [PubMed] [Google Scholar]
- 7.Mata NL, Radu RA, Clemmons RC, Travis GH. Neuron. 2002;36:69–80. doi: 10.1016/s0896-6273(02)00912-1. [DOI] [PMC free article] [PubMed] [Google Scholar]
- 8.Imanishi Y, Gerke V, Palczewski K. J Cell Biol. 2004;166:447–453. doi: 10.1083/jcb.200405110. [DOI] [PMC free article] [PubMed] [Google Scholar]
- 9.Imanishi Y, Batten ML, Piston DW, Baehr W, Palczewski K. J Cell Biol. 2004;164:373–383. doi: 10.1083/jcb.200311079. [DOI] [PMC free article] [PubMed] [Google Scholar]
- 10.Yamamoto H, Simon A, Eriksson U, Harris E, Berson EL, Dryja TP. Nat Genet. 1999;22:188–191. doi: 10.1038/9707. [DOI] [PubMed] [Google Scholar]
- 11.Driessen CA, Winkens HJ, Hoffmann K, Kuhlmann LD, Janssen BP, Van Vugt AH, Van Hooser JP, Wieringa BE, Deutman AF, Palczewski K, Ruether K, Janssen JJ. Mol Cell Biol. 2000;20:4275–4287. doi: 10.1128/mcb.20.12.4275-4287.2000. [DOI] [PMC free article] [PubMed] [Google Scholar]
- 12.Shang E, Lai K, Packer AI, Paik J, Blaner WS, de Morais Vieira M, Gouras P, Wolgemuth DJ. J Lipid Res. 2002;43:590–597. [PubMed] [Google Scholar]
- 13.Haeseleer F, Jang GF, Imanishi Y, Driessen CA, Matsumura M, Nelson PS, Palczewski K. J Biol Chem. 2002;277:45537–45546. doi: 10.1074/jbc.M208882200. [DOI] [PMC free article] [PubMed] [Google Scholar]
- 14.Lin B, White JT, Ferguson C, Wang S, Vessella R, Bumgarner R, True LD, Hood L, Nelson PS. Cancer Res. 2001;61:1611–1618. [PubMed] [Google Scholar]
- 15.Kasus-Jacobi A, Ou J, Bashmakov YK, Shelton JM, Richardson JA, Goldstein JL, Brown MS. J Biol Chem. 2003;278:32380–32389. doi: 10.1074/jbc.M304969200. [DOI] [PubMed] [Google Scholar]
- 16.Simon A, Hellman U, Wernstedt C, Eriksson U. J Biol Chem. 1995;270:1107–1112. [PubMed] [Google Scholar]
- 17.Kedishvili NY, Chumakova OV, Chetyrkin SV, Belyaeva OV, Lap-shina EA, Lin DW, Matsumura M, Nelson PS. J Biol Chem. 2002;277:28909–28915. doi: 10.1074/jbc.M202588200. [DOI] [PubMed] [Google Scholar]
- 18.Jang GF, Van Hooser JP, Kuksa V, McBee JK, He YG, Janssen JJ, Driessen CA, Palczewski K. J Biol Chem. 2001;276:32456–32465. doi: 10.1074/jbc.M104949200. [DOI] [PMC free article] [PubMed] [Google Scholar]
- 19.Belyaeva OV, Stetsenko AV, Nelson P, Kedishvili NY. Biochemistry. 2003;42:14838–14845. doi: 10.1021/bi035288u. [DOI] [PubMed] [Google Scholar]
- 20.Nagy A, Rossant J, Nagy R, Abramow-Newerly W, Roder JC. Proc Natl Acad Sci U S A. 1993;90:8424–8428. doi: 10.1073/pnas.90.18.8424. [DOI] [PMC free article] [PubMed] [Google Scholar]
- 21.Driessen C, Winkens H, Haeseleer F, Palczewski K, Janssen J. Vision Res. 2003;43:3075–3079. doi: 10.1016/s0042-6989(03)00483-8. [DOI] [PubMed] [Google Scholar]
- 22.Van Hooser JP, Liang Y, Maeda T, Kuksa V, Jang GF, He YG, Rieke F, Fong HK, Detwiler PB, Palczewski K. J Biol Chem. 2002;277:19173–19182. doi: 10.1074/jbc.M112384200. [DOI] [PMC free article] [PubMed] [Google Scholar]
- 23.Van Hooser JP, Aleman TS, He YG, Cideciyan AV, Kuksa V, Pittler SJ, Stone EM, Jacobson SG, Palczewski K. Proc Natl Acad Sci U S A. 2000;97:8623–8628. doi: 10.1073/pnas.150236297. [DOI] [PMC free article] [PubMed] [Google Scholar]
- 24.Maeda T, Van Hooser JP, Driessen CA, Filipek S, Janssen JJ, Palczewski K. J Neurochem. 2003;85:944–956. doi: 10.1046/j.1471-4159.2003.01741.x. [DOI] [PMC free article] [PubMed] [Google Scholar]
- 25.Howes KA, Pennesi ME, Sokal I, Church-Kopish J, Schmidt B, Margolis D, Frederick JM, Rieke F, Palczewski K, Wu SM, Detwiler PB, Baehr W. EMBO J. 2002;21:1545–1554. doi: 10.1093/emboj/21.7.1545. [DOI] [PMC free article] [PubMed] [Google Scholar]
- 26.Moore S, Pritchard C, Lin B, Ferguson C, Nelson PS. Gene (Amst) 2002;293:149–160. doi: 10.1016/s0378-1119(02)00718-7. [DOI] [PubMed] [Google Scholar]
- 27.Romert A, Tuvendal P, Simon A, Dencker L, Eriksson U. Proc Natl Acad Sci U S A. 1998;95:4404–4409. doi: 10.1073/pnas.95.8.4404. [DOI] [PMC free article] [PubMed] [Google Scholar]
- 28.Palczewski K, Van Hooser JP, Garwin GG, Chen J, Liou GI, Saari JC. Biochemistry. 1999;38:12012–12019. doi: 10.1021/bi990504d. [DOI] [PubMed] [Google Scholar]
- 29.Saari JC, Garwin GG, Van Hooser JP, Palczewski K. Vision Res. 1998;38:1325–1333. doi: 10.1016/s0042-6989(97)00198-3. [DOI] [PubMed] [Google Scholar]
- 30.Batten ML, Imanishi Y, Maeda T, Tu DC, Moise AR, Bronson D, Possin D, Van Gelder RN, Baehr W, Palczewski K. J Biol Chem. 2004;279:10422–10432. doi: 10.1074/jbc.M312410200. [DOI] [PMC free article] [PubMed] [Google Scholar]
- 31.Cideciyan AV, Haeseleer F, Fariss RN, Aleman TS, Jang GF, Verlinde CL, Marmor MF, Jacobson SG, Palczewski K. Vis Neurosci. 2000;17:667–678. doi: 10.1017/s0952523800175029. [DOI] [PMC free article] [PubMed] [Google Scholar]
- 32.Wu BX, Chen Y, Fan J, Rohrer B, Crouch RK, Ma JX. Investig Ophthalmol Vis Sci. 2002;43:3365–3372. [PubMed] [Google Scholar]
- 33.Mata NL, Tsin AT. Biochim Biophys Acta. 1998;1394:16–22. doi: 10.1016/s0005-2760(98)00078-2. [DOI] [PubMed] [Google Scholar]
- 34.Su J, Chai X, Kahn B, Napoli JL. J Biol Chem. 1998;273:17910–17916. doi: 10.1074/jbc.273.28.17910. [DOI] [PubMed] [Google Scholar]
- 35.Chai X, Zhai Y, Napoli JL. J Biol Chem. 1997;272:33125–33131. doi: 10.1074/jbc.272.52.33125. [DOI] [PubMed] [Google Scholar]
- 36.Zhang M, Chen W, Smith SM, Napoli JL. J Biol Chem. 2001;276:44083–44090. doi: 10.1074/jbc.M105748200. [DOI] [PubMed] [Google Scholar]
- 37.Zhuang R, Lin M, Napoli JL. Biochemistry. 2002;41:3477–3483. doi: 10.1021/bi0119316. [DOI] [PubMed] [Google Scholar]
- 38.Duester G. Chem Biol Interact. 2001;130–132:469–480. doi: 10.1016/s0009-2797(00)00292-1. [DOI] [PubMed] [Google Scholar]
- 39.Martras S, Alvarez R, Martinez SE, Torres D, Gallego O, Duester G, Farres J, de Lera AR, Pares X. Eur J Biochem. 2004;271:1660–1670. doi: 10.1111/j.1432-1033.2004.04058.x. [DOI] [PubMed] [Google Scholar]
- 40.Bliss AF. Arch Biochem. 1951;31:197–204. doi: 10.1016/0003-9861(51)90206-8. [DOI] [PubMed] [Google Scholar]
- 41.Matschinsky FM. J Neurochem. 1968;15:643–657. doi: 10.1111/j.1471-4159.1968.tb08963.x. [DOI] [PubMed] [Google Scholar]
- 42.Weng J, Mata NL, Azarian SM, Tzekov RT, Birch DG, Travis GH. Cell. 1999;98:13–23. doi: 10.1016/S0092-8674(00)80602-9. [DOI] [PubMed] [Google Scholar]
- 43.Nasonkin I, Illing M, Koehler MR, Schmid M, Molday RS, Weber BH. Hum Genet. 1998;102:21–26. doi: 10.1007/s004390050649. [DOI] [PubMed] [Google Scholar]
- 44.Maw MA, Kennedy B, Knight A, Bridges R, Roth KE, Mani EJ, Mukkadan JK, Nancarrow D, Crabb JW, Denton MJ. Nat Genet. 1997;17:198–200. doi: 10.1038/ng1097-198. [DOI] [PubMed] [Google Scholar]
- 45.Saari JC, Nawrot M, Kennedy BN, Garwin GG, Hurley JB, Huang J, Possin DE, Crabb JW. Neuron. 2001;29:739–748. doi: 10.1016/s0896-6273(01)00248-3. [DOI] [PubMed] [Google Scholar]
- 46.Morimura H, Saindelle-Ribeaudeau F, Berson EL, Dryja TP. Nat Genet. 1999;23:393–394. doi: 10.1038/70496. [DOI] [PubMed] [Google Scholar]
- 47.Redmond TM, Yu S, Lee E, Bok D, Hamasaki D, Chen N, Goletz P, Ma JX, Crouch RK, Pfeifer K. Nat Genet. 1998;20:344–351. doi: 10.1038/3813. [DOI] [PubMed] [Google Scholar]
- 48.Allikmets R. Ophthalmic Genet. 2004;25:67–79. doi: 10.1080/13816810490514261. [DOI] [PubMed] [Google Scholar]
- 49.Baehr W, Wu SM, Bird AC, Palczewski K. Vision Res. 2003;43:2957–2958. doi: 10.1016/j.visres.2003.10.001. [DOI] [PubMed] [Google Scholar]
- 50.Janecke AR, Thompson DA, Utermann G, Becker C, Hubner CA, Schmid E, McHenry CL, Nair AR, Ruschendorf F, Heckenlively J, Wissinger B, Nurnberg P, Gal A. Nat Genet. 2004;36:850–854. doi: 10.1038/ng1394. [DOI] [PubMed] [Google Scholar]
- 51.Perrault I, Hanein S, Gerber S, Barbet F, Ducroq D, Dollfus H, Hamel C, Dufier JL, Munnich A, Kaplan J, Rozet JM. Am J Hum Genet. 2004;75:639–646. doi: 10.1086/424889. [DOI] [PMC free article] [PubMed] [Google Scholar]
- 52.Haeseleer F, Huang J, Lebioda L, Saari JC, Palczewski K. J Biol Chem. 1998;273:21790–21799. doi: 10.1074/jbc.273.34.21790. [DOI] [PubMed] [Google Scholar]
- 53.Rattner A, Smallwood PM, Nathans J. J Biol Chem. 2000;275:11034–11043. doi: 10.1074/jbc.275.15.11034. [DOI] [PubMed] [Google Scholar]
- 54.Nakamura M, Hotta Y, Tanikawa A, Terasaki H, Miyake Y. Invest Ophthalmol Vis Sci. 2000;41:3925–3932. [PubMed] [Google Scholar]
- 55.Swain PK, Chen S, Wang QL, Affatigato LM, Coats CL, Brady KD, Fishman GA, Jacobson SG, Swaroop A, Stone E, Sieving PA, Zack DJ. Neuron. 1997;19:1329–1336. doi: 10.1016/s0896-6273(00)80423-7. [DOI] [PubMed] [Google Scholar]
- 56.Kelsell RE, Gregory-Evans K, Payne AM, Perrault I, Kaplan J, Yang RB, Garbers DL, Bird AC, Moore AT, Hunt DM. Hum Mol Genet. 1998;7:1179–1184. doi: 10.1093/hmg/7.7.1179. [DOI] [PubMed] [Google Scholar]
- 57.Payne AM, Downes SM, Bessant DA, Taylor R, Holder GE, Warren MJ, Bird AC, Bhattacharya SS. Hum Mol Genet. 1998;7:273–277. doi: 10.1093/hmg/7.2.273. [DOI] [PubMed] [Google Scholar]
- 58.Sokal I, Li N, Surgucheva I, Warren MJ, Payne AM, Bhattacharya SS, Baehr W, Palczewski K. Mol Cell. 1998;2:129–133. doi: 10.1016/s1097-2765(00)80121-5. [DOI] [PubMed] [Google Scholar]
- 59.Cremers FP, van de Pol DJ, van Driel M, den Hollander AI, van Haren FJ, Knoers NV, Tijmes N, Bergen AA, Rohrschneider K, Blankenagel A, Pinckers AJ, Deutman AF, Hoyng CB. Hum Mol Genet. 1998;7:355–362. doi: 10.1093/hmg/7.3.355. [DOI] [PubMed] [Google Scholar]
- 60.Stecher H, Gelb MH, Saari JC, Palczewski K. J Biol Chem. 1999;274:8577–8585. doi: 10.1074/jbc.274.13.8577. [DOI] [PubMed] [Google Scholar]