Abstract
Lecithin-retinol acyltransferase (LRAT), an enzyme present mainly in the retinal pigmented epithelial cells and liver, converts all-trans-retinol into all-trans-retinyl esters. In the retinal pigmented epithelium, LRAT plays a key role in the retinoid cycle, a two-cell recycling system that replenishes the 11-cis-retinal chromophore of rhodopsin and cone pigments. We disrupted mouse Lrat gene expression by targeted recombination and generated a homozygous Lrat knock-out (Lrat−/−) mouse. Despite the expression of LRAT in multiple tissues, the Lrat−/− mouse develops normally. The histological analysis and electron microscopy of the retina for 6–8-week-old Lrat−/− mice revealed that the rod outer segments are ~35% shorter than those of Lrat+/+ mice, whereas other neuronal layers appear normal. Lrat−/− mice have trace levels of all-trans-retinyl esters in the liver, lung, eye, and blood, whereas the circulating all-trans-retinol is reduced only slightly. Scotopic and photopic electroretinograms as well as pupillary constriction analyses revealed that rod and cone visual functions are severely attenuated at an early age. We conclude that Lrat−/− mice may serve as an animal model with early onset severe retinal dystrophy and severe retinyl ester deprivation.
Lecithin-retinol acyltransferase (LRAT)1 converts all-trans-retinol (vitamin A) to all-trans-retinyl esters in several tissues, including the liver, lung, pancreas, intestine, testis, and the retinal pigmented epithelium (RPE) (1–5). LRAT activity in the RPE has been studied for more than 60 years (6), but the enzyme was only recently identified on the molecular level as a 25-kDa integral membrane protein (7). All-trans-retinyl esters are intermediate compounds in a metabolic pathway (“visual cycle” or “retinoid cycle”) that recycles 11-cis-retinal, the chromophore of rhodopsin and cone pigments (for review, see Refs. 8–10). In this cycle, all-trans-retinal dissociates from rhodopsin and cone pigments after photobleaching. In the photoreceptors, all-trans-retinal is reduced to all-trans-retinol and subsequently exported to the adjacent RPE. In the RPE, all-trans-retinol is esterified by LRAT and stored. All-trans-retinyl esters have been suggested to be the substrate for a putative isomerohydrolase in the RPE (11) and for a retinyl ester hydrolase that produces all-trans-retinol, a substrate for the putative isomerase (for review, see Ref. 12). Ultimately, 11-cis-retinol is produced, oxidized to 11-cis-retinal, and exported to the photoreceptors. In the rod and cone photoreceptor outer segments, 11-cis-retinal recombines with opsins to form rhodopsin and cone pigments (for review, see Ref. 8).
Human LRAT cDNA was cloned from a retinal-RPE cDNA library (7) and rodent Lrat cDNA from liver and other tissues (13–15). Lrat mRNA was shown to be a 5.0-kb species expressed in the RPE, and the multiple transcripts based on differential polyadenylation were detected in several other tissues known for the highest LRAT activity (13). The human LRAT polypeptide consisted of 230 amino acids and is predicted to be an integral membrane protein with two transmembrane domains. Based on the primary sequence, LRAT is a member of a large N1pC/P60 superfamily involved in murein degradation, amide hydrolysis, and acyl transfer (16). Eukaryotic members of this family include the class II tumor suppressor genes and the nematode developmental regulator Egl-26 (17). Site-specific mutagenesis of recombinant human LRAT revealed that of four Cys residues, Cys161 is a nucleophile creating a thioacyl-enzyme intermediate, which is then transferred to all-trans-retinol (18, 19). Further mutagenesis experiments identified two His residues essential for LRAT catalytic activity (19).
The human LRAT gene consists of three exons and is located as a single copy on chromosome 4q31.2 (20). Because of its key role in the retinoid cycle, defects in the LRAT gene are predicted to have severe consequences on vision and retinoid metabolism. Screening of 267 retinal dystrophy patients identified two disease-associated mutations inherited recessively (21). The missense mutation S175R and a frameshift mutation 396delAA inactivated LRAT. Patients carrying the S175R LRAT null gene developed normally, suggesting that the lack of LRAT in the liver and other tissues had no deleterious effects. However, their visual functions are severely attenuated, causing early onset severe retinal dystrophy. To characterize further the consequences of deleting the LRAT gene, we generated Lrat−/− and Lrat−/− mice by the standard gene replacement technique. The homozygous knock-out Lrat−/− animals exhibit slow degeneration of the retina. The RPE of Lrat−/− mice is devoid of all-trans-retinol or all-trans-retinyl esters, photoreceptors have no functional rhodopsin, and electroretinogram (ERG) responses are highly attenuated. Lrat−/− mice are an important experimental model for human retinal dystrophies and for vitamin A deprivation.
MATERIALS AND METHODS
Animals
All animal experiments employed procedures approved by the University of Washington, University of Utah, and Washington University Animal Care Committees and conformed to recommendations of the American Veterinary Medical Association Panel on Euthanasia and recommendations of the Association of Research for Vision and Ophthalmology. Animals were maintained in complete darkness, and all manipulations were done under dim red light employing a Kodak no. 1 safelight filter (transmittance >560 nm). Rpe65−/− mice, obtained from Dr. M. Redmond (NEI, National Institutes of Health), were genotyped as described previously (22). Typically, 6 –12-week-old mice were used in all experiments.
Construction of Targeting Vector and Generation of Lrat−/− Mice
A ~14-kb genomic clone was isolated from a 129SvEvλ library. The probe used for screening was amplified with PCR primers LRAT2 (5′-GACGTGTTGGAGGTGTCACGGAC-3′) and LRAT4 (5′-CTTGTGTGTGCAGACCAAGATGAC-3′), fragment size 660 bp. The targeting vector was constructed by using a 1,350-bp DNA fragment as a short arm, which was PCR product amplified using the LRATSA1 and LRATSA2 primers. LRATSA1 is located 3.6 kb upstream of exon 1 (containing ATG), with the sequence 5′-GTACCCAGGAGTAGGACCAAC-3′. LRATSA2 is located 2.2 kb upstream of exon 1, with the sequence 5′-TGTGAGTGAGAGGCCACATCC-3′. The short arm was inserted into the 5′-end of the Neo gene cassette using an MluI site. The long arm was a 10-kb genomic fragment that starts from SmaI site (inside exon 1) to the end of the 14-kb λ clone. In this strategy, the part of the coding sequence of exon 1 (including ATG) and the 2.2-kb upstream sequence was replaced by a Neo gene cassette. 10 μg of the targeting vector was linearized by NotI and then transfected by electroporation of 129 SvEviTL1 embryonic stem cells. After selection in neomycin-containing medium G418, surviving colonies were expanded. PCR analysis was performed to identify clones that had undergone homologous recombination. PCR was done using primer pairs LRATSA6 and Neo1. Primer LRATSA6 is located outside of short arm, 80 bp upstream of LRATSA1, with the sequence 5′-AAAGAATCAATAGGACAAAGAACTGG-3′. Primer Neo1 is located in the 5′-promoter region of the Neo gene cassette and has the sequence 5′-TGCGAGGCCAGAGGCCACTTGTGTAGC-3′. The positive clones were identified based on the 1.4-kb PCR fragment. The correctly targeted embryonic stem cell lines were microinjected into C57BL/6J blastocysts. The chimeric mice were generated, and they gave germ line transmission of the disrupted Lrat gene.
Genotyping Lrat−/− and Lrat+/− Mice
To identify the wild-type allele, primer pairs LRATSA1/LRATWT1 (1.4-kb fragment) or LRAT1S/LRATWT1 (300-bp fragment) were used. LRATWT1 is located 44 bp downstream of LRATSA2, with the sequence 5′-AAGTGCTGGGCATGGTGACTTGTG-3′. The knock-out gene was identified with LRAT1S (5′-TCCAGTTCCAGACTCTTTCCACCCAC-3′) and Neo-1 (370-bp fragment). The PCR conditions were 94 °C for 30 s; 60 °C for 30 s; 72 °C for 120 s; total of 30 cycles. The mice were outbred into the C57BL/6J strain.
Mouse Anti-Lrat Monoclonal Antibody Production
We isolated mouse RPE RNA using the MicroAqueous RNA Isolation Kit (Ambion). Lrat cDNA was amplified using Hotstart Turbo Pfu Polymerase (Strat-agene) using the primers 5′-GCTCACCTCGTACAGAACAGTTGC-3′ and 5′-ACATACACGTTGACCTGTGGACTG-3′. A fragment of Lrat corresponding to the residues Gln89–Glu179 in the polypeptide sequence of mouse Lrat was amplified using the primers 5′-CATATGCAGAAGGTGGTCTCCAACAAGCGT-3′ and 5′-GGATCCTCACTCAGCCTGTGGACTGATCCGAGA-3′ and cloned downstream of a His6 tag between the NdeI and BamHI sites of the inducible bacterial expression vector pET15b (Invitrogen). The plasmid was transformed into BL-21RP cells (Stratagene), and expression was induced with isopropyl-1-thio-β-d-galactopyranoside. The His6-tagged fragment of the mouse Lrat protein (10 kDa) was purified by nickel-nitrilotriacetic acid affinity chromatography using the manufacturer’s protocol (Qiagen). The purified protein was examined by gel electrophoresis. After in-gel trypsin digestion, the eluted tryptic peptides were examined by microsequencing by liquid chromatography-mass spectrometry to verify the identity of the recombinant Lrat fragment. The purified protein was used to immunize mice as described before (23), and the monoclonal antibody was produced by established methods (24). The antibody was tested for its specificity by immunocytochemical testing of the Lrat+/+ and Lrat−/− mouse retinas.
Rhodopsin Measurements
All procedures were performed under dim red light as described previously (25–27). Typically, two mouse eyes were used per rhodopsin measurement. Mouse eyes were enucleated and rinsed with double-stilled H2O. The lenses were removed, and the eyes were cut into three or four pieces and frozen immediately on a dry ice/EtOH bath. Rhodopsin was extracted with 0.9 ml of 20 mm BisTris propane, pH 7.5, containing 10 mm dodecyl-β-maltoside and 5 mm freshly neutralized NH2OH·HCl. The sample was homogenized with a Dounce tissue homogenizer and shaken for 5 min at room temperature (Eppendorf mixer 5432). The sample was then centrifuged at 14,000 rpm for 5 min at room temperature (Eppendorf centrifuge 5415C). The supernatant was collected, and the pellet was extracted one more time. The combined supernatants were centrifuged at 50,000 rpm for 10 min (Beckman Optima TLX centrifuge/TLA100.3 fixed angle rotor), and absorption spectra were recorded before and after a 12-min bleach (60-watt incandescent bulb). The concentration of rhodopsin was determined by the decrease in absorption at 500 nm using the molar extinction coefficient ɛ = 42,000 m−1 cm−1.
Retinoids
All experimental procedures related to extraction, derivatization, and separation of retinoids from dissected mouse eyes were carried out as described previously (25, 28 –30). All reactions involving retinoids were carried out under dim red light. Retinoids were separated by normal phase HPLC (Beckman, Ultrasphere-Si, 4.6 × 250 mm) with 10% ethyl acetate and 90% hexane at a flow rate of 1.4 ml/min with detection at 325 nm using an HP1100 HPLC with a diode array detector and HP Chemstation A.03.03 software.
ERGs
Mice were anesthetized by intraperitoneal injection using 20 μl/g body weight of 6 mg/ml ketamine and 0.44 mg/ml xylazine diluted with 10 mm sodium phosphate, pH 7.2, containing 100 mm NaCl. The pupils were dilated with 1% tropicamide. A contact lens electrode was placed on the eye, and ground electrodes were placed in the ear and tail. ERGs were recorded with the universal testing and electrophysiologic system UTAS E-3000 (LKC Technologies, Inc.). The light intensity was calibrated and computer-controlled. The mice were placed in a Ganzfeld chamber, and scotopic and photopic responses to flash stimuli were obtained from both eyes simultaneously. Flash stimuli had a range of intensities (−3.7–2.8 log cd·s·m−2), and white light flash duration was adjusted according to intensity (from 20 μs to 1 ms). Three to five recordings were made with >10-s intervals, and for higher intensity intervals, intervals were 10 min or as indicated. There were no significant differences between the first and fourth flashes. Light-adapted responses were examined after bleaching at 1.4 log cd·m−2 for 15 min. Typically, four to eight animals were used for recording of each point in all conditions. Leading edges of the ERG responses were fitted with a model of rod phototransduction activation as described previously (25). The results were examined using the one-way ANOVA test.
Pupillometry
Mice were dark-adapted for at least 1 h prior to recordings. Pupillary light responses were recorded under infrared conditions using a CCD video camera; data analysis was performed by video pupillometry. Light stimuli were provided by a halogen source. Wavelength and intensity were manipulated with neutral density and narrow bandwidth (10 nm) interference filters (Oriel). Irradiance measurements (watts/m2) were made using a calibrated radiometer (Advanced Photonics International).
Light Microscopy
For light microscopy, eyecups were fixed in 2% glutaraldehyde, 2% paraformaldehyde for 18 h, infiltrated with 20% sucrose in 0.1 m sodium phosphate, pH 7.4, and then embedded in 33% OCT compound (Miles) diluted with 20% sucrose in 0.1 m sodium phosphate, pH 7.4. Thin sections were cut at 5 μm and subjected to light microscopy.
Immunocytochemistry
All procedures have been described previously (23). Sections were analyzed under an episcopic fluorescent microscope (Nikon). Digital images were captured with a digital camera (Diagnostic Instruments; Sterling Heights, MI).
Transmission Electron Microscopy (EM)
For transmission EM, mouse eyecups were fixed primarily by immersion in 2.5% glutaraldehyde, 1.6% paraformaldehyde in 0.08 m PIPES, pH 7.4, containing 2% sucrose initially at room temperature for ~1 h then at 4 °C for the remainder of 24 h. The eyecups were then washed with 0.13 m sodium phosphate, pH 7.35, and secondarily fixed with 1% OsO4 in 0.1 m sodium phosphate, pH 7.35, for 1 h at room temperature. The eyecups were dehydrated through a methanol series and transitioned to the epoxy embedding medium with propylene oxide. The eyecups were embedded for sectioning in Eponate 812. Ultrathin sections (60 –70 nm) were stained with aqueous saturated uranium acetate and Reynold’s formula lead citrate prior to survey and micrography with a Philips CM10 EM.
RESULTS
Mouse Lrat Gene and Targeting Construct
The mouse Lrat gene appears to be present as a single copy in the mouse (and human) genomes. The entire mouse Lrat gene sequence can be found at the NCBI web site as a complement (18,757,074.18,766,035) at locus NT_039234 (containing 26,830,222 bp). The published mouse Lrat cDNA sequence (15) and an expressed sequence tag (accession BY705162) have a 250 –267-nucleotide 5′-untranslated region that perfectly matches the upstream gene sequence. Thus, in contrast to human LRAT, the mouse Lrat gene most likely has no upstream untranslated exon and consists only of two coding exons. The intervening sequence in the mouse Lrat gene is ~6,040 bp in length (human ~4,080 bp). LRAT expressed sequence tags have been identified in multiple tissues, including the colon, testis, liver, spleen, and mammary gland (e.g. see www.ncbi.nlm.nih.gov/UniGene/clust.cgi?ORG=Mm&CID=33921).
In the Lrat targeting vector, part of the coding sequence of exon 1 (including ATG) and a 2.2-kb upstream sequence was replaced by a Neo gene cassette, disabling translation of a functional product (Fig. 1A). To generate chimeric mice, correctly targeted embryonic stem cell lines were microinjected into C57BL/6J blastocysts. Heterozygous knock-out mice with germ line transmission were generated by standard outbreeding procedures (Ingenious Targeting, Stony Brooks, NY). The wild-type allele was identified using the primer pair of LRAT1S and LRATWT1 (diagnostic fragment ~300 bp) and the knockout gene using LRAT1S and Neo1 (370 bp) (Fig. 1B). The expression of Lrat is abolished in the eye of Lrat−/− mice as determined by immunocytochemistry (Fig. 1C). Immunoblotting revealed two major molecular forms of Lrat (28 kDa and 25 kDa) in the eye (Fig. 1D) or in the liver (data not shown) of Lrat+/+ mice which could arise by alternative splicing/post-translational modifications. Both forms are absent in Lrat−/− mice. The reason for the difference between the forms was not investigated further. The Lrat−/− mice develop normally, have similar weight, females are fertile at a normal level, whereas males appear to be frequently infertile. This observation is consistent with the role of retinoids in the reproductive system of males, as observed employing vitamin A-deprived mice (32).
Fig. 1. The mouse Lrat gene and the targeting construct.
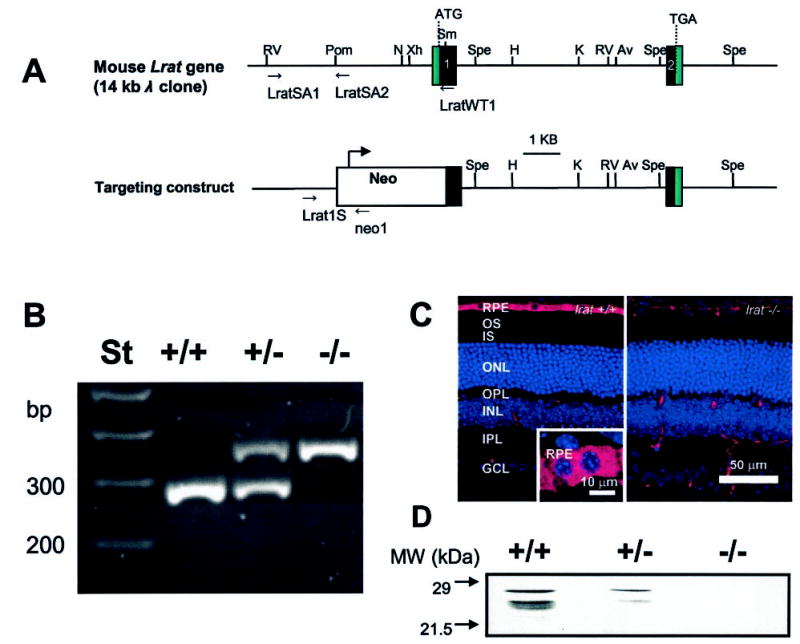
A, the mouse Lrat gene consists of two exons (black boxes) separated by a 6-kb intron. Relevant restriction sites present in the gene are: N, NaeI; Spe, SpeI; Xh, XhoI; K, KpnI; Av, AvrII; RV, EcoRV; H, HindIII; Pom, PspOMI. In the targeting construct, part of exon 1 including ATG is replaced by a Neo cassette. B, genotyping of Lrat+/+, Lrat+/−, and Lrat−/− mice. The wild-type Lrat gene fragment was amplified with primers LRAT1S and LRATWT1 yielding a ~300-bp product; the knock-out gene was amplified with primers LRAT1S and pgkNeo1, yielding a ~370-bp product. C, immunocytochemistry of Lrat+/+ and Lrat−/− mouse retina. Frozen sections of 8-week-old mice were probed with the monoclonal anti-Lrat antibody, generated as described under “Materials and Methods.” The specific response is present exclusively in the RPE cell layer in the eye of Lrat−/− mice. Scale bar, 50 μm. Inset, higher magnification of the RPE layer. Scale bar, 10 μm. D, immunoblotting of an extract from the Lrat mouse retina. The blot was developed using monoclonal anti-Lrat antibody.
Histology and Ultrastructure of the Retina from Lrat+/− and Lrat−/− Mice
At 6–8 weeks of age, the only major change in histology of the retina observed at the light microscopy levels is an ~35% reduction in the length of ROS in the retina when Lrat−/− mice are compared with Lrat+/− mice (Fig. 2, A and B, n = 3). The outer nuclear layer and inner retina appeared to be comparable between these mice (Fig. 2C). Quantitative calculations of the thickness of different retinal layers showed no significant variation between these two genetic backgrounds within the experimental error (Fig. 2D). Retinas of Lrat+/− mice were indistinguishable from those of Lrat+/+ mice (data not shown). EM analysis of the retina and the RPE layer revealed no gross changes between Lrat−/− mice with the exception of shorter ROS as noted by light microscopy (Fig. 3). ROS are shorter and thinner, and they are less tightly packed. Higher resolution images of the RPE did not unveil any differences between Lrat−/− mice and WT mice (data not shown). Higher resolution at the synaptic terminal of the photoreceptors showed less developed synaptic ribbons (Fig. 3, C and D). In 4.5-month-old Lrat−/− mice, ROS are ~one-half length compared with normal, and there is a minor reduction in the number of photoreceptor nuclei (<10%).
Fig. 2. Retina histology of Lrat−/− and WT mice.
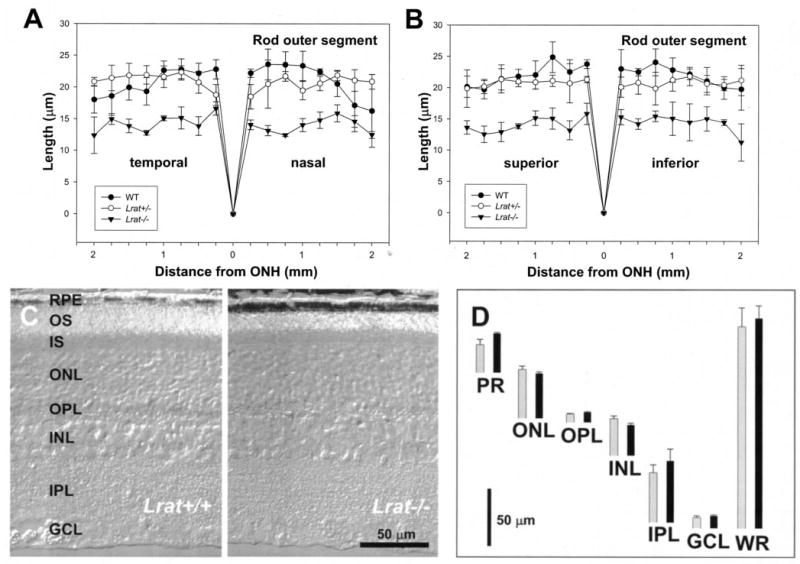
A and B, ROS thickness (in μm) plotted as a function of the retinal location (in mm) from the optic nerve head. The age of mice was 6 –8 postnatal weeks. Closed circles, Lrat+/+ mice; open circles, Lrat+/− mice; closed triangles, Lrat−/− mice. For details, see “Materials and Methods.” C, a representative crosssection (Nomarsky optics) of the retina from Lrat+/+ and Lrat−/− mice. Note that the ROS in the retina of Lrat−/− mice are ~35% shorter than those of Lrat+/+ mice. D, quantification of the thickness of different layers of the retina from WT (black bars) and Lrat−/− mice (gray bars) measured at 1.25 mm inferior from optic nerve head. OS, outer segment; IS, inner segment; ONL, outer nuclear layer; OPL, outer plexiform layer; INL, inner nuclear layer; IPL, inner plexiform layer; GCL, ganglion cell layer; PR, photoreceptor outer and inner segments; WR, whole retina.
Fig. 3. Transmission EMs of the RPE and ROS.
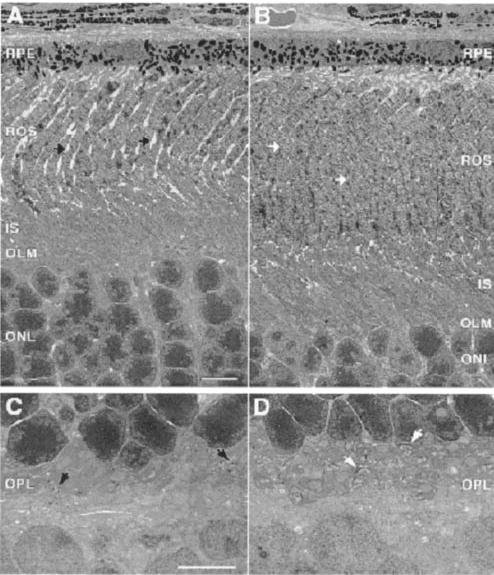
A and C, retina section of Lrat−/− mice. B and D, retina section of Lrat+/− mice. A and B show the cross-section of the RPE and the photoreceptor cells. C and D show a higher magnification of the synaptic terminal region of the photoreceptors cell. Arrows indicate the synaptic terminal of the photoreceptors cells. The preparation of sections is described under “Materials and Methods.” Note the shortening of ROS in Lrat−/− mice and disorganization of the synaptic terminals. Scale bars are 5 μm.
Retinoid Analysis from Lrat−/− Mouse Eyes
To eliminate any interference from background light on the isomeric composition of retinoids in the eye, all mice were raised in the dark. All retinoids were identified by coelution with authentic retinoids and on-line UV spectroscopy. For Lrat+/+ mice and Lrat+/− mice, 535 ± 95 and 442.5 ± 50.9 pmol/eye of 11-cis-retinal were observed, respectively (Fig. 4). These amounts are comparable with mice of other genetic backgrounds used in our studies (33–35). The rhodopsin levels in Lrat+/+ and Lrat+/− were comparable and similar to corresponding values of 11-cis-retinal as determined from the retinoid analyses (data not shown). Lrat+/+ and Lrat+/− mice differed in their level of all-trans-retinyl esters. Typically, the eyes from Lrat+/+ mice contained all-trans-retinyl esters (28.5 ± 13 pmol/eye). The eyes from Lrat+/− mice contained 15.2 ± 4 pmol/eye of all-trans-retinyl esters (Fig. 4). Retinoid analyses of 4 –8-week-old Lrat−/− mice showed very low amounts of all-trans-retinol at ~8.3 pmol/eye (Fig. 4), which most likely comes from the blood in the eye sample. All-trans-retinyl esters were present only in trace amounts, and no other retinoids were definitively identified. In all cases, the majority (>95%) of all-trans-retinyl esters were present in RPE (data not shown).
Fig. 4. Chromatographic separation of nonpolar retinoids from Lrat mouse eyes.
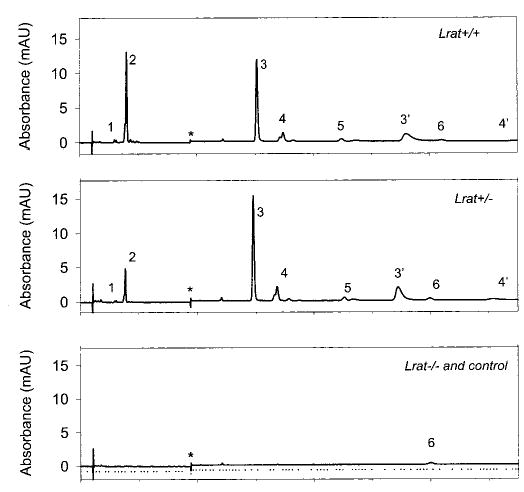
Retinoids were extracted from the eye and separated on normal phase HPLC as described under “Materials and Methods.” The peaks correspond to the following retinoids: 1, 13-cis-retinyl esters/11-cis-retinyl esters; 2, all-trans-retinyl esters; 3, 3′, syn-and anti-11-cis-retinal oximes; 4, 4′, syn- and anti-all-trans-retinal oximes; 5, 11-cis-retinol; 6, all-trans-retinol. * indicates artifacts related to a change in the solvent composition. Pure hexane was used as a control. Note that retinals are detected after conversion to oximes with NH2OH·HCl.
Retinoid Analysis from Liver, Blood, and Lung of Lrat−/− Mice
The results of the analysis of retinoids from the liver and blood of Lrat−/− mice mirrored the lack of all-trans-retinyl esters in the RPE of Lrat−/− mice, whereas the all-trans-retinyl ester levels of Lrat+/− mice were comparable with those from Lrat+/+ mice (Fig. 5 and Table I). Similar amounts of all-trans-retinol in the blood were found in Lrat+/+ and Lrat+/− mice although slightly reduced in Lrat−/− mice (Table I). A similar dramatic decrease of all-trans-retinyl esters was observed in the lung of Lrat−/− mice (data not shown). This reduction in the ester content is consistent with the high activity of LRAT in the lung (14).
Fig. 5. Chromatographic separation of nonpolar retinoids in the blood and liver from Lrat−/− mouse.
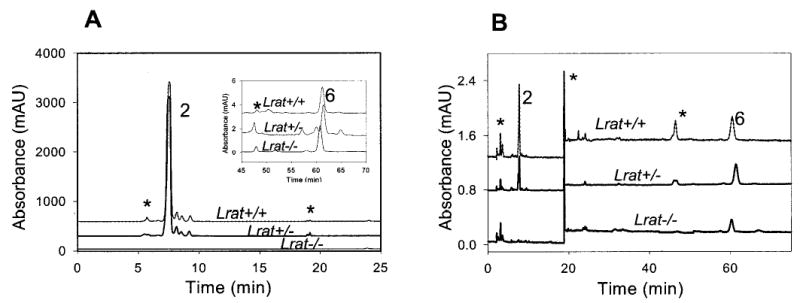
A, liver; B, blood. Retinoids were extracted from the tissues and separated on normal phase HPLC. The peaks correspond to the following retinoids: 2, all-trans-retinyl esters; 6, all-trans-retinol. * indicates artifacts related to a change in the solvent composition or compounds unrelated to retinoids.
Table I. All-trans-retinyl esters and all-trans-retinol in the liver and blood in mice from different genetic backgrounds.
The results are presented ± S.D., and n was between 3 and 5.
|
Lrat+/+
|
Lrat+/−
|
Lrat−/−
|
||||
|---|---|---|---|---|---|---|
| Retinoid | Livera | Bloodb | Livera | Bloodb | Livera | Bloodb |
| μmol | pmol | μmol | pmol | μmol | pmol | |
| All-trans-retinyl esters | 291.1 ± 30.6 | 21.10 ± 6.10 | 353.1 ± 20.7 | 7.80 ± 3.61 | Trace | Trace |
| All-trans-retinol | 0.60 ± 0.13 | 17.4 ± 5.09 | 0.98 ± 0.22 | 25.4 ± 12.5 | 0.45 ± 0.20 | 8.02 ± 2.2 |
Expressed per whole liver (623–780 mg).
Expressed per 100 μl of blood.
ERG Analysis
To evaluate the light response, Lrat−/− mice were studied using ERG under multiple conditions (36). Analysis of a- and b-waves showed statistically significant differences (one-way ANOVA) in the amplitudes between Lrat+/+ mice and Lrat−/− mice in both dark- (p < 0.0001) and light-adapted conditions (p < 0.01) (Fig. 6, A and B) and the values of sensitivity that were calculated with maximal a-wave amplitudes of these mice in the dark-adapted conditions (p < 0.001) (Fig. 6, C and D), respectively. Furthermore, flicker responses at a fixed frequency of 10 Hz were attenuated for Lrat−/− mice at dark- and light-adapted conditions (Fig. 7). In both conditions, flicker ERG amplitudes show elevated thresholds and smaller amplitude in Lrat−/− mice. These ERG data suggest that rod and cone functions of Lrat−/− mice are dramatically affected presumably because of a lack of chromophore and absence of functional visual pigments. Lrat−/− mice appear to have a more pronounced phenotype than Rpe65−/− mice (25).
Fig. 6. Single flash ERG responses of increasing intensity for Lrat−/− and Lrat+/+ mice.
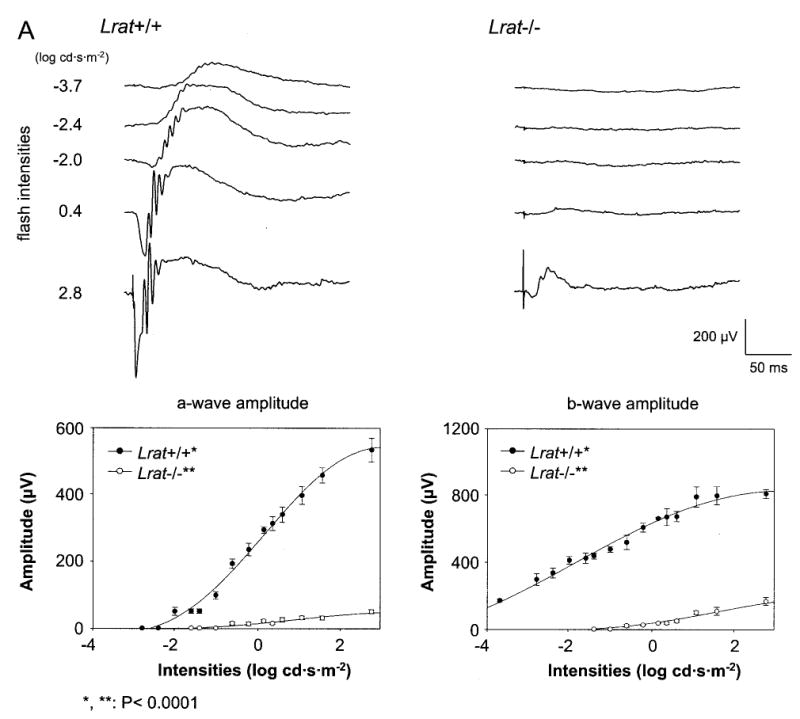
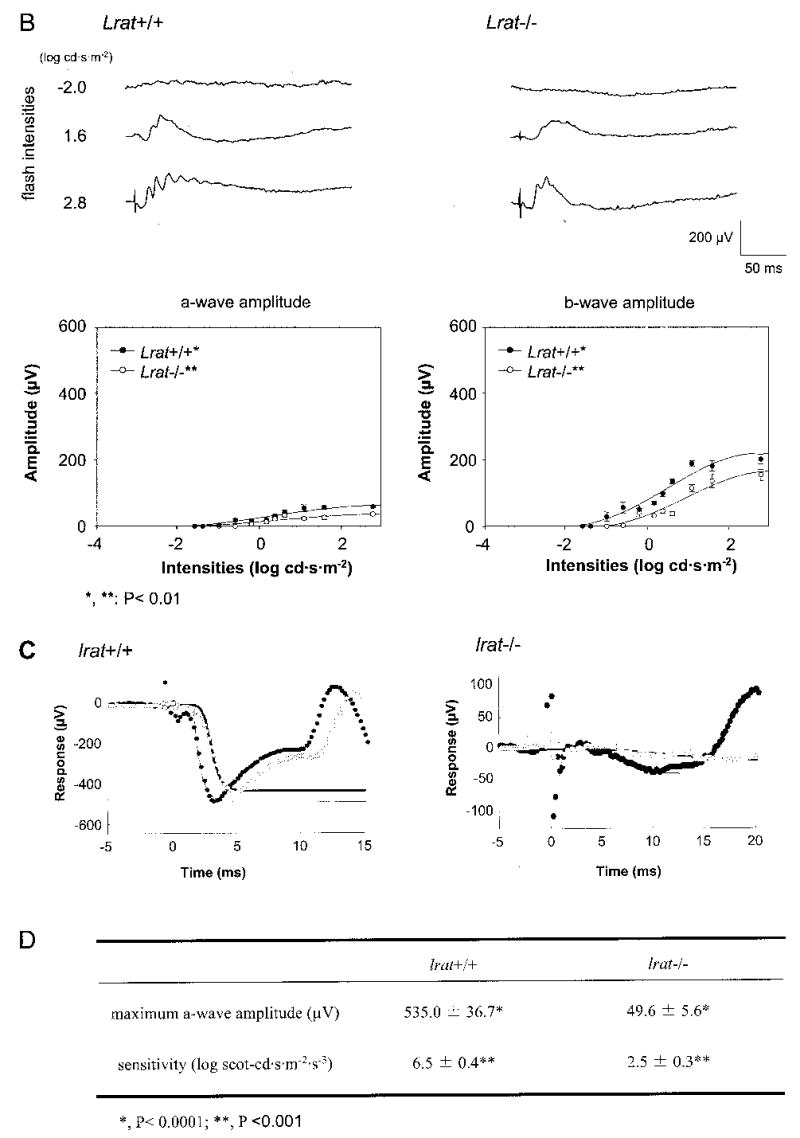
A and B, serial responses to increasing flash stimuli obtained from Lrat+/+ and Lrat−/− mice in dark-adapted (upper A panel) and light-adapted (upper B panel) conditions. Plotted ERG responses (a-wave and b-wave amplitudes) to increasing light stimuli in Lrat−/− show significantly lower responses compared with Lrat+/+ in both conditions (lower A panel, p < 0.0001; lower B panel, p < 0.01, one-way ANOVA). Light-adapted responses are examined after bleaching at 1.4 log cd·m−2 for 15 min. C, leading edges (initial 5–20 ms depending on response) of dark-adapted ERG photoresponses (symbols) evoked by 2.8-(filled circles) and 1.6-(open circles) log cd·s·m−2 flashes, are fit with a model of phototransduction (smooth lines). The amplitude and sensitivity of the Lrat−/− mouse photoresponses are reduced from maximal responses. D, maximum a-wave amplitude and sensitivity parameters of dark-adapted photoresponses in Lrat−/− mice compared with the results in Lrat+/+ mice. Lrat−/− mice show significant differences in both parameters (*, p < 0.0001; **, p < 0.001, one-way ANOVA) compared with Lrat+/+ mice. Error bars represent 1 S.E. in A and B.
Fig. 7. Flicker ERG in Lrat−/− mice.
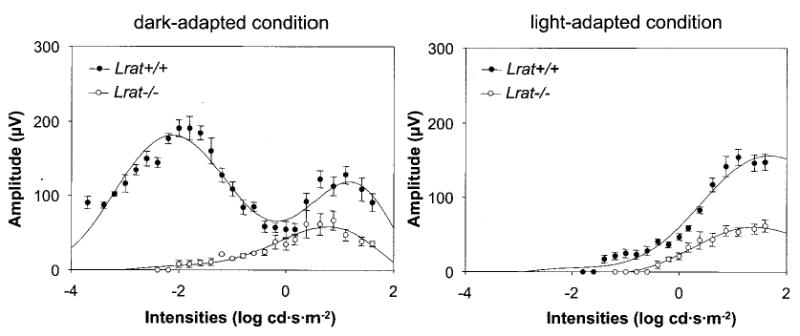
Intensity-dependent response of 10-Hz flicker ERGs for Lrat−/− in dark-adapted (left panel) and light-adapted (right panel) condition. The flicker recordings were obtained with a range of intensities of −3.7–1.6 log cd·s·m−2 at a fixed frequency (10 Hz). Lrat−/− mice showed the threshold elevation with smaller amplitudes compared with Lrat+/+ mice. Light-adapted responses are examined after bleaching at 1.4 log cd·m−2 for 15 min.
Pupillary Responses
Pupillary light responses (PLR) of un-anesthetized animals were measured to 470 nm narrow pass filtered light using infrared videography. As shown in Fig. 8, sensitivity of the PLR again was indistinguishable between Lrat+/− and Lrat+/+ mice. However, Lrat−/− mice demonstrated a profound ~3 log loss of PLR sensitivity (Fig. 8). PLR of Lrat−/− mice were slightly more attenuated than those of Rpe65−/− mice.
Fig. 8. Irradiance-response relationship for pupillary constriction in response to monochromatic 470 nm light.
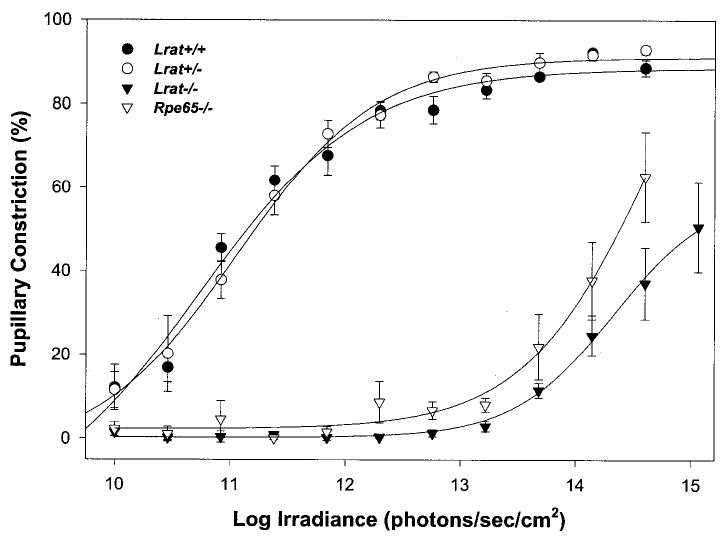
Percent pupillary constriction was calculated as 100*(1 − (minimum pupil area during 30-s light pulse/dark-adapted, prepulse pupil area)) (mean ± S.E.). Each curve was fitted via four-parameter sigmoidal regression analysis (SigmaPlot 2000). For Lrat+/+ mice, n was 5; Lrat+/− mice, n = 5; Lrat−/− mice, n = 10; Rpe65−/− mice, n = 5.
Flow of Retinoids in Lrat+/− Mice
To understand how the flow of retinoids in the eye was affected by loss of one allele of the Lrat gene, dark-adapted Lrat+/− mice were exposed to intense light (bleaching ~40% rhodopsin), transferred to the dark, and analyzed at the indicated time points (Fig. 9). As expected, bleaching caused formation of all-trans-retinal, which was reduced to all-trans-retinol by photoreceptor all-trans-retinol dehydrogenases (8) with kinetics comparable with Lrat+/+ (Fig. 9a). Consistently, we observed elevated levels of all-trans-retinol in Lrat+/− mice (58 ± 12 pmol/eye at 5–40 min) compared with Lrat+/+ mice (7.8 ± 2 pmol/eye). These amounts of all-trans-retinol in the eye of Lrat+/− mice were only ~10% of the total amount of 11-cis-retinal. All-trans-retinol levels in Lrat+/− mice resemble those in Lrat+/+ at 60 min postbleaching (Fig. 9b). HPLC analysis of the microdissected retina and the isolated RPE demonstrated that the majority of the retinol is present in the retina (data not shown). The total amount of all-trans-retinyl esters also showed a clear accumulation in Lrat+/− mice (Fig. 9c). This accumulation of all-trans-retinyl esters might result from a slower utilization of esters and slightly slower production of 11-cis-retinal. 11-cis-Retinol kinetics appeared to be unaffected in Lrat+/− mice (Fig. 9d), suggesting that oxidation to 11-cis-retinal was still faster than other rate-limiting processes in the retinoid cycle. Finally, the accumulation and subsequent slight decrease of all-trans-retinyl esters paralleled the rate of 11-cis-retinal formation. The decrease in esters formed after the bleach roughly paralleled synthesis of 11-cis-retinal. The decrease in LRAT activity affected mostly the formation of all-trans-retinyl esters (Fig. 9). We conclude that the phenotype of Lrat+/− mice is mild, suggesting that Lrat activity exceeds the requirements of the retinoid cycle for esterification in wild-type mice. These results are consistent with the autosomal recessive inheritance pattern of early onset severe retinal dystrophy caused by null mutations in the LRAT gene.
Fig. 9. Kinetics of retinoid recovery in Lrat+/− and Lrat+/+ mice.
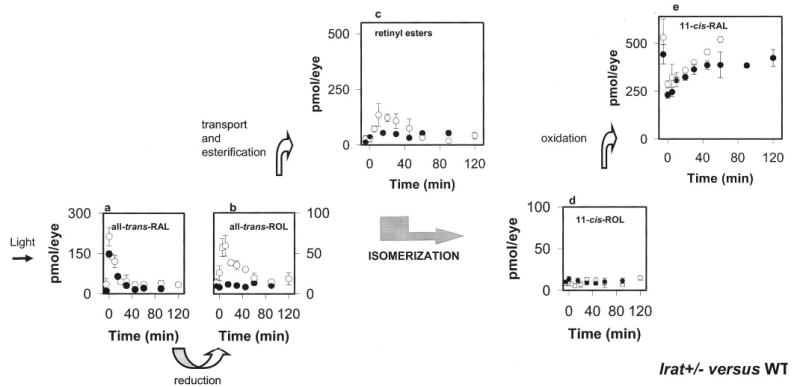
A, mice were reared in the dark. HPLC retinoid analysis was performed either before or after a flash that bleached ~40% of the visual pigment. Photoactivated rhodopsin releases all-trans-retinal (RAL; a), which is reduced to all-trans-retinol (ROL; b), transported to the RPE, and then esterified to all-trans-retinyl esters (c). All-trans-retinol, or its derivative, is isomerized to 11-cis-retinol (d), which in turn is oxidized to 11-cis-retinal (e). Open circles and closed circles represent data obtained from Lrat+/− mice and Lrat+/+ mice, respectively. Error bars indicate the S.E. (n = 4 –8).
DISCUSSION
All-trans-retinol (vitamin A), its esters, and its precursor β-carotene are important sources of circulating retinoids in vertebrates (38). In mouse tissues the highest concentration of retinoids is detected in the liver in the form of all-trans-retinyl esters (39). Another tissue that stores all-trans-retinyl esters is the RPE, which recycles retinoids and supports vision by providing the chromophore of the visual pigments. Because of the role of retinoids in regulating genes involved in cell morphogenesis, differentiation, and vision, it is important to understand all-trans-retinyl ester formation and the storage process. To gain further insight into the function of LRAT, the enzyme that produces all-trans-retinyl esters, we generated mouse lines with targeted disruption of the Lrat gene by homologous recombination (Fig. 1). This knock-out approach could also provide information about the consequences of Lrat loss and the relative contribution of alternative enzymes to all-trans-retinyl ester formation, such as coenzyme A-retinol acyltransferase (1, 40), or putative LRAT isozymes. Here, we describe an animal model that lacks LRAT activity, primarily focusing on the visual system.
The impact of the disruption of the Lrat gene on the visual physiology was determined in vivo with ERG. Rod retinal function of Lrat−/− mice was detectable but impaired (Figs. 6 and 7). For dark-adapted ERGs, the ERG b-wave threshold was elevated by ~5–6 log units compared with Lrat+/+ mice. ERG photoresponses in the knock-out animal had an abnormal maximum amplitude and sensitivity (data not shown). As observed for Rpe65−/− mice (25, 41), the ERG responses of Lrat−/− mice most likely originate from rods and cones but are highly attenuated (Fig. 7). Changes in the morphology of the Lrat−/− retina are small, as evidenced by slight shortening of ROS at early age (6 –8 weeks). This abnormality may result from the constitutive activity of opsin because steady-state activation of phototransduction by the receptor (42–44) was also proposed as a cause of retinal degeneration in Rpe65−/− mice (28, 45). Similar observations were made for Rpe65−/− mice which also contain large amount of opsin, reduced length of ROS, but minute amounts of active visual pigments (28, 46). A similar shortening of ROS can be observed also at the early stages of retinal dystrophies in human (e.g. Ref. 47) and mouse (48). The initial preservation of the ROS structure increases the potential use of this animal model for designing experiments to restore vision in these mice. Changes at the synaptic terminal of photoreceptor cells are reminiscent of those observed in animals with nonfunctional voltage-dependent Ca2+ channels (49) and could result from the active phototransduction processes and subsequent lower release rates of the neurotransmitter glutamate.
The lack of significant amounts of all-trans-retinyl esters decreases the likelihood that the activity of a putative coenzyme A-retinol acyltransferase enzyme (1, 40) has an essential role in retention of all-trans-retinol. The residual levels of all-trans-retinol in some tissues could result from contamination by blood because blood contains some all-trans-retinol from the diet (Table I). One consequence of the lack of retinoids is the absence of measurable amounts of the functional visual pigments. Therefore, we conclude that LRAT is a key component of the visual cycle and essential for trapping retinoids in the RPE of the eye.
The PLR of Lrat−/− mice are consistent with substantial loss of ocular photoreception. Recent work has demonstrated that the PLR are controlled by both outer retinal (i.e. rod/cone) and inner retinal photoreceptors (photosensitive retinal ganglion cells) (50, 51). The inner retinal-mediated PLR are ~1 log unit less sensitive than the outer retinal system. A novel member of the opsin family, melanopsin, is expressed predominantly in the photosensitive retinal ganglion cells (52). Mice with outer retinal photoreceptor degeneration (rd1/rd1) or severe dysfunction (Gnat1/−/− Cnga3−/−) which also lack melanopsin lose all PLR (51, 53). Lrat−/− mice lost most of the photopic sensitivity of the PLR. The PLR of these mice were at least 1 log less sensitive to light than has been reported to rd1/rd1 (51) or rdrd/cl (50), suggesting that an inner retinal photoreceptor utilizes a retinal-based pigment. The most reasonable explanation is that Lrat activity is necessary for the generation of a functional melanopsin. However, it is difficult under this model to explain the partial preservation of the PLR in Lrat−/− mice. Either melanopsin can utilize a chromophore that does not require LRAT activity (albeit with reduced function), or another photopigment is capable of mediating PLR function in the presence of melanopsin apoprotein. Interestingly, another inner retina-mediated process, namely retinohypothalamic signaling to the suprachiasmatic nucleus, important for circadian rhythm entrainment, is preserved in the face of near total vitamin A depletion (54).
Taking into account the multiple functions of retinoids such as regulation of the immune system, reproduction or development, and considering that LRAT is highly expressed in the liver and other tissues in addition to the eye, the lack of LRAT activity was expected to be lethal. However, Thompson and colleagues (21) reported disease-associated LRAT gene mutations (S175R and 396delAA) in three individuals with severe, early onset retinal dystrophy. The mutant genes are thought to be null because the S175R mutant LRAT has no enzymatic activity when expressed in COS-7 cells, and the 2-bp deletion causes a frameshift and premature translation termination. Consistent with human patients carrying LRAT null genes, Lrat−/− mice have dramatically attenuated visual functions, but these mice appear to be healthy and produce normal size litters. Survival of Lrat null animals may be the result of the presence of another gene product that may substitute for the lack of Lrat activity, even at very low levels and at very low activity. However, based on homology screening with LRAT sequences as seeds (tblastn), the human and mouse genomes do not contain a second LRAT gene. In contrast to mammalian, a second closely related Lrat gene presumably generated by gene duplication has been identified in Fugu rubripes and Danio rerio.2
The Lrat+/− mice, in all measured parameters, are very similar to Lrat+/+ mice including histology of the retina, retinoid levels in the eyes and liver, ERG responses, and pupillary responses. Only slightly affected were the kinetics of retinoid flow with transient accumulation of all-trans-retinyl esters and all-trans-retinol. Because the retinol accumulation in Lrat+/− mice is predicted to result from loss of one Lrat allele, the transient accumulation of esters in Lrat+/−, albeit a small effect, may be related to differences in formation and redistribution of all-trans-retinyl esters in the RPE. This observation is very reminiscent of, but milder than, the phenotype observed for the Rpe65−/− mice (25).
In summary, the Lrat−/− mice will aid in understanding the pathophysiology of early onset severe retinal dystrophy observed in humans with LRAT null alleles (31, 37). In addition, Lrat−/− mice are an excellent vitamin A deprivation model that does not need long lasting dietary approaches. Lrat−/− mice maintained slightly reduced serum levels of all-trans-retinol, likely derived from the diet and maintained in the circulation by retinoid-binding proteins, such as serum RBP. However, the all-trans-retinyl ester levels are reduced dramatically in Lrat−/− mice, for example the level of all-trans-retinyl esters is reduced in liver by more than 10,000-fold. Therefore, this animal model will be useful for dissecting the role of vitamin A in storage and circulation.
Acknowledgments
We thank Dr. M. Redmond for the Rpe65−/− mice, Josh McBee for the mass spectrometrical analysis of bacterially expressed Lrat fragment, and Jing Huang for the antibody production.
Footnotes
This work was supported in part by National Institutes of Health Grants EY09339, EY13385, EY08123, EYK0800403, and EY14988 and by a grant from Research to Prevent Blindness, Inc. (to the Departments of Ophthalmology at the University of Washington and the University of Utah), a center grant from the Foundation Fighting Blindness (to the University of Utah), a grant from the Macular Vision Research Foundation, a Culpepper medical scholar award from the Rockefeller Brothers Foundation, a Becker/Association of University Professors of Ophthalmology/Research to Prevent Blindness clinician-scientist award, and a grant from the E. K. Bishop Foundation.
The abbreviations used are: LRAT, lecithinretinol acyltransferase; ANOVA, analysis of variance; BisTris, 2-[bis(2-hydroxyethyl)amino]-2-(hydroxymethyl)propane-1,3-diol; ERG, electroretinogram; HPLC, high performance liquid chromatography; PIPES, 1,4-piperazinediethane-sulfonic acid; PLR, pupillary light response(s); ROS, rod outer segment(s); RPE, retinal pigmented epithelium; Rpe65, gene for 65-kDa retinal pigment epithelium cell protein; WT, wild-type.
W. Baehr, unpublished data.
References
- 1.Saari JC, Bredberg DL, Farrell DF. Biochem J. 1993;291:697–700. doi: 10.1042/bj2910697. [DOI] [PMC free article] [PubMed] [Google Scholar]
- 2.Schmitt MC, Ong DE. Biol Reprod. 1993;49:972–979. doi: 10.1095/biolreprod49.5.972. [DOI] [PubMed] [Google Scholar]
- 3.MacDonald PN, Ong DE. Biochem Biophys Res Commun. 1988;156:157–163. doi: 10.1016/s0006-291x(88)80818-0. [DOI] [PubMed] [Google Scholar]
- 4.Ong DE, MacDonald PN, Gubitosi AM. J Biol Chem. 1988;263:5789 –5796. [PubMed] [Google Scholar]
- 5.MacDonald PN, Ong DE. J Biol Chem. 1988;263:12478 –12482. [PubMed] [Google Scholar]
- 6.Wald G. J Gen Physiol. 1936;19:781–795. doi: 10.1085/jgp.19.5.781. [DOI] [PMC free article] [PubMed] [Google Scholar]
- 7.Ruiz A, Winston A, Lim YH, Gilbert BA, Rando RR, Bok D. J Biol Chem. 1999;274:3834 –3841. doi: 10.1074/jbc.274.6.3834. [DOI] [PubMed] [Google Scholar]
- 8.McBee JK, Palczewski K, Baehr W, Pepperberg DR. Prog Retin Eye Res. 2001;20:469 –529. doi: 10.1016/s1350-9462(01)00002-7. [DOI] [PubMed] [Google Scholar]
- 9.Bok D. Investig Ophthalmol Vis Sci. 1985;26:1659 –1694. [PubMed] [Google Scholar]
- 10.Saari JC. Investig Ophthalmol Vis Sci. 2000;41:337–348. [PubMed] [Google Scholar]
- 11.Rando RR. Biochemistry. 1991;30:595–602. doi: 10.1021/bi00217a001. [DOI] [PubMed] [Google Scholar]
- 12.McBee JK, Kuksa V, Alvarez R, de Lera AR, Prezhdo O, Haeseleer F, Sokal I, Palczewski K. Biochemistry. 2000;39:11370 –11380. doi: 10.1021/bi001061c. [DOI] [PMC free article] [PubMed] [Google Scholar]
- 13.Zolfaghari R, Wang Y, Chen Q, Sancher A, Ross AC. Biochem J. 2002;368:621–631. doi: 10.1042/BJ20020918. [DOI] [PMC free article] [PubMed] [Google Scholar]
- 14.Zolfaghari R, Ross AC. J Nutr. 2002;132:1160 –1164. doi: 10.1093/jn/132.6.1160. [DOI] [PubMed] [Google Scholar]
- 15.Zolfaghari R, Ross AC. J Lipid Res. 2000;41:2024 –2034. [PubMed] [Google Scholar]
- 16.Anantharaman, V., and Aravind, L. (2003) Genome Biol. http://genomebiology.com/2003/2/3/reviews/0011 [DOI] [PMC free article] [PubMed]
- 17.Jahng WJ, Xue L, Rando RR. Biochemistry. 2003;42:12805–12812. doi: 10.1021/bi035370p. [DOI] [PMC free article] [PubMed] [Google Scholar]
- 18.Mondal MS, Ruiz A, Bok D, Rando RR. Biochemistry. 2000;39:5215–5220. doi: 10.1021/bi9929554. [DOI] [PubMed] [Google Scholar]
- 19.Mondal MS, Ruiz A, Hu J, Bok D, Rando RR. FEBS Lett. 2001;489:14 –18. doi: 10.1016/s0014-5793(00)02428-5. [DOI] [PubMed] [Google Scholar]
- 20.Ruiz A, Kuehn MH, Andorf JL, Stone E, Hageman GS, Bok D. Investig Ophthalmol Vis Sci. 2001;42:31–37. [PubMed] [Google Scholar]
- 21.Thompson DA, Li Y, McHenry CL, Carlson TJ, Ding X, Sieving PA, Apfelstedt-Sylla E, Gal A. Nat Genet. 2001;28:123–124. doi: 10.1038/88828. [DOI] [PubMed] [Google Scholar]
- 22.Redmond TM, Yu S, Lee E, Bok D, Hamasaki D, Chen N, Goletz P, Ma JX, Crouch RK, Pfeifer K. Nat Genet. 1998;20:344 –351. doi: 10.1038/3813. [DOI] [PubMed] [Google Scholar]
- 23.Haeseleer F, Jang GF, Imanishi Y, Driessen CA, Matsumura M, Nelson PS, Palczewski K. J Biol Chem. 2002;277:45537–45546. doi: 10.1074/jbc.M208882200. [DOI] [PMC free article] [PubMed] [Google Scholar]
- 24.Adamus G, Zam ZS, Emerson SS, Hargrave PA. In Vitro Cell Dev Biol. 1989;25:1141–1146. doi: 10.1007/BF02621265. [DOI] [PubMed] [Google Scholar]
- 25.Van Hooser JP, Aleman TS, He YG, Cideciyan AV, Kuksa V, Pittler SJ, Stone EM, Jacobson SG, Palczewski K. Proc Natl Acad Sci U S A. 2000;97:8623–8628. doi: 10.1073/pnas.150236297. [DOI] [PMC free article] [PubMed] [Google Scholar]
- 26.Jang GF, Van Hooser JP, Kuksa V, McBee JK, He YG, Janssen JJ, Driessen CA, Palczewski K. J Biol Chem. 2001;276:32456 –32465. doi: 10.1074/jbc.M104949200. [DOI] [PMC free article] [PubMed] [Google Scholar]
- 27.Palczewski K, Van Hooser JP, Garwin GG, Chen J, Liou GI, Saari JC. Biochemistry. 1999;38:12012–12019. doi: 10.1021/bi990504d. [DOI] [PubMed] [Google Scholar]
- 28.Van Hooser JP, Liang Y, Maeda T, Kuksa V, Jang GF, He YG, Rieke F, Fong HK, Detwiler PB, Palczewski K. J Biol Chem. 2002;277:19173–19182. doi: 10.1074/jbc.M112384200. [DOI] [PMC free article] [PubMed] [Google Scholar]
- 29.Kuksa V, Bartl F, Maeda T, Jang GF, Ritter E, Heck M, Van Hooser JP, Liang Y, Filipek S, Gelb MH, Hofmann KP, Palczewski K. J Biol Chem. 2002;277:42315–42324. doi: 10.1074/jbc.M206014200. [DOI] [PMC free article] [PubMed] [Google Scholar]
- 30.McBee JK, Van Hooser JP, Jang GF, Palczewski K. J Biol Chem. 2001;276:48483–48493. doi: 10.1074/jbc.M105840200. [DOI] [PMC free article] [PubMed] [Google Scholar]
- 31.Perrault I, Rozet JM, Gerber S, Ghazi I, Leowski C, Ducroq D, Souied E, Dufier JL, Munnich A, Kaplan J. Mol Genet Metab. 1999;68:200 –208. doi: 10.1006/mgme.1999.2906. [DOI] [PubMed] [Google Scholar]
- 32.Niederreither K, Subbarayan V, Dolle P, Chambon P. Nat Genet. 1999;21:444 –448. doi: 10.1038/7788. [DOI] [PubMed] [Google Scholar]
- 33.Maeda T, Van Hooser JP, Driessen CA, Filipek S, Janssen JJ, Palczewski K. J Neurochem. 2003;85:944 –956. doi: 10.1046/j.1471-4159.2003.01741.x. [DOI] [PMC free article] [PubMed] [Google Scholar]
- 34.Saari JC, Garwin GG, Van Hooser JP, Palczewski K. Vision Res. 1998;38:1325–1333. doi: 10.1016/s0042-6989(97)00198-3. [DOI] [PubMed] [Google Scholar]
- 35.Driessen CA, Winkens HJ, Hoffmann K, Kuhlmann LD, Janssen BP, Van Vugt AH, Van Hooser JP, Wieringa BE, Deutman AF, Palczewski K, Ruether K, Janssen JJ. Mol Cell Biol. 2000;20:4275–4287. doi: 10.1128/mcb.20.12.4275-4287.2000. [DOI] [PMC free article] [PubMed] [Google Scholar]
- 36.Hetling JR, Pepperberg DR. J Physiol Lond. 1999;516:593–609. doi: 10.1111/j.1469-7793.1999.0593v.x. [DOI] [PMC free article] [PubMed] [Google Scholar]
- 37.Rattner A, Sun H, Nathans J. Annu Rev Genet. 1999;33:89 –131. doi: 10.1146/annurev.genet.33.1.89. [DOI] [PubMed] [Google Scholar]
- 38.Dawson MI. Curr Pharm Des. 2000;6:311–325. doi: 10.2174/1381612003401190. [DOI] [PubMed] [Google Scholar]
- 39.Gottesman ME, Quadro L, Blaner WS. Bioessays. 2001;23:409 –419. doi: 10.1002/bies.1059. [DOI] [PubMed] [Google Scholar]
- 40.Fortuna VA, Trugo LC, Borojevic R. J Nutr Biochem. 2001;12:610 –621. doi: 10.1016/s0955-2863(01)00179-6. [DOI] [PubMed] [Google Scholar]
- 41.Seeliger MW, Grimm C, Stahlberg F, Friedburg C, Jaissle G, Zrenner E, Guo H, Reme CE, Humphries P, Hofmann F, Biel M, Fariss RN, Redmond TM, Wenzel A. Nat Genet. 2001;29:70 –74. doi: 10.1038/ng712. [DOI] [PubMed] [Google Scholar]
- 42.Surya A, Foster KW, Knox BE. J Biol Chem. 1995;270:5024 –5031. doi: 10.1074/jbc.270.10.5024. [DOI] [PubMed] [Google Scholar]
- 43.Jager S, Palczewski K, Hofmann KP. Biochemistry. 1996;35:2901–2908. doi: 10.1021/bi9524068. [DOI] [PubMed] [Google Scholar]
- 44.Melia TJ, Jr, Cowan CW, Angleson JK, Wensel TG. Biophys J. 1997;73:3182–3191. doi: 10.1016/S0006-3495(97)78344-9. [DOI] [PMC free article] [PubMed] [Google Scholar]
- 45.Woodruff ML, Wang Z, Chung HY, Redmond TM, Fain GL, Lem J. Nat Genet. 2003;35:158 –164. doi: 10.1038/ng1246. [DOI] [PubMed] [Google Scholar]
- 46.Ablonczy Z, Crouch RK, Goletz PW, Redmond TM, Knapp DR, Ma JX, Rohrer B. J Biol Chem. 2002;277:40491–40498. doi: 10.1074/jbc.M205507200. [DOI] [PubMed] [Google Scholar]
- 47.Li ZY, Jacobson SG, Milam AH. Exp Eye Res. 1994;58:397–408. doi: 10.1006/exer.1994.1032. [DOI] [PubMed] [Google Scholar]
- 48.Naash MI, Hollyfield JG, al-Ubaidi MR, Baehr W. Proc Natl Acad Sci U S A. 1993;90:5499 –5503. doi: 10.1073/pnas.90.12.5499. [DOI] [PMC free article] [PubMed] [Google Scholar]
- 49.Ball SL, Powers PA, Shin HS, Morgans CW, Peachey NS, Gregg RG. Investig Ophthalmol Vis Sci. 2002;43:1595–1603. [PubMed] [Google Scholar]
- 50.Lucas RJ, Douglas RH, Foster RG. Nat Neurosci. 2001;4:621–626. doi: 10.1038/88443. [DOI] [PubMed] [Google Scholar]
- 51.Panda S, Provencio I, Tu DC, Pires SS, Rollag MD, Castrucci AM, Pletcher MT, Sato TK, Wiltshire T, Andahazy M, Kay SA, Van Gelder RN, Hogenesch JB. Science. 2003;301:525–527. doi: 10.1126/science.1086179. [DOI] [PubMed] [Google Scholar]
- 52.Provencio I, Jiang G, De Grip WJ, Hayes WP, Rollag MD. Proc Natl Acad Sci U S A. 1998;95:340 –345. doi: 10.1073/pnas.95.1.340. [DOI] [PMC free article] [PubMed] [Google Scholar]
- 53.Hattar S, Lucas RJ, Mrosovsky N, Thompson S, Douglas RH, Hankins MW, Lem J, Biel M, Hofmann F, Foster RG, Yau KW. Nature. 2003;424:75–81. doi: 10.1038/nature01761. [DOI] [PMC free article] [PubMed] [Google Scholar]
- 54.Thompson CL, Blaner WS, Van Gelder RN, Lai K, Quadro L, Colantuoni V, Gottesman ME, Sancar A. Proc Natl Acad Sci U S A. 2001;98:11708 –11713. doi: 10.1073/pnas.201301498. [DOI] [PMC free article] [PubMed] [Google Scholar]


