Abstract
Inhibition of sickle hemoglobin polymerization is a major target for therapeutic approaches in sickle cell anemia. Toward this goal, initial efforts at pharmacological elevation of fetal hemoglobin (HbF) has shown therapeutic efficacy. In order to identify well tolerated, novel agents that induce HbF in patients, we developed a high-throughput screening approach based on induction of γ-globin gene expression in erythroid cells. We measured γ-globin transcription in K562 cells transfected with either γ promoter elements fused with the locus control region (LCR) hypersensitivity site-2 and luciferase reporter gene (HS2γ) or a β-yeast artificial chromosome in which the luciferase reporter gene was recombined into the γ-globin coding sequences (γYAC). Corresponding pharmacological increases in HbF protein were confirmed in both K562 cells and in human primary erythroid progenitor cells. Approximately 186,000 defined chemicals and fungal extracts were evaluated for their ability to increase γ gene transcription in either HS2γ or γYAC models. Eleven distinct classes of compounds were identified, the majority of which were active within 24 - 48 hours. The short chain hydroxamate-containing class generally exhibited delayed maximal activity, which continued to increase transcription up to 120 hours. The cyclic tetrapeptide OSI-2040 and the hydroxamates were shown to have histone deacetylase inhibitory activity. In primary hematopoietic progenitor cell cultures, OSI-2040 increased HbF by 4.5 fold at a concentration of only 40 nM, comparable to the effects of hydroxyurea at 100 uM. This screening methodology successfully identifies active compounds for further mechanistic and preclinical evaluation as potential therapeutic agents for sickle cell anemia.
Keywords: sickle disease, γ-globin transcription, histone deacetylase, globin-switching
Abbreviations: HS: hypersensitivity site; YAC: yeast artificial chromosome; HbF: fetal hemoglobin; HbA: adult hemoglobin; HbS: sickle hemoglobin; HPFH: hereditary persistence of fetal hemoglobin; MEL: murine erythroleukemia; MTT: 3-[4,5 dimethylthiazol-2-yl-]-2,5 diphenyl tetrazolium bromide; HRP: horseradish peroxidase; DMSO: dimethyl sulfoxide; FCS: fetal calf serum; BSA: bovine serum albumin; PBS: phosphate buffered saline; αMEM: α—modified Eagles media; DTT: 1,4-dithiothreitol; PMSF: phenylmethylsulfonylfluoride; TMB: 3.3′, 5. 5′-tetramethylbenzidine; SCF: stem cell factor; GADD153: growth-arrest-and-DNA-damage 153; GST-Ya: glutathione S-transferase Ya; HMO: heme mono-oxygenase; HSP70: heat shock protein 70 HIF-1 RE hypoxia inducible factor 1 response elment; NF-AT RE: nuclear factor AT response element; NF-kB RE: nuclear factor kappa-B response element; XRE: xenobiotic element; DMEM: Dulbecco modified Eagle’s medium; ANOVA: analysis of variance; EC50: half maximal effective concentration; IC50: half maximal inhibitory concentration; PHA: proprionic hydroxamic acid; MMS: methane methyl sulfonate; AH: aryl hydrocarbon receptor; RT-PCR: reverse transcriptase - polymerase chain reaction; HDA: histone deacetylase; e.l.i.s.a.: enzyme-linked immunosorbent assay
INTRODUCTION
Through large-scale robotic screening we have sought to identify and characterize, at the molecular level, chemical compounds which increase expression of fetal γ-globin. Fetal hemoglobin augmenting agents are useful in the management of sickle cell anemia and β-thalassemias to compensate for defects in the β chain of adult hemoglobin. Sickle cell disease results from a change at codon 6 of the adult β-globin gene so that a glutamate is replace by a valine (HbA to HbS) and afflicts 1 in 400 Afro-Americans. The altered β-globin protein aggregates to produce an irreversible deformation of red blood cell morphology and a vaso-occulsive disease with severe morbidity [1]. β-thalassemias arise from a wide variety of genetic mutations which result in either the loss or reduced expression of the β-globin gene. Thalassemia major, also known as Cooley’s anemia, is characterized by marked anemia, severe hemolysis and ineffective erythropoiesis. Worldwide 240 million people are heterozygous for these hemoglobinopathies and these disorders are being actively selected for by vivax and falciparum malaria [2].
The human β-like globin genes (ɛ,γ,δ,β) and the sequence designated as the locus control region (LCR) are clustered on ~100kb of chromosome 11 (Figure 1). During embryonic and fetal development, globin genes are expressed in a temporal and tissue-specific fashion, which requires switches in both α- and β-like globin expression so that sequential appearance of embryonic (ζ2ɛ 2,2ɛ 2α and 2ζγ2), then fetal (α 2γ2) and then finally the adult forms (α2β2 and α2δ 2) of hemoglobin occur [3,4]. Developmental regulation of the β-globin gene cluster is mediated by several mechanisms. Sequences (enhancers and silencers) both within and immediately flanking the genes themselves confer tissue and temporal specificity [5–8]. A 20 kb region 5′ of the β-globin locus, termed the locus control region (LCR) is defined by five major DNase I hypersensitive sites (HS-I to HS-V) and has been shown to be critical for high level, tissue-specific globin gene expression[9–11]. The individual genes of the β-globin locus compete for physical association with the LCR, most likely through the interaction of transcription factors which bind the LCR and the individual globin promoters [12,13].
FIGURE 1.
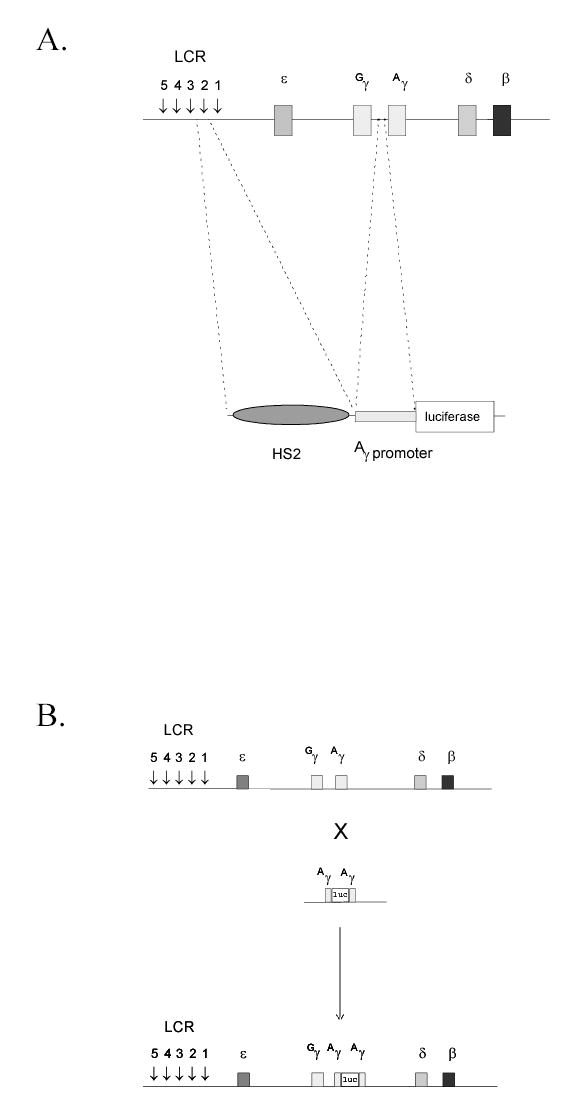
A. K562/HS2γ luciferase screening construct. LCR hypersensitive site 2 (HS2) was linked to the γ-globin proximal promoter and inserted 5′ to a luciferase reporter gene from P. pyralis. TK-neo was added and the resulting plasmid DNA was linearized and stably integrated in K562 cells by electroporation. B. K562/γYAC luciferase screening construct. A luciferase reporter gene was recombined into the Aγ-globin gene within a 540kb yeast artificial chromosome (YAC; Groveld et al., 1996). Recombination was performed such that the ATG of luciferase displaced the ATG of Aγ. The resulting luciferase’tagged’ γ-globin gene was stably integrated in K562 cells by spheroplast fusion.
In man, there is compelling evidence, genetic and pharmaceutical, that increasing expression of γ-globin has clinical benefit in both sickle cell anemia and β-thalassemia [14,15]. In normal individuals, between 1 and 3% of mature red blood cells express fetal γ-globin. In contrast, adults with an asymptomatic condition termed hereditary persistence of fetal hemoglobin (HPFH), exhibit high levels of fetal γ-globin. Based on such clinical studies, it has been calculated that an induction of γ-globin gene expression to approximately 10 - 20% (or a 3 – 5 fold increase from individual baseline) of the adult β-globin level will significantly ameliorate the symptoms of sickle cell disease [16]. While the cis-acting DNA elements required for γ-globin transcription and HPFH have been well defined [17–24], the identity of factor(s) which compete for these DNA elements and signaling pathways being modulated under physiological conditions of low and high HbF synthesis, remain unclear. Competition of linked γ and β genes appears to be mediated by multiple elements within the human γ globin promoter [17] and likely requires recruitment of repressor factors [25] which in turn recruit histone deacetylases.
Several pharmacological approaches seeking to up-regulate HbF have been developed. These include the DNA methyltransferase inhibitor 5′-aza-cytidine [26,27], the ribonucleotide reductase inhibitor hydroxyurea [28], short chain fatty acids such as butyric acid [29] and a number of other cytostatic agents. The effective concentration of these agents can be variable from individual to individual and these agents can show steep dose response profiles with relatively narrow margins of safety. As a result, we sought to identify new agents which augment HbF, to better define mechanisms by which pharmacological increases in HbF may be afforded and asked the question whether compound cytotoxicity was a requirement for induction of γ-globin transcription. Cell-based γ-globin transcription assays combined with high-throughput screening were used to evaluate >186,000 compounds and fungal extracts. Structurally distinct classes of compounds were identified which induce γ-globin transcription and HbF accumulation, through diverse mechanisms of action. The data support models where chromatin remodeling and/or delayed erythroid cell cycling can lead to increased HbF expression through both transcriptional and post-transcriptional mechanisms.
MATERIALS AND METHODS
Identification of γ-globin-inducing compounds and extracts
The HS2 enhancer element of the LCR and proximal promoter sequences from the γ-globin gene [30] were fused to the luciferase ‘reporter’ gene from H. pyralis [31]. The TK-neo gene, present in cis on the reporter plasmid, was used as the selectable marker for mammalian cell transfection. Human K562 cells, which display early erythroid and myeloid progenitor markers, were stably electroporated to express HS2γ-luciferase. Luciferase-‘tagged’ γ-globin YAC (γYAC) was constructed as previously described [32] where the luciferase gene was recombined into YAC DNA 3′ of the γA promoter within the context of the full β-globin locus. γYAC DNA was introduced into K562 cells and murine erythroleukemia (MEL) cells by protoplast fusion and cells selected for puromycin resistance. Individual clonal lines were evaluated by (i) basal luciferase expression; (ii) faithful integration of linear DNA as determined by Southern hybridization; and (iii) inducible regulation of the integrated reporter construct by hemin and 5-azacytidine (4 – 6 fold for HS2γ and >3 fold for γYAC). Expression levels from multiple K562 lines expressing HS2γ or γYAC genes were suitable for high throughput screening (HTS), while expression levels of γYAC in MEL-derived clones were insufficient.
Chemical compounds were synthesized as discrete compounds, dissolved in neat dimethyl sulfoxide (DMSO) and were screened on an individual basis at a concentration of ~12 uM. Fungal extracts were prepared by freeze drying the fermentation material, broth and mycelia together, followed by extraction with methanol. Extracts were dried and subjected to solvent fractionation to provide three crude fractions (water-methanol, chloroform and hexane) which were tested for biological activity at a 1:4 dilution of the starting culture volume (N/4). Active fractions were further purified by reverse-phase HPLC. Full characterization of select compounds was achieved using mass spectrometry and NMR techniques.
HS2γ/K562 and γYAC/K562 cells were plated at 10,000 cells per well in phenol red free RPMI-1640 media, 2% FCS (Hyclone), 20 mM l-glutamine, penicillin (100 units/ml), streptomycin (100 ug/ml), 20 mM HEPES, pH 7.4 in 96-well microtiter plates. Cells were induced with compound (~12 uM) or fungal extract (N/4) for a period of 24 hours. The final compound solvent concentration was 0.2% DMSO, which was used as the negative control. The positive control was 1 uM azacytidine. Upon completion of induction period, luciferase buffer was added to each well to achieve a final concentration of 100 mM Tris-acetate, pH 7.9, 20 mM magnesium acetate, 2 mM EGTA, 1% Brij 58, 100 mM 2-mercaptoethanol, 36 mM ATP, 150 uM luciferin. Cells were allowed to lyse for 5 min at room temperature after which the chemiluminescent signal was measured (Dynatech Lab ML1000- medium gain setting). A preliminary screen of approximately 5,000 compounds was performed, incorporating internal controls on each microtiter plate. These studies defined criteria to accept or reject high-throughput screen data, requiring that: 1) penicillic acid or 5-azacytidine induced HS2γ reporter gene expression >4 fold or γYAC expression >2 fold; 2) that the baseline signal was >0.05 luminometer units and; 3) that the coefficient of variation of controls on each microtiter plate was <20%.
Cytotoxicity assays
MTT- (3-[4,5 Dimethylthiazol-2-yl-]-2,5 diphenyl tetrazolium bromide), a commonly used colorimetric substrate, was used to measure mitochondrial respiration in order to assess cell viability. Cells were plated as described for the luciferase reporter gene assays. After incubation with test compounds for 24 and 48 hrs, 20 ul of 3 mg/ml MTT was added and cells incubated for 2 hours at 37 °C, 5% CO2. One hundred microliters of 10% SDS was added to all wells for 4 hours at 37 °C to allow for lysis and solubilization of MTT. Mitochondrial conversion of MTT was assessed by measurement of light absorbance at 540 nM. Background (from the phosphate buffered saline control) was subtracted and the data expressed as % inhibition of cell growth.
HbF e.l.i.s.a.. of K562 hypotonic lysates
K562 cells were exposed in duplicate to compound for a period of 4 days. Cells were collected by centrifugation (1000 x g; 5 minutes), media aspirated, cells washed with phosphate buffered saline (PBS) and the cell pellet lyzed in ice cold H2O by vortexing for ~40s. Nuclei were removed by centrifugation (13,000 x g; 4 °C for 4 minutes). Cleared lysate was removed, protein concentration determined and extracts stored at − 70 °C. Horseradish peroxidase (HRP) conjugated monoclonal antibody to HbF (Isolabs/Wallace) was used for e.l.i.s.a. determination of HbF concentration. Anti HbF is approximately 100 times more reactive to HbF than HbA. Standard curves were generated using HbF standard (~10% HbF, 90% HbA) serially diluted 1:2 in 25 ug/ml BSA from 1 ug/ml HbF to 0.015 ug/ml HbF. 25 ug/ml BSA served as the assay background control. Hypotonic lysates were diluted 25 ug/ml. Protein samples were added in triplicate to Immulon-4 microtiter plates for colorimetric detection or Microlite II microtiter plates for chemiluminescent detection (Dynex Technologies), using an excess of 0.1M Na2HCO3 , pH 9.0 at room temperature for 2 hours. Plates were washed 4 times with 50 mM Tris pH 8.0, 150 mM NaCl and 0.05% Tween-20 (TST). Anti-HbF was diluted 1:1000– 1:2000 in TST containing 1 % BSA (Fraction V) and 100 ul was added to each well, incubated for 2 hrs at room temperature, washed 4 times with TST and HRP substrate added. For colorimetric detection, 100 ul of TMB substrate (Kirkegaard & Perry Laboratories) was added and incubated for 30 minutes, quenched by the addition of 20ul 4N H2SO4 and read at 450nm/630nm. For chemiluminescent detection 100 ul of complete LBA (Pierce Chemical Co.) was added per well and measured 2 hrs post substrate addition. Correlation coefficients of standard curves were 0.95 – 1.0 and not accepted if below 0.9.
Human primary blood progenitor culture
A two phase liquid culture system was used [33] with modification. Human blood partially enriched for mononuclear cells (buffy coat) was diluted 1:1 with sterile PBS layed over 1.077 g/ml Ficoll (Invitrogen Corporation) and centrifuged at ~300 x g. Mononuclear cells at the Ficoll-aqueous interface were removed, diluted with PBS, collected by centrifugation (300 x g) and washed twice with PBS. Mononuclear cells containing erythroid progenitors from 2 units of blood were cultured in 80 mls ‘Phase I’ medium comprising: α modified Eagles media (αMEM; Invitrogen Corporation), 10% FCS (Stem Cell Technologies), 20 mM l-glutamine, penicillin (100 units/ml), streptomycin (100 ug/ml), human cytokines (R&D Systems Inc.) 10 ng/ml IL-3, 10 ng/ml IL-6, 10 ng/ml granulocyte colony stimulating factor (G-CSF), 10 ng/ml granulocyte-macrophage colony stimulating factor (GM-CSF), 20 ng/ml stem cell factor (SCF) and 1 ug/ml cyclosporin A (Cayman Chemical Corp.). Phase I culture was expanded for 5 – 7 days, collected by centrifugation, washed twice in αMEM and transferred to ‘Phase II’ medium comprising: αMEM, 10 – 30% FCS, 20 mM l-glutamine, penicillin (100 units/ml), streptomycin (100 ug/ml), 1U/ml erythropoietin (EPO), 10 ng/ml SCF, 1 uM dexamethasone, 10 uM β-mercaptoethanol. The effect of compound on HbF in primary cultures was assessed by exposing cells plated in Phase II media at 3 x 10⁶ cells/ml, 5% CO2, 37degC, in a humidied incubator, to a range of compound concentrations for 4 days (corresponding to days 4 to 8 in Phase II).
K562 extract preparation and protein blotting
To measure histone acetylation, K562 cells (1 x 10⁷ cells) were exposed to compounds for 24 hours. Cells were pelleted by centrifugation (500 x g, 5′), washed once with PBS followed by resuspension in 10 mM HEPES pH 7.9, 1.5 mM MgCl2, 10 mM KCl, 0.5 mM DTT and 1.5 mM PMSF. HCl was added to 0.2 M for 30’ at 4degC. The extract was subjected to centrifugation at 11,000 x g, for 10’ at 4degC. The supernatant fraction was dialyzed against 0.1M acetic acid (once for 1 hour), followed by dialysis against water (three times). Cell extracts were subjected to SDS-PAGE, transferred to nitrocellulose membrane and incubated with anti-acetyl histone antibody (Upstate Biotechnology) for 2 hours at room temperature. Primary antibody incubation was followed by incubation with the appropriate HRP-conjugated secondary antibody for 1 hour at room temperature and chemiluminescent detection (ECL; Amersham Bioscience).
Stress gene profiling
HepG2 cells were stably transfected with individual reporter gene constructs employing the luciferase gene under the control of the stress-responsive promoters for jun, growth-arrest-and-DNA-damage 153 (GADD153), glutathione S-transferase Ya (GST Ya), heme mono-oxygenase (HMO), heat shock protein 70 (HSP70) or the hypoxia inducible factor 1 (HIF-1 RE), nuclear factor AT (NF-AT RE), nuclear factor kappa-B (NF-kB RE) or xenobiotic (XRE) response elements. Stably transfected clonal cell lines were isolated and selected for appropriate response to 2 or more known modulators of the particular promoter element. Assay conditions for each cell line were optimized for exposure time, serum concentration and cell number.
Cells were plated onto white 96-well microtiter plates precoated with collagen at either 10,000 (GADD153, HIF-1 RE) or 20,000 cells / well (JUN, GST Ya, HSP70, HMO, NF-AT RE, NF-kB RE, XRE) in 150 ml DMEM medium supplemented with L-glutamine, non-essential amino acids and either 1 % (GADD153, GST Ya, HIF1RE, HMO, NF-ATRE, NF-kBRE, XRE) or 10 % (JUN, HSP70) fetal calf serum. After 24 hr incubation (37 °C, 5% CO2) the cells were transferred to a fully robotic liquid and plate handling station where compounds were added in triplicate at 6 concentrations in a 5-fold dilution range. The plates were further incubated for either 6 hr (HMO), 8 hr (JUN, GADD153, GST Ya, NF-AT RE, NF-κB RE) 16 hr (HSP70, XRE) or 24 hr (GST Ya, assayed at two different time points) and luciferase assays performed.
RESULTS
Identification of compounds which increase γ-globin transcription in K562 and primary progenitor cells
Our initial goal was to identify novel agents which induce γ-globin transcription through random high-throughput screening of >186,000 entities and to categorize their mechanisms of action. Two assay approaches were used: 1) a fusion of the LCR hypersensitivity site 2 enhancer with the γ proximal promoter (HS2γ) 5′ to a luciferase reporter gene (Figure 1A); and 2) a βYAC-based approach in which the luciferase reporter gene was integrated by homologous recombination 3′ of the γ-globin promoter within the context of the full β-globin locus (Figure 1B; ref. 32). Extracts and compounds were evaluated and selected according the scheme shown in Figure 2, where inductions of >4 fold for HS2γ and of >2 fold for γYAC were required for further investigation of the test agent. Approximately 96,000 extracts from fungal, marine, seed and herbal libraries and 48,400 compounds from chemical libraries were screened in the γYAC/K562 assay and approximately 23,000 extracts and 31,000 compounds were screened in the HS2γ/K562 assay. Extracts or compounds which increased γ-globin reporter activity greater than four fold in K562/HS2γ cells or two fold in K562/γYAC cells, as compared with vehicle control (0.2% DMSO), were selected for further evaluation. The frequency distribution of the fold transcription increases resulting incubation with chemical compound or fungal extracts are shown in Figure 3. The y-axis records fold induction relative to control. Compounds or extracts are distributed along the x-axis, which has no units. Most extracts and compounds had little or no effect on γ-globin gene expression and showed a normal distribution centering on 1.0, or no fold induction. The scales between panels differ due to the increased sensitivity of HS2γ over γYAC and the often larger fold inductions observed with fungal extract mixtures relative to single chemical compounds. The enhanced activity of fungal extracts is most likely due to the sensitivity of the assay to specific classes of cytotoxic compounds and to the multiplex nature of whole fungal extracts (data not shown). The frequencies of identifying positively scoring compounds and natural product extracts in the automated screening approach were 1% and 2.5% respectively.
FIGURE 2.
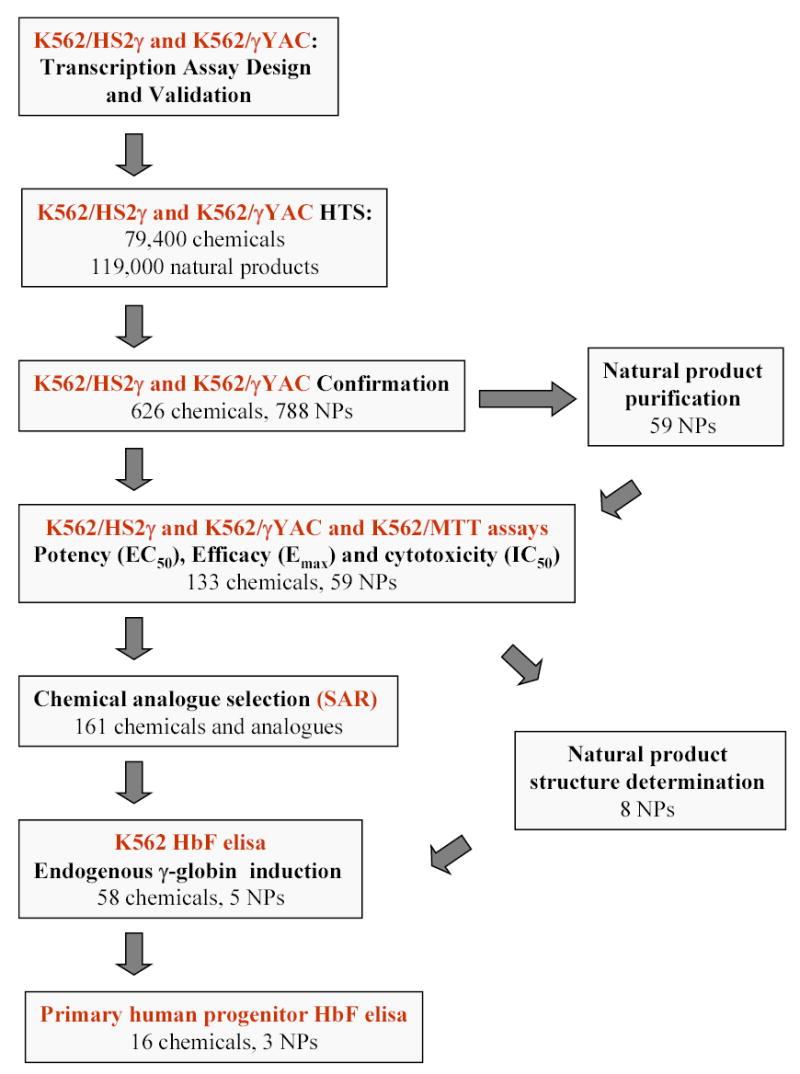
Flow schematic illustrating natural product extract and chemical compound progression pathways.
FIGURE 3.
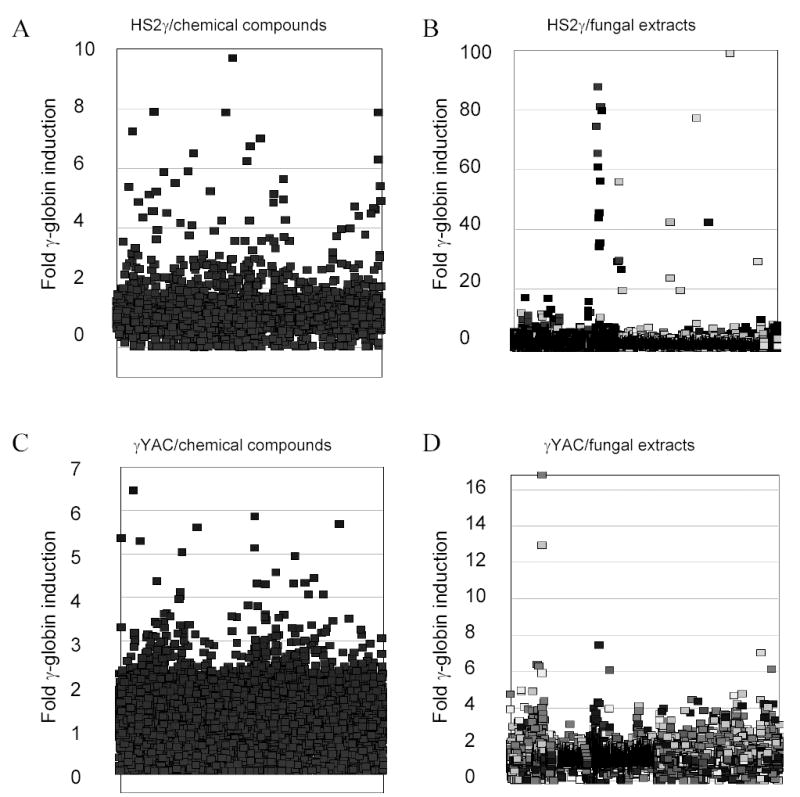
Frequency distribution of fold transcription increases resulting incubation with chemical compound or fungal extracts. The y-axis records fold induction relative to vehicle control (0.2% DMSO). Compounds/extracts are distributed along the x-axis, which has no units. A) HS2γ cells exposed to compounds (scale 0 – 10); B) HS2γ cells exposed to fungal extracts (scale 0 – 100); C) γYAC cells exposed to compounds (scale 0 – 7); and D) γYAC cells exposed to fungal extracts (scale 0 – 17). Fold induction of 1 indicates no effect, while inductions <1 indicate cytotoxicity and/or repression. Clusters reflect related compounds in close proximity within the chemical and fungal extract libraries. Shading in panels B and D reflect different fungal growth conditions.
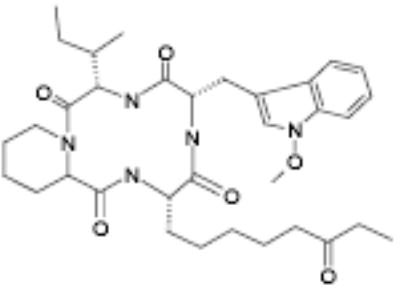
Active fungal culture extracts were prioritized on the basis of efficacy, potency and cytotoxicity at 24 and 48 hour time points. Extracts were dereplicated on the basis of HPLC retention time to eliminate previously identified activities. From the 59 purified fungal metabolites, five potent and efficacious activities were characterized (not shown). These comprised a furanone (5-[1,2-dimethyl-propenyl]-5hydroxy-4methoxy-5H-furan-2-one), an isoflavone (7-hydroxy-3-[4-hydroxy-phenyl]-chromen-4-one), a substituted phenol (1-[2,4,6-trimethoxy-phenyl]-but-2-en-1-one), a dihydropyranone (acetic acid 2-[8-methyl-9-oxa-bicyclo[4.2.1]nona-2,4-dien-7yl]-6oxo-3,6dihydro-2H-pyran-3-yl-ester) and a cyclic tetrapeptide (OSI-2040; cyclo-[N-O-methyl-L-Trp-L-Ile-D-Pip-L-2-amino-8-oxo-decanoyl]). Of the fungal metabolites, only OSI-2040 showed sufficient efficacy, potency and differential cytotoxicity to warrant further study. OSI-2040, a cyclic tetrapeptide, was isolated from Fusaria extracts and likely is to be produced from tryptophan, isoleucine, a pipecolic acid and an amino decane derivative. Three of the four residues are uncommon amino acids and active variants of OSI-2040 in which the nitrogen methoxy group is substituted with hydrogen also have been isolated. OSI-2040 refers to either methoxy or hydrogen substituted entity, which display indistinguishable bioactivity. OSI-2040 was shown to increase both γ-globin transcription [34] and fetal hemoglobin (HbF) accumulation using three distinct assays: the HbF e.l.i.s.a. (Table 1), hemoglobin staining assays (benzidine colorimetric and LBA chemiluminescent assays; data not shown) and a hemoglobin cation-exchange HPLC assay (data not shown).
TABLE 1.
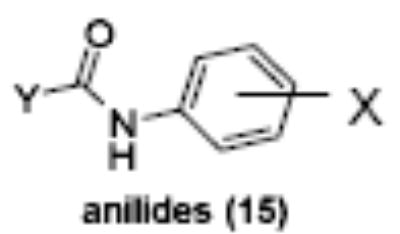
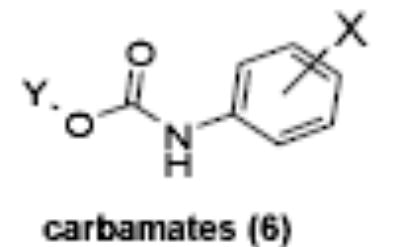
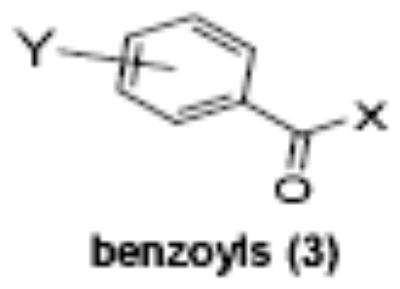
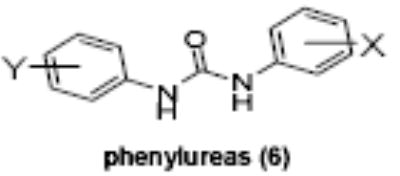
Compound classes and activity in K562 γYAC transcription assays, K562 cytotoxicity assay (MTT) K562 HbF e.l.i.s.a. and human primary progenitor HbF e.l.i.s.a.
| Side chains | Transcription (24hr) | Cytotoxicity (48hr) | Maximum HbF increase (4 day) | ||||
|---|---|---|---|---|---|---|---|
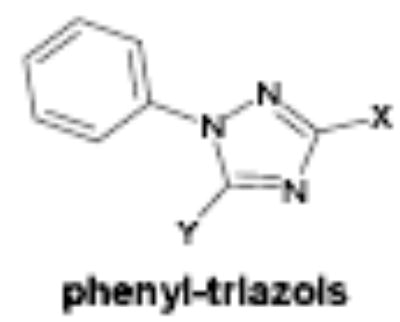
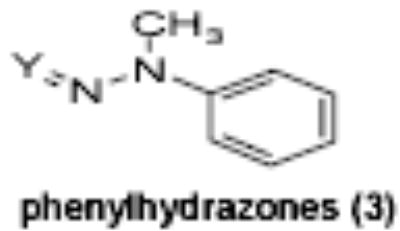
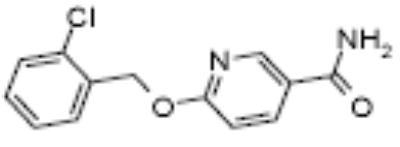
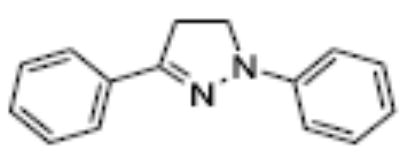
| Compound ID/ Structural Class | Y | X | EC50 (uM) | Maximum Induction | IC50 (uM) | K562 cells | Human progenitor cells |
OSI-2040 |
0.15 | 4.3 | 0.5 | 5.4 (0.1uM) | 4.5 (0.04uM) | ||
|
|||||||
| OSI-168961 | 1-hydroxy 2-napthyl | 2-chloro-4-nitro | 0.1 | 3.2 | >50 | 2.8 (2uM) | 2.4 (0.8uM) |
| OSI-168996 | 1-hydroxy 4-chloro 2-napthyl | 4-cyano | 1 | 3.8 | 30 | 3.8 (0.7uM) | 2.4 (0.8uM) |
| OSI-97345 | 3-methylbenzo[b] thiophene | 4-methyl | 5.0 | 3.6 | >50 | 2 (15uM) | 4.1 (4uM) |
|
|||||||
| OSI-168992 | cyclohexyl | 2-nitro | 1.0 | 2.0 | >20 | 3.1 (20uM) | 2.6 (0.8uM) |
|
|||||||
| OSI-169055 | <> | 1-benzyl-1H- pyrrolo(1,2- A)imidazol-5-yl)- | <0.1 | 2.2 | >50 | 2.1 (20uM) | nd |
|
|||||||
| OSI-101820 | 4-bromo | 3-nitro | 8.0 | 3.3 | >50 | 2.1 (13uM) | 4.7 (4uM) |
|
|||||||
| OSI-169170 | hydroxy | 4-methoxyphenyl | 8.0 | 5.8 | >50 | 3.2 (2uM) | 7.2 (20uM) |

|
|||||||
| OSI-22121 | 2,3 propylene | <> | 3.5 | 2.6 | 30 | 5.4 (25uM) | 2.1 (0.8uM) |
|
|||||||
| OSI-169040 | 3(2-keto indolyl) | <> | 9.0 | 2.9 | >50 | 2 (20uM) | nd |
|
|||||||
| OSI-102695 | <> | <> | 0.9 | 2.5 | >20 | 1.7 (20uM) | 3.5 (4uM) |
|
|||||||
| OSI-169050 | <> | <> | 0.4 | 3.0 | >50 | 2.3 (6 uM) | 1.5 (20uM) |
| aza-cytidine | 0.6 | 2.5 | 1 | 3.1 (1uM) | 10 (1uM) | ||
| hydroxyurea | na | 1.2 | nd | 2.8 (200uM) | 5.9 (100uM) | ||
Of the chemical compounds, 62 were selected based on potency, efficacy and relative lack of cytotoxicity. Of these, 35 were aniline derivatives. More than twenty of the anilines are condensed as either amides, ureas, or carboxamides. Activity profiles of selected compounds from each of the chemical classes are shown in Table 1. The anilides OSI-168961, the amide OSI-102695 and the benzoyl OSI-169055 showed maximal transcriptional inductions of 3.2, 2.5 and 2.2 fold respectively, potencies in the nM EC50 range with cytotoxicity apparent at >20 uM. The carbamate OSI-168992, and anilides OSI-97345 and OSI-168996, the phenylurea OSI-101820, the phenyltriazol OSI-169170, the amino-triazine OSI-22121 and the phenylhydrazone OSI-169040 exhibited maximal inductions ranging from 2 to 5.8 fold with low uM potencies. In these assays OSI-2040 showed a 4.3 fold stimulation of γYAC reporter activity after twenty four hours exposure with an EC50 of ~150nM and cytotoxicity, following forty eight hours exposure in K562 cells in vitro, was apparent at concentrations >500nM. In comparison, aza-cytidine showed transcriptional activity (γYAC) of 2.5 fold at 600nM with cytotoxicity apparent at ~1 uM. The reference compounds sodium butyrate and hydroxyurea showed little or no induction (<2 fold) of reporter expression after 24 hours exposure, but did increase reporter expression and HbF accumulation after longer incubation periods. For example both hydroxyurea (100 uM) and sodium butyrate (1 mM) increased K562/HS2γ expression by 10 fold after 96 hours exposure, while in the same experiment OSI-2040 (0.3 uM) showed a 47 fold increase. The assays for globin protein, the HbF elisa and the benzidine staining assay, generally were less sensitive. In K562 cells exposed to compounds for 72 hours benzidine staining (measuring total globin protein) increased 8 fold for OSI-2040 (4.8 uM), 2.5 fold for hydroxyurea (200 uM), 3 fold for hydroxyurea (500 uM), ~1.5 fold for sodium butyrate (1 mM) and 2.2 fold for sodium butyrate (5 mM). In the HbF elisa measurements in K562 cell exposed to compound for 96 hours, hydroxyurea (200 uM), azacytidine (1 uM) and OSI-2040 (100 nM) increased HbF 2.8 fold, 3.1 fold and 5.4 fold respectively, as shown in Table 1. Sodium butyrate was not tested in the HbF elisa. These finding were generally true of many compounds where, at non-cytotoxic concentrations, EC50 values for potency increased with increased cell exposure time.
The selected compounds showed γ-globin-inducing activity in both K562 and primary human progenitor cells in vitro. Primary peripheral hematopoietic progenitor cells were cultured [33] under conditions resulting in the expansion and differentiation of erythroid cells and the induction of γ-globin (approximately days 2 - 4) and β-globin (approximately days 4 –8). To minimize donor to donor variation progenitor cells from 2 –3 donors were pooled in Phase II culture (day 4) and HbF concentration measured by e.l.i.s.a.. A relatively short incubation period of 96 hours was used to minimize potential in vitro. Seven independent experiments were performed using duplicate cultures for each compound and with three e.l.i.s.a. determinations for each data point. A 3-way ANOVA analysis of the data was performed (compound vs concentration vs experiment; Table 1). Compound potencies generally were in the low uM EC50 range, with HbF increases of 2 to 7.2 fold over concentrations from 0.8 uM to 20 uM observed. The exception was OSI-2040 which showed significant (p<0.05) γ-globin-inducing activity of 5.4 and 4.5 fold in K562 and human progenitor cells respectively, at low nM concentration (100nM for K562 cells and 40nM for human progenitor cells). In comparison, azacytidine at 1 uM showed inductions of 3.1 and 10 fold in K562 and human progenitor cells respectively. Hydroxyurea showed γ-globin -inducing activity of 2.8 and 5.9 fold in K562 and human progenitor cells, though with low potency (>100 uM).
Directed screening for inducers of γ-globin transcription
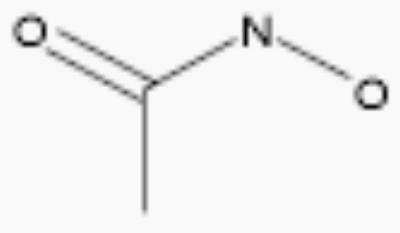
In initial validation studies, approximately 80 compounds with known activities in cellular signaling were evaluated in the K562/γYAC assay. The compounds acetohydroxamic acid (urease inhibitor), genistein and quercetin (tyrosine kinase inhibitor), 12-phorbol 13-myristate (protein kinase C activator), ionomycin and A23187 (calcium influx), N-acetyl cysteine (anti-oxidant), phenamil (sodium channel blocker) and olomucine (cyclin-dependent kinase inhibitor) induced γ-globin promoter-reporter activity by > 2 fold. Few of these compounds had sufficient potency (<10 uM) or tractable chemical structures for further evaluation. However analogs of acetohydroxamic acid were further investigated.
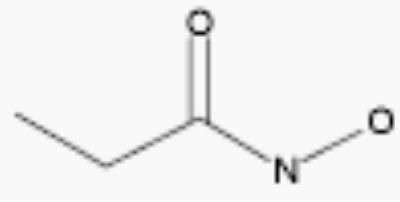
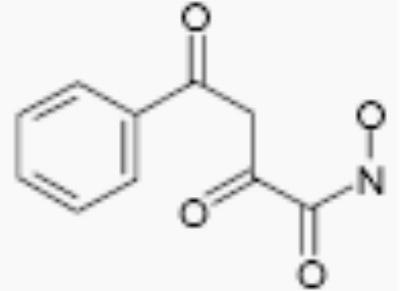
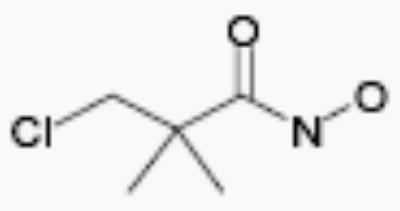
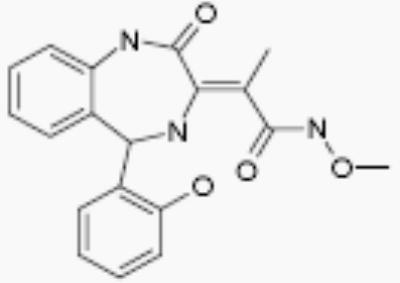
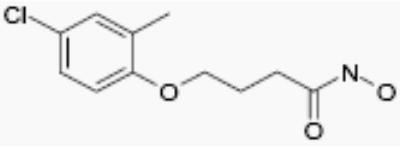
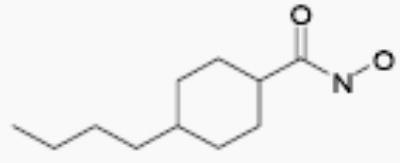
Proprionic hydroxamic acid (PHA) increased reporter activity in K562/HS2γ at concentrations >4 uM, with maximal activity observed at ~70 uM as shown in Figure 4. Figure 4 shows log concentration in uM on the x-axis and fold increase in γ expression on the y-axis. Increases in γ transcription were time dependent, ranging from 2.6 fold at 48 hours to 6.7 fold at 120 hours of exposure to 100 uM PHA. Reducing PHA concentration to 20 uM diminished γ transcription to 2.1 fold to 3.3 fold at 48 and 120 hours exposure respectively. Six hydroxamic acid analogs were compared in order to assess possible structure activity relationships. All analogs, with the exception of compound 15260, were found to increase HS2γ expression (Table 2). R-02210 showed markedly greater induction at early time points than PHA, NS43789 or R-44534, despite showing similar maximal inductions of ~5 to 7 fold at or around 100 uM compound concentration. Both R-02761 and NS41080 were more potent, with maximal activity observed at ~20 uM. However NS41080 showed less time dependence to HS2γ induction and showed a more pronounced leftward tail in the dose response curves, suggestive of a greater window between the efficacious and cytotoxic compound concentrations.
FIGURE 4.
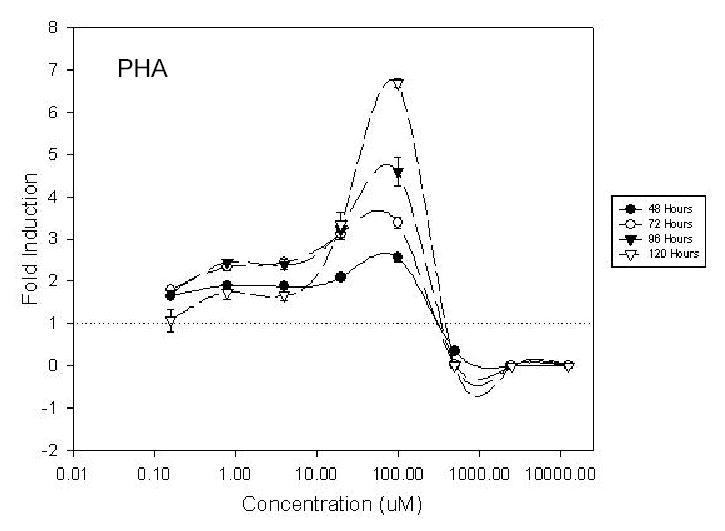
Dose response activity profile of K562/HS2γ cells exposed to proprionic hydroxamic acid (PHA) for 48, 72, 96 or 120 hours. Log concentration is indicated on the x-axis. Fold γ-globin transcriptional increase is shown on the y-axis.
TABLE 2.
Activity of hydroxamate containing analogues in stimulating γ-globin transcription after 96 hours exposure in K562/HS2γ cells.
| Compound | Structure | EC50 (uM) | Maximal Fold Induction |
|---|---|---|---|
| acetohydroxamic acid |
|
250 | 2.6 |
| propionohydroxamic acid |
|
30 | 4.7 |
| R-02210 |
|
50 | 5.5 |
| R-02761 |

|
4 | 3 |
| R-44534 |
|
50 | 4.1 |
| 15260 |
|
- | no effect |
| NS41080 |
|
5 | 4 |
| NS43789 |
|
40 | 4 |
Histone deacetylase inhibition and activation of cellular stress pathways
Short chain fatty acids such as butyrate have been shown to induce γ-globin transcription and exhibit histone deacetylase inhibitory activity at relatively high concentrations [35]. The potential for the γ-globin-inducing compounds to inhibit histone deacetylase activity in K562 cells was examined. Using anti-acetyl-histone antibody, increased acetylated histone was clearly observed in cells exposed to OSI-2040 for 18 hours, but was not detected in K562 cells treated with other γ-globin-inducing compounds (Figure 5A). In separate experiments, proprionic hydroxamic acid also was shown to have histone deacetylase inhibitory activity in K562 cells (Figure 5B). The OSI-2040 concentration used was 1 uM, which provides maximal γ-globin inducing activity yet was below the 24 hour cytotoxic IC50.
FIGURE 5.
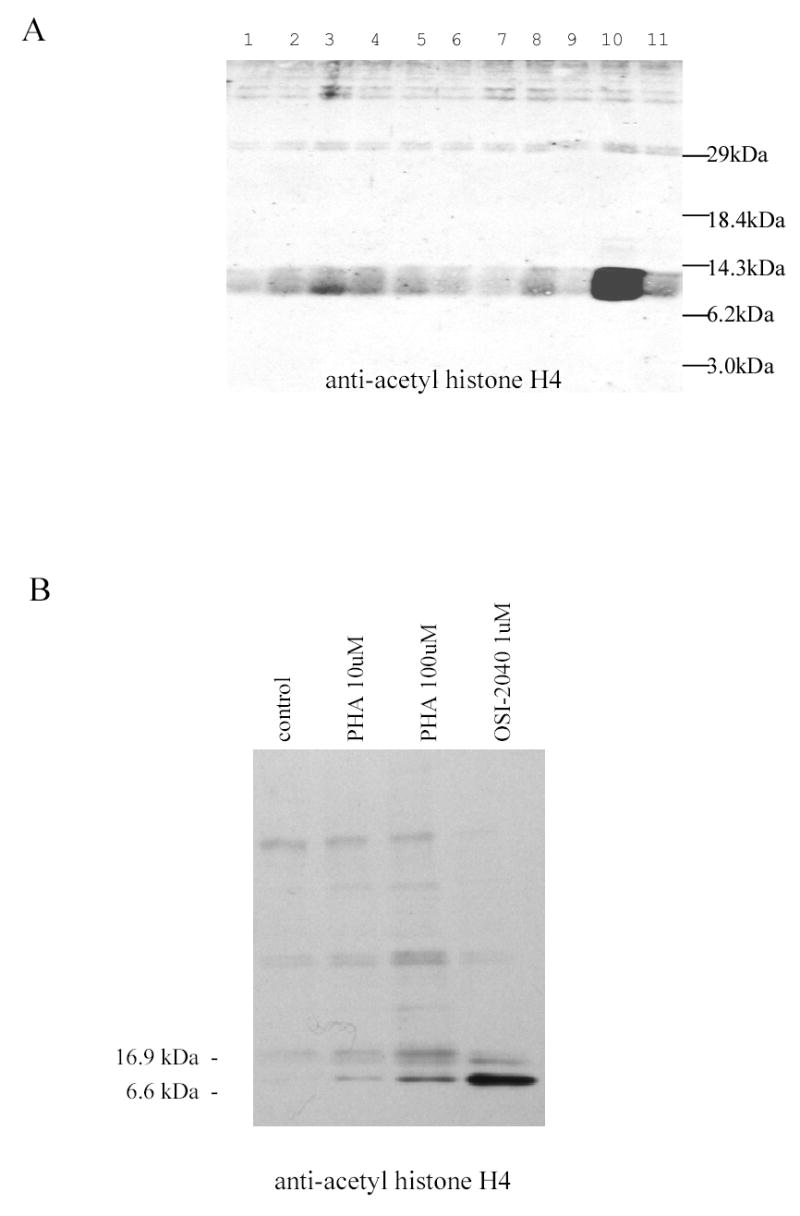
A. OSI-2040 treatment increases histone H4 acetylation in K562 cells. K562 cells were treated for 24 hours with maximally acting concentration of OSI-97345 (lane 1), OSI-102695 (lane 2), OSI-22121 (lane 3), OSI-101820 (lane 4), OSI-168992 (lane 5), OSI-168996 (lane 6), OSI-168961 (lane 7), OSI-169050 (lane 8), OSI-169170 (lane 9), OSI-2040 (lane 10) or 0.2% DMSO (lane 11). Extracts were subjected to SDS-PAGE, transferred to nitrocellulose and probed with anti-acetyl histone H4 antibody (Upstate Biotechnology, VA). Acetyl-histone H4 (11 kDa) was observed extracts from OSI-2040 treated cells, but not in extracts from cells exposed to 0.2% DMSO or compounds OSI-97345 – OSI-169170. Weak reactivity of the antibody to acetylated-histone H2B (14 kDa) may contribute to band broadening. B. Proprionic hydroxamic acid stimulates histone H4 acetylation in K562 cells. K562 cells were treated for 24 hours with 0.2% DMSO vehicle (lane 1), 10 uM proprionic hydroxamic acid (lane 2), 100 uM proprionic hydroxamic acid (lane 3), 1 uM OSI-2040 (lane 4) histones extracted and probed with anti-Ac histone antibody as described for Figure 5A. The OSI-2040 concentration of 1 uM provides maximal γ-globin inducing activity yet was below the 24 hour cytotoxic IC50.
Many of the γ-globin inducing compounds initially identified showed cytotoxicity, as measured by a reduction in MTT conversion and by a sharp decline in reporter signal, at concentrations at or somewhat above those required for maximal induction of transcription. To investigate whether stress-responsive pathways form an obligate mechanism in γ-globin induction, the active compounds OSI-97345, OSI-102695, OSI-101820, OSI-168996, OSI-168961, OSI-169050, OSI-169170, OSI-2040 and 5-azacytidine were investigated for their ability to induce the stress responsive promoters or response elements from c-jun (early-immediate stress response), GADD153 (growth arrest and DNA damage), GST Ya (phase II metabolic enzyme), HIF1RE (hypoxia response element), HSP70 (heat shock and protein damage), heme oxygenase (oxidative stress), NFκB-RE (oxidative stress, DNA damage), NF-AT (calcium signaling) and XRE (aryl hydrocarbon receptor activation). A panel of 9 stably transfected HepG2 cells containing luciferase reporter genes linked to individual promoters and response elements were exposed to each of the compounds along with an appropriate positive control for each marker, in triplicate at 6 doses (5-fold serial dilutions) as described in Materials and Methods.
Table 3 indicates stress markers which were significantly induced by each compound (> 2-fold induction p = 0.05), the magnitude of the greatest observed induction (in fold-induction and as a percentage of the maximum observed effect), the dose at which the highest induction was observed and the p value obtained from a t-test of the triplicate dose points compared to the 12 negative controls in each case. Only treatments resulting in at least a 2-fold (p < 0.05) increase in luciferase expression are shown. Shown is the concentration of compound at which maximum induction of stress response was seen, fold increase in luciferase activity, % of maximum observed increase and p value (t-test). Notably, all of the compounds, with the exception of OSI-169170, induced transcription of the XRE reporter construct, suggesting that these compounds are able to bind and activate the aryl hydrocarbon receptor. OSI-97345 was the most powerful inducer of XRE, causing a 5-fold increase in luciferase expression at a dose of 16.7 uM. OSI-2040 was the most potent inducer of XRE, giving a 4-fold increase at 0.12 uM. Four of the compounds, OSI-2040, OSI-97345, OSI-102695 and OSI-169170 induced expression from the HSP70 promoter. Increased expression of HSP70 would suggest that exposure of cells to these compounds results in damage to proteins or a disruption of protein synthesis or folding [36]. Induction of HSP70 driven luciferase expression by OSI-97345, OSI-102695 and OSI-169170 was fairly weak (~2.5-fold) but OSI-2040 induced a 6.8-fold increase in expression, comparable to that observed with the alkylating agent methane methyl sulfonate (MMS). OSI-2040 also induced the GADD153 reporter construct which may indicate a genotoxic potential [37], as well as the jun and NFκB-RE constructs. The level of induction of GADD153 by OSI-2040 was small (2.1-fold) compared to that observed with MMS (15.2-fold) and the effect of OSI-2040 on the jun and NF-kBRE constructs was also small. OSI-169050 and OSI-169170 also weakly induced the GADD153 reporter construct (2.3 and 2.1-fold respectively). Neither OSI-169050 nor OSI-169170 significantly induced jun or NF-κBRE, although both did induce the GST Ya construct, as did OSI-97345 and OSI-102695. Expression of GST Ya is induced in response to a variety of electrophilic compounds and phenolic antioxidants [38].
TABLE 3.
Maximum fold inductions of 9 stress response reporter constructs by γ-globin transcription inducing and control compounds.
| Compound | [Compound] μ M | Markers Induced >2 Fold (p ≤ 0.05) | Fold Induction | % Max | p |
|---|---|---|---|---|---|
| Control Compounds | |||||
| 3-Methyl Cholanthrene | 20 | GST Ya (8 hr) | 2.7 | 20 | 0.007 |
| 20 | GST Ya (24 hr) | 5.0 | 100 | 0.004 | |
| 7 | HIF1RE | 3.7 | 100 | 0.006 | |
| 20 | XRE | 5.5 | 48 | 0.001 | |
| Calcium ionophore (A23187) | 2 | HSP70 | 3.3 | 8 | 0.020 |
| 20 | NF-AT | 11.4 | 100 | 0.001 | |
| Methane methyl sulfonate (MMS) | 1000 | CJUN | 10.1 | 100 | 0.000 |
| 1000 | GADD153 | 15.2 | 58 | 0.000 | |
| 333 | GST Ya (8 hr) | 4.7 | 40 | 0.012 | |
| 333 | HSP70 | 5.9 | 24 | 0.036 | |
| 333 | XRE | 2.1 | 12 | 0.004 | |
| 12-phorbol 13-myristate (PMA) | 0.7 | CJUN | 8.1 | 78 | 0.000 |
| 0.2 | GADD153 | 25.5 | 100 | 0.001 | |
| 0.7 | GST Ya (8 hr) | 10.2 | 100 | 0.001 | |
| 0.2 | HMO | 19.8 | 100 | 0.001 | |
| 0.2 | HSP70 | 21.7 | 100 | 0.004 | |
| 0.7 | NF-κ BRE | 1030.0 | 100 | 0.004 | |
| 2 | NF-AT | 8.6 | 60 | 0.029 | |
| 0.7 | XRE | 10.2 | 98 | 0.019 | |
| Test Compounds | |||||
| OSI-97345 | 17 | GST Ya (8 hr) | 2.5 | 16 | 0.005 |
| 17 | GST Ya (24 hr) | 2.8 | 38 | 0.010 | |
| 6 | HSP70 | 2.4 | 7 | 0.028 | |
| 17 | XRE | 5.0 | 44 | 0.000 | |
| OSI-102695 | 4.2 | GST Ya (24 hr) | 2.0 | 18 | 0.043 |
| 1.4 | HSP70 | 2.1 | 4 | 0.043 | |
| 13 | XRE | 2.5 | 16 | 0.003 | |
| OSI-101820 | 14 | XRE | 2.9 | 20 | 0.001 |
| OSI-168992 | 1.9 | HIF1RE | 2.2 | 48 | 0.000 |
| 0.6 | XRE | 2.8 | 20 | 0.003 | |
| OSI-168961 | 8 | HIF1RE | 2.4 | 79 | 0.035 |
| 3 | XRE | 2.3 | 15 | 0.006 | |
| OSI-169050 | 14 | GADD153 | 2.3 | 6 | 0.004 |
| 42 | GST Ya (8 hr) | 2.3 | 13 | 0.009 | |
| 125 | GST Ya (24 hr) | 2.5 | 27 | 0.003 | |
| 42 | HIF1RE | 3.3 | 95 | 0.000 | |
| 42 | XRE | 3.9 | 32 | 0.002 | |
| OSI-169170 | 42 | GADD153 | 2.1 | 5 | 0.001 |
| 14 | GST Ya (8 hr) | 2.1 | 12 | 0.019 | |
| OSI-2040 | 10 | CJUN | 2.0 | 11 | 0.006 |
| 10 | GADD153 | 2.1 | 4 | 0.000 | |
| 0.4 | HSP70 | 6.8 | 28 | 0.022 | |
| 10 | NF-κ BRE | 4.1 | 0 | 0.022 | |
| 0.1 | XRE | 4.2 | 34 | 0.006 | |
| Proprionohydroxamic acid (PHA) | < 50 | None | - | - | - |
The HIF1RE construct was induced by the compounds OSI-168996, OSI-168961 and OSI-169050, suggesting that these compounds elicit a hypoxia response in HepG2 cells. Our own previous work with this cell line (unpublished results) has shown that the HIF1RE reporter construct may be activated by compounds known to activate the AH receptor such as 3-methylcholanthrene (MC) and benzo(a)pyrene (MC elicited a 3.7-fold increase in HIF1RE driven luciferase expression in this study). Not all of the compounds which induced the XRE construct also induced the HIF1RE construct however, indicating that the responses are not completely equivalent.
DISCUSSION
Chemically diverse compounds which induce γ globin transcription through histone deacetylase (HDA) inhibitory and distinct cell stress-associated mechanisms were identified. These effects could be observed in both K562 cells and human primary progenitor cells. In evaluating the screening systems employed, the isolated K562/HS2γ clones were considerably more responsive the K562/γYAC clones to compounds which induce the transcription of γ-globin, for example as observed in the frequency distribution data shown in Figure 3. This was true both with known compounds like azacytidine and hydroxyurea and the novel compounds identified here. Both HS2γ and γYAC K562 reporter cell lines identified compounds capable of increasing γ-globin expression both in the reporter assays as well as in human primary progenitor cells (Table 1).
The majority of the compounds which activated γ-globin transcription shared a common motif of two aryl moieties separated by less than four angstroms using one, two and three bond linkers of several types (urea, carbamate, amide, carbonyl, ether, thiourea, etc.). The phenyl imidazoles, phenyl hydrazones and phenyl triazols also may fall into this general structural class. Whether these compounds interact with the same cellular targets as the related, less potent compound, hydroxyurea, or have distinct protein targets remains to be determined. The most potent and efficacious activity was observed with the HDA inhibitor OSI-2040, which markedly increased HbF both in established and primary erythroid cell cultures at low nM concentration. The HDA inhibitory activity of OSI-2040 (termed apicidin by Merck) has been reported by other investigators [39–41] and found to be more effective than trichostatin A and MS-275 in stimulating histone hyperacetylation in K562 cells [39]. Proprionic hydroxamic acid also was shown to inhibit histone deacetylase, though with much lower potency and with slower kinetics of both histone deacetylase inhibition and γ-globin induction. Both aceto- and proprionic hydroxamic acids have been clinically investigated as urease inhibitors and showed good aqueous solubility. The hydroxamates generally showed relatively poor potency (>20 uM) but exhibited substantial efficacy after long term exposure (96 hours) as shown for proprionic hydroxamic acid in Figure 4.
One central question we investigated here was whether compounds which induce γ-globin could be non-toxic at efficacious concentrations in vitro. The data obtained from screening of >186,000 compounds and extracts suggest that for the vast majority of compounds tested some degree of cytotoxicity is required for γ-globin induction. One of the better tolerated cytotoxic chemotherapy agents which can increase HbF is hydroxyurea, sometimes used clinically in combination with erythropoietin [28]. It has been proposed that hydroxyurea acts to stimulate the synthesis of early erythroid progenitors capable of γ-globin transcription, presumably through preferential ablation of a more mature cell compartment leading to progenitor cell expansion. Recent data have shown hydroxyurea can activate p38 MAP-kinase in a sustained fashion and attenuated extracellular signal-related kinase (ERK) and the jun N-terminal kinase (JNK). Further, inhibition of p38 reduced the ability of hydroxyurea to stimulate globin production in K562 cells [42], strengthening a role for p38 activation in hydroxyurea action. In the case of the biaryl substituted ureas, amides and carbamates, the common mechanistic response was the activation of the aryl hydrocarbon response pathway (XRE) and not the activation of c-JUN. The mechanisms of these compounds were distinct from those of OSI-2040 which has potent histone deacetylase inhibitory activity and a distinct gene expression pattern as measured by microarray hybridization and by RT-PCR (J.H. unpublished)). Alterations in cell cycling have been inversely correlated with transcription of γ-globin [43]. One frequently used measure of cell cycling is the phosphorylation status of the retinoblastoma protein (Rb), which is phosphorylated in the G1 to S transition. In T47D cells, many of the γ-globin inducing compounds identified here cause the hypophosphorylation of Rb, indicative of cell cycle arrest or delay (data not shown). Conversely, in preliminary experiments the cdk inhibitors roscovitine and olomucine increased the expression of the γ-globin reporter line HS2γ/K562 (data not shown), though their inductions were modest compared to the HDA inhibitor OSI-2040. These data support the hypothesis that the biaryl ureas, amides and carbamates act in part through cell cycle dependent mechanisms, though the precise mechanisms by which these compounds act to alter the process of erythroid maturation and F cell production remain a point of continued investigation. It should be stressed that not all cytotoxic chemotherapeutic agents can induce the synthesis of HbF, indicating some degree of specificity in the signaling pathway requirements for γ-globin induction. Further, while cell cycle delay can contribute to induction of γ-globin transcription, other events, for example alterations in chromatin structure, are likely required for full activation of γ-gene expression. Even in the compounds identified here, which were selected for a relative lack of in vitro toxicity, a significant (p<0.01) trend between maximal γ induction and onset of cytotoxicity can be observed. The apparent outlier, PHA, may be explained by the relatively long period of time (~96 hours) required for maximal γ transcription and the shorter time periods used for stress gene measurement (<25 hrs). An onset of cytotoxicity was frequently observed at concentrations close or at that required for maximal γ-globin induction, producing steep, bell-shaped dose response curves (eg. Figure 4), strongly suggesting cell stress mechanisms form an obligate part of γ-globin inducing action.
Here we have developed screening methods useful in identifying compounds which stimulate γ-globin transcription and promote fetal hemoglobin production. The novel chemical compounds identified here provide pharmacophores for the development of new HbF elevating compounds for treatment of sickle disease and possibly Cooley’s anemia. They further provide tools by which the multiple mechanisms of pharmacological up regulation of γ-globin transcription may be investigated.
Acknowledgments
We thank David Houck, Ping Cai, John Slack, Paul Ney, George Dover and Arthur Neinhuis for materials and helpful advice. A portion of this work was funded under support from the National Heart, Lung and Blood Institute, NIH (R44 HL50935 and R01 HL57595) to J.D.H.
References
- 1.Noguchi CT, Haley JD, Abraham DJ, Schechter AN. Inhibition of sickle hemoglobin polymerization as a basis for therapeutic approaches to sickle cell anemia. In: Abraham DJ, editor. Burger’s Medicinal Chemistry and Drug Discovery. New York: John Wiley and Sons 2003; 6th edition, vol. 3.
- 2.Clegg JB, Weatherall DJ. Thalassemia and malaria: new insights into an old problem. Proc Assoc Am Physicians. 1999;111:278–82. doi: 10.1046/j.1525-1381.1999.99235.x. [DOI] [PubMed] [Google Scholar]
- 3.Stamatoyannopoulos G, Neinhuis AW. Hemoglobin switching. In: Stamatoyannopoulos G, Neinhuis A W, Majerus P, Varmus H. editors. The Molecular Basis of Blood Diseases. Philadelphia: W. B. Saunders, 1994, pp.107–55.
- 4.Berg P, Schechter A. The impact of molecular biology on the diagnosis and treatment of hemoglobin disorders. Molec Genet Med. 1992;2:1–38. doi: 10.1016/b978-0-12-462002-5.50006-6. [DOI] [PubMed] [Google Scholar]
- 5.Chada K, Magram J, Constantini F. An embryonic pattern of expression of a human fetal globin gene in transgenic mice. Nature. 1986;319:685–9. doi: 10.1038/319685a0. [DOI] [PubMed] [Google Scholar]
- 6.Chada K, Magram J, Raphael K, Radice G, Lacy E, Constantini F. Specific expression of a foreign beta-globin gene in erythroid cells of transgenic mice. Nature. 1985;314:377–80. doi: 10.1038/314377a0. [DOI] [PubMed] [Google Scholar]
- 7.Kollias G, Wrighton N, Hurst J, Grosveld F. Regulated expression of human A gamma-, beta-, and hybrid gamma beta-globin genes in transgenic mice: manipulation of the developmental expression patterns. Cell. 1986;46:89–94. doi: 10.1016/0092-8674(86)90862-7. [DOI] [PubMed] [Google Scholar]
- 8.Rutherford T, Neinhuis AW. Human globin gene promoter sequences are sufficient for specific expression of a hybrid gene transfected into tissue culture cells. Mol Cell Biol. 1987;7:398–402. doi: 10.1128/mcb.7.1.398. [DOI] [PMC free article] [PubMed] [Google Scholar]
- 9.Tuan D, Solomon W, Li Q, London IM. The “beta-like-globin” gene domain in human erythroid cells. Proc Natl Acad Sci USA. 1985;82:6384–8. doi: 10.1073/pnas.82.19.6384. [DOI] [PMC free article] [PubMed] [Google Scholar]
- 10.Grosveld F, van Assendelft GB, Greaves DR, Kollias G. Position-independent, high-level expression of the human beta-globin gene in transgenic mice. Cell. 1987;51:975–85. doi: 10.1016/0092-8674(87)90584-8. [DOI] [PubMed] [Google Scholar]
- 11.Talbot D, Collis P, Antoniou M, Vidal M, Grosveld F, Greaves DR. A dominant control region from the human beta-globin locus conferring integration site-independent gene expression. Nature. 1989;338:352–5. doi: 10.1038/338352a0. [DOI] [PubMed] [Google Scholar]
- 12.Wijgerde M, Grosveld F, Fraser P. Transcription complex stability and chromatin dynamics in vivo. Nature. 1995;377:209–13. doi: 10.1038/377209a0. [DOI] [PubMed] [Google Scholar]
- 13.Wood WG. The complexities of beta globin gene regulation. Trends Genet. 1996;12:204–6. doi: 10.1016/0168-9525(96)30043-7. [DOI] [PubMed] [Google Scholar]
- 14.Poillon WN, Kim B, Rodgers G, Noguchi C, Schechter A. Sparing effect of hemoglobin F and hemoglobin A2 on the polymerization of hemoglobin S at physiologic ligand saturations. Proc Natl Acad Sci USA. 1993;90:5039–43. doi: 10.1073/pnas.90.11.5039. [DOI] [PMC free article] [PubMed] [Google Scholar]
- 15.Atweh GF, Sutton M, Nassif I, Boosalis V, Dover GJ, Wallenstein S, Wright E, McMahon L, Stamatoyannopoulos G, Faller DV, Perrine SP. Sustained induction of fetal hemoglobin by pulse butyrate therapy in sickle cell disease. Blood. 1999;93:1790–97. [PMC free article] [PubMed] [Google Scholar]
- 16.Noguchi CT, Rodgers G, Serjeant G, Schechter AN. Levels of fetal hemoglobin necessary for treatment of sickle cell disease. N Eng J Med. 1988;318:96–9. doi: 10.1056/NEJM198801143180207. [DOI] [PubMed] [Google Scholar]
- 17.Zhou W, Clouston DR, Wang X, Cerruti L, Cunningham JM, Jane SM. Induction of human fetal globin gene expression by a novel erythroid factor, NF-E4. Mol Cell Biol. 2000;20:7662–72. doi: 10.1128/mcb.20.20.7662-7672.2000. [DOI] [PMC free article] [PubMed] [Google Scholar]
- 18.Asano H, Li X, Stamatoyannopoulos G. FKLF a novel Kruppel-like factor that activates human embryonic and fetal beta-like globin genes. Mol Cell Biol. 1999;19:3571–9. doi: 10.1128/mcb.19.5.3571. [DOI] [PMC free article] [PubMed] [Google Scholar]
- 19.Asano H, Li X, Stamatoyannopoulos G. FKLF-2: a novel Kruppel-like transcriptional factor that activates globin and other erythroid lineage genes. Blood. 2000;95:3578–84. [PubMed] [Google Scholar]
- 20.Jane SM, Nienhuis AW, Cunningham JM. Hemoglobin switching in man and chicken is mediated by a heteromeric complex between the ubiquitous transcription factor CP2 and a developmentally specific protein. EMBO J. 1995;14:97–105. doi: 10.1002/j.1460-2075.1995.tb06979.x. [DOI] [PMC free article] [PubMed] [Google Scholar]
- 21.Yang Z, Engel JD. Biochemical characterization of the developmental stage- and tissue-specific erythroid transcription factor, NF-E4. J Biol Chem. 1994;269:10079–87. [PubMed] [Google Scholar]
- 22.Gumucio DL, Rood KL, Gray TA, Riordan MF, Sartor CI, Collins FS. Nuclear proteins that bind the human gamma-globin gene promoter: alterations in binding produced by point mutations associated with hereditary persistence of fetal hemoglobin. Mol Cell Biol. 1988;8:5310–22. doi: 10.1128/mcb.8.12.5310. [DOI] [PMC free article] [PubMed] [Google Scholar]
- 23.Gumucio DL, Shelton DA, Zhu W, Millinoff D, Gray T, Bock JH, Slightom JL, Goodman M. Evolutionary strategies for the elucidation of cis and trans factors that regulate the developmental switching programs of the beta-like globin genes. Mol Phylogenet Evol. 1996;5:18–32. doi: 10.1006/mpev.1996.0004. [DOI] [PubMed] [Google Scholar]
- 24.McDonagh KT, Lin HJ, Lowrey CH, Bodine DM, Nienhuis AW. The upstream region of the human gamma-globin gene promoter. Identification and functional analysis of nuclear protein binding sites. J Biol Chem. 1991;266:11965–74. [PubMed] [Google Scholar]
- 25.Turner J, Crossley M. Basic Kruppel-like factor functions within a network of interacting haematopoietic transcription factors. Int J Biochem Cell Biol. 1999;31:1169–74. doi: 10.1016/s1357-2725(99)00067-9. [DOI] [PubMed] [Google Scholar]
- 26.DeSimone J, Heller P, Hall I, Zwiers D. 5-Azacytidine stimulates fetal hemoglobin synthesis in anemic baboons. Proc Natl Acad Sci USA. 1982;79:4428–31. doi: 10.1073/pnas.79.14.4428. [DOI] [PMC free article] [PubMed] [Google Scholar]
- 27.Koshy M, Dorn L, Bressler L, Molokie R, Lavelle D, Talischy N, Hoffman R, van Overveld W, DeSimone J. 2-deoxy 5-azacytidine and fetal hemoglobin induction in sickle cell anemia. Blood. 2000;96:2379–84. [PubMed] [Google Scholar]
- 28.Charache S, Terrin ML, Moore RD, Dover GJ, Barton FB, Eckert SV, McMahon RP, Bonds DR. Effect of hydroxyurea on the frequency of painful crises in sickle cell anemia. N Engl J Med. 1995;332:1317–22. doi: 10.1056/NEJM199505183322001. [DOI] [PubMed] [Google Scholar]
- 29.Pace BS, White GL, Dover GJ, Boosalis MS, Faller DV, Perrine SP. Short-chain fatty acid derivatives induce fetal globin expression and erythropoiesis in vivo. Blood. 2002;100:4640–8. doi: 10.1182/blood-2002-02-0353. [DOI] [PMC free article] [PubMed] [Google Scholar]
- 30.Ney P, Sorrentino B, Lowrey C, Nienhuis AW. Inducibility of the HS II enhancer depends on binding of an erythroid specific nuclear protein. Nucleic Acid Res. 1990;18:6011–17. doi: 10.1093/nar/18.20.6011. [DOI] [PMC free article] [PubMed] [Google Scholar]
- 31.de Wet JR, Wood K, DeLuca M, Helinski D, Subramani S. Firefly luciferase gene: structure and expression in mammalian cells. Mol Cell Biol. 1987;7:725–37. doi: 10.1128/mcb.7.2.725. [DOI] [PMC free article] [PubMed] [Google Scholar]
- 32.Grosveld F, Antoniou M, Berry M, deBoer E, Dillon N, Drabek D, Ellis J, Fraser P, Haley J, Philipsen S, Pruzina S, Raguz-Bolognesi S, Smith D, Trimbon T, Wijgerde M. Drug discovery and the transcriptional control of the human beta globin locus. In: Browne MJ, Thurlby PL, editors. Genomes, Molecular Biology and Drug Discovery. New York: Academic Press 1996. pp.117–127.
- 33.Fibach E, Burke LP, Schechter A, Noguchi C, Rodgers G. Hydroxyurea increases fetal hemoglobin in cultured erythroid cells derived from normal individuals and patients with sickle cell anemia or beta-thalassemia. Blood. 1993;81:1630–5. [PubMed] [Google Scholar]
- 34.Holmes M, Haley JD, Cerruti L, Zhou WL, Zogos H, Smith D, Cunningham JM, Jane SM. Identification of Id2 as a globin regulatory protein by representational difference analysis of K562 cells induced to express gamma globin with a novel fungal compound. Mol Cell Biol. 1999;19:4182–90. doi: 10.1128/mcb.19.6.4182. [DOI] [PMC free article] [PubMed] [Google Scholar]
- 35.Riggs M, Whittaker R, Neumann J, Ingram V. n-Butyrate causes histone modification in HeLa and Friend erythroleukaemia cells. Nature. 1977;268:462–4. doi: 10.1038/268462a0. [DOI] [PubMed] [Google Scholar]
- 36.Mosser DD, Theodorakis NG, Morimoto RI. Coordinate changes in heat shock element-binding activity and HSP70 gene transcription rates in human cells. Mol Cell Biol. 1988;8:4736–44. doi: 10.1128/mcb.8.11.4736. [DOI] [PMC free article] [PubMed] [Google Scholar]
- 37.Luethy JD, Holbrook NJ. Activation of the gadd153 promoter by genotoxic agents: a rapid and specific response to DNA damage. Cancer Res. 1992;52:5–10. [PubMed] [Google Scholar]
- 38.Prestera T, Talalay P. Electrophile and antioxidant regulation of enzymes that detoxify carcinogens. Proc Natl Acad Sci USA. 1995;92:8965–9. doi: 10.1073/pnas.92.19.8965. [DOI] [PMC free article] [PubMed] [Google Scholar]
- 39.Witt O, Monkemeyer S, Ronndahl G, Erdlenbruch B, Reinhardt D, Kanbach K, Pekrun A. Induction of fetal hemoglobin expression by the histone deacetylase inhibitor apicidin. Blood. 2003;101:2001–7. doi: 10.1182/blood-2002-08-2617. [DOI] [PubMed] [Google Scholar]
- 40.Darkin-Rattray SJ, Gurnett AM, Myers RW, Dulski PM, Crumley TM, Allocco JJ, Cannova C, Meinke PT, Colletti SL, Bednarek MA, Singh SB, Goetz MA, Dombrowski AW, Polishook JD, Schmatz DM. Apicidin: a novel antiprotozoal agent that inhibits parasite histone deacetylase. Proc Natl Acad Sci USA. 1996;93:13143–7. doi: 10.1073/pnas.93.23.13143. [DOI] [PMC free article] [PubMed] [Google Scholar]
- 41.Han JW, Ahn SH, Park SH, Wang SY, Bae GU, Seo DW, Kwon HK, Hong S, Lee HY, Lee YW, Lee HW. Apicidin, a histone deacetylase inhibitor, inhibits proliferation of tumor cells via induction of p21WAF1/Cip1 and gelsolin. Cancer Res. 2000;60:6068–74. [PubMed] [Google Scholar]
- 42.Park JI, Choi HS, Jeong JS, Han JY, Kim IH. Involvement of p38 kinase in hydroxyurea-induced differentiation of K562 cells. Cell Growth Diff. 2001;12:481–6. [PubMed] [Google Scholar]
- 43.Baliga BS, Pace BS, Chen HH, Shah AK, Yang YM. Mechanism for fetal hemoglobin induction by hydroxyurea in sickle cell erythroid progenitors. Am J Hematol. 2000;65:227–33. doi: 10.1002/1096-8652(200011)65:3<227::aid-ajh9>3.0.co;2-v. [DOI] [PubMed] [Google Scholar]


