

Abstract
To determine the effects of the stooped posture of patients with Parkinson’s disease (PD) on postural stability, we compared the kinetic, kinematic, and electromyographic responses of seven subjects with PD and 11 control subjects to eight directions of surface translations. Control subjects were studied in an upright posture and in a stooped posture that mimicked the posture of the PD subjects. When control subjects adopted a stooped posture, peak center of pressure displacements slowed and decreased, reducing stability margins toward values observed in PD subjects. Stooped control subjects, however, responded to translations with large joint angle displacements, whereas PD subjects exhibited small joint angle displacements. Stooping in control subjects did not lead to abnormally directed horizontal forces under each foot or antagonistic muscle co-activation at the hip and trunk, as seen in PD subjects. Upright and stooped control subjects never fell during the trials, whereas PD subjects fell in 16% of the trials. We conclude that stooped posture is a destabilizing posture, but it does not account for abnormal postural responses in PD.
Keywords: Parkinson’s disease, Posture, EMG, Kinematics, Balance
Introduction
Postural instability represents one of the more disabling motor symptoms of Parkinson’s disease (PD), and PD patients are more susceptible to falls than healthy elderly adults (Nevitt et al. 1989; Fletcher and Hirdes 2002). The responses of PD patients to external perturbations, such as a backward tug at the shoulders, are slower, smaller, and inadequate to maintain balance (Smithson et al. 1998). Quantitative studies of postural responses to support surface translations indicate that PD subjects respond with (1) decreased center of pressure (CoP) and increased center of mass (CoM) displacements, (2) diminished lateral hip and sagittal knee flexions, (3) weak and abnormally directed reaction forces at the ground, and (4) excessive antagonistic muscle co-contractions, compared to age-matched control subjects (Dimitrova et al. 2004a, b; Horak et al. 1996, 2005). Because of these abnormalities, Dimitrova et al. (2004a, b) and Horak et al. (2005) found that PD subjects exhibited directionally specific instability, particularly for perturbations that induced backward sway or lateral sway in narrow stance. Similar results were reported for PD subjects reacting to multidirectional surface rotations (Carpenter et al. 2004).
Additionally, as PD becomes more severe, patients stand with an increasingly narrow stance and stooped posture (Selby 1968). Thus, the severity of PD is associated with both increasing stooped posture and increasing postural instability. Therefore, stooped posture may represent a compensatory posture to combat instability, or stooped posture may be partly responsible for the abnormal postural responses in subjects with PD.
Few studies have examined the effects of stooping on postural control. Dietz et al. (1993) reported unchanged gastrocnemius responses to electrical stimulation when healthy subjects mimicked the stooped posture of patients with PD. Dietz et al. (1993) further noted that PD subjects become more unstable when they voluntarily adopt an upright posture, suggesting that stooping is compensation for, and not a cause of, primary postural deficits in PD. Bloem et al. (1999) investigated responses to toes-up rotations in healthy subjects adopting a stooped posture and concluded that, although some aspects of postural responses are abnormal in PD subjects (Bloem et al. 1996), stooped posture may represent a compensation to prevent backward falls because stooping minimized backward CoM displacements in response to toes-up rotations.
The observations reported by Bloem et al. (1999), however, may not generalize to postural responses to perturbations in other directions or to responses to surface translations. Furthermore, these observations do not address the influence of stooping on the (1) antagonistic muscle co-contractions, (2) weak and misdirected ground reaction forces, and (3) diminished hip and knee flexions observed in PD subjects in response to multidirectional surface translations (Dimitrova et al. 2004a, b; Horak et al. 2005). Therefore, to extend the findings of Bloem et al. (1999), we analyzed (1) EMG responses from 12 different muscles, representing distal leg muscles, proximal leg muscles, and trunk muscles; (2) hip, knee, and ankle angle displacements; (3) CoP and CoM displacements; and (4) ground reaction shear forces, from healthy control subjects and PD subjects in response to eight directions of surface translation. Control subjects responded to the translations while in stooped and upright postures, and PD subjects responded to the translations while in their naturally stooped posture.
Assuming the effects of stooping would be consistent among rotations and translations, we predicted that stooping would improve postural stability in control subjects by providing a mechanistic advantage that would decrease the peak CoM displacement (Bloem et al. 1999). The difference between the CoP and CoM, termed the “stability margin” (Winter 1979), would consequently increase. In addition, we postulated that in healthy subjects, improvements in the stability margin due to stooping would be direction-specific by affecting stability margins in response to sagittal perturbations more than stability margins in response to lateral perturbations, because flexion in the anterior–posterior (AP) plane may affect sagittal responses the most. We further predicted that the responses of subjects with PD would be different from healthy stooping by an overall decreased stability margin due to rigidity and antagonistic muscle co-activation, particularly in response to lateral perturbations. Consequent to muscle co-activations in PD subjects, we postulated that the directions of the active horizontal forces under the subjects’ feet in response to translations would not be constrained to the same directions of the forces under healthy subjects maintaining a similar stooped posture.
Materials and methods
Subjects
Seven patients with idiopathic PD (Hughes et al. 1992) and 11 age-matched, healthy control subjects participated. The control and PD subjects represented a subset of subjects included in other postural studies (Dimitrova et al. 2004a, b; Horak et al. 2005). Subjects were chosen to ensure similar demographics. Consequently, two-sided t-tests revealed no significant differences among the control and PD groups, respectively, in mean (± SE) age (64 ± 2 versus 66 ± 2 years), weight (75 ± 3 versus 80 ± 8 kg), height (171 ± 4 versus 172 ± 2 cm), foot length (26 ± 1 versus 25 ± 1 cm), and foot width (9.3 ± 0.3 versus 9.7 ± 0.4 cm); P>0.2 for all comparisons.
All PD subjects responded to levodopa and were tested at least 12 h after their last dose while in the practical “off” medication state. Subjects with other neurological, muscular, or psychiatric disorders (e.g. diabetes, peripheral neuropathies, uncorrected visual problems, hearing problems, joint pain, arthritis, fracture, stroke, and seizure) were excluded. PD patients with significant postural tremor, dysmetria, dystonia, or dementia were also excluded. Prior to each experiment, the PD subjects were evaluated using the Unified Parkinson’s Disease Rating Scale (UPDRS) and the modified Hoehn and Yahr scale. All PD subjects had moderate to severe PD with stooped posture, gait difficulties, and impaired balance (Table 1).
Table 1.
Characteristics of subjects with Parkinson’s disease
| PD subject ID# | Age (years) | Duration of PD (years) | Total motor UPDRS | Motor UPDRS lateral involvement
|
Posture (item 28) | Pull test (item 30) | Gait (item 29) | Hoehn and Yahr stage | |
|---|---|---|---|---|---|---|---|---|---|
| Left | Right | ||||||||
| 1 | 65 | 12 | 80.5 | 23 | 12 | 3 | 3 | 3 | 4 |
| 2 | 74 | 42 | 69 | 14 | 14 | 4 | 3 | 3 | 4 |
| 3 | 69 | 16 | 63 | 26 | 26.5 | 4 | 4 | 3 | 4 |
| 4 | 60 | 11 | 53 | 8.5 | 9.5 | 1 | 2 | 2 | 3 |
| 5 | 58 | 28 | 49 | 18 | 19 | 2 | 3 | 2 | 3 |
| 6 | 71 | 11 | 49 | 14 | 14 | 2 | 1 | 2 | 3.5 |
| 7 | 67 | 3 | 32 | 20 | 22 | 1.5 | 2 | 3 | 2.5 |
| Mean ± SEM | 66 ± 2 | 18 ± 5 | 56 ± 6 | 18 ± 2 | 17 ± 2 | 2.5±0.4 | 2.6 ± 0.4 | 2.6 ± 0.2 | 3.4 ± 0.2 |
All subjects gave informed consent, and the local ethics committee approved the study.
Protocol
All subjects stood facing a poster 4 m ahead, with their hands at their sides and each foot on a moveable force plate. Prior to each trial, subjects were instructed to stand with an equal amount of weight under each foot. We monitored the force distribution on the two force plates by an oscilloscope to ensure subjects complied with the instruction. The platform moved 9 cm in 1000 ms, with ramp-and-hold waveforms (2 cm/s2 peak acceleration) in eight randomly presented directions separated by 45° polar coordinates. Platform perturbations induced oppositely directed body sway, which we denote as: F, forward; B, backward; L, left; R, right; FL, forward-left; FR, forward-right; BL, backward-left; and BR, backward-right, body sway.
All subjects stood with a narrow stance, defined as a parallel alignment of the inside of the feet separated by 4.5 cm. Control subjects performed two blocks of trials: 40 trials in an upright posture followed by 24 trials in a stooped posture. For the stooped posture, the experimenter coached the control subjects to flex the hips and knees in a manner mimicking stooping in PD. PD subjects performed 40 trials in their natural posture. For the other studies (Dimitrova et al. 2004a, b; Horak et al. 2005), subjects performed 40 additional trials with a wide stance width. The PD subjects performed the widestance trials after performing the 40 narrow-stance trials analyzed in the current study. Control subjects first performed 40 trials in a narrow stance and upright posture, followed by 40 trials in a wide stance and upright posture, and then 24 trials in a narrow stance and stooped posture. Because subjects performed the widestance trials after the narrow-stance, natural-posture trials, the wide-stance trials likely did not affect the results of the current study pertaining to those conditions. The control subjects, however, performed the stooped-posture trials after the wide-stance trials. Therefore, the control subjects’ responses while in a stooped posture are subject to familiarity gained from the previous 80 trials. The first 80 trials, however, did not likely influence the results of the current study, because control subjects are capable of adapting their responses within a single trial (Chong et al. 1999, 2000).
The eight directions of surface translation were randomly presented 5 times for the control subjects when upright and for the PD subjects. Trials testing control subjects in the stooped posture were repeated three times for each of the eight directions. Subjects were harnessed to a ceiling-mounted track without any tension, and an assistant stood at their left to prevent falls. Subjects were encouraged to rest when needed, and rest was provided a minimum of every eight trials. Subjects rested until they felt ready to continue. Subjects did not complain of fatigue, and we did not observe differences in the dependent measures due to trial order. Trials in which subjects used the harness or were caught by the assistant were excluded from analysis.
Data collection and analyses
Kinematics and center of mass
A high-resolution Motion Analysis System (Santa Rosa, Calif., USA) with six video cameras, sampling at 60 Hz, provided three-dimensional spatial coordinate information about body segment displacements. Reflective markers were positioned bilaterally on the front of the body, at the approximate center of joint rotation for the third metatarsal joints, ankles, knees, hips, shoulders, elbows, and wrist joints, as well as on the temporal bones (Horak et al. 2005). A marker was also placed at the right-front corner of the platform to subtract its displacement from the body-marker displacements, thereby referencing kinematic measures to initial quiet stance.
For each subject, 26 anthropometrical measures of length, width, and circumference of the head, limbs, and trunk segments, as well as body height and weight, were collected (Chandler et al. 1975). These measures, in addition to the kinematic data, were used to calculate CoM position for each segment in the AP and lateral directions. Total body CoM was calculated as a weighted sum of the CoM position for each segment (Vaughan et al. 1991). Hip, knee, and ankle angles were derived from adjacent segments. Initial positions of CoM and joint angle were defined as the mean position over a 500-ms duration just prior to translation. Initial CoM was represented as the AP distance from the ankle markers. Changes in joint angle and CoM position were calculated over the duration of the platform translation and were referenced from the initial position. The amount of joint extension or flexion during a translation was defined by the time integral of the joint angle during periods of extension or flexion. A period of extension or flexion was defined as an increase or decrease in angle, respectively, that exceeded 2 SD of the mean initial angle. CoM displacement, and the amount of joint extension and flexion were determined from individual trials and then averaged by condition for each subject.
Horizontal forces and center of pressure
Subjects stood on two force plates, each with four vertical and two horizontal strain gauge transducers mounted on the movable platform to record three-dimensional ground reaction forces under each foot. Force signals were amplified and sampled at 120 Hz. For seven control subjects and seven PD subjects, the horizontal force under each foot was calculated as a vector sum of the longitudinal and lateral forces, and the net horizontal force represented a vector sum of the forces under both feet. The active horizontal forces were defined within 150–850 ms after translation. The 150-ms delay accounted for muscle onset latency, plus 50 ms for electromechanical delay (Dimitrova et al. 2004a, b). The active horizontal force magnitudes were normalized to body weight.
Total body AP CoP was calculated from the weighted sum of CoP under each foot (Winter et al. 1996; Henry et al. 1998a). Total body lateral CoP was calculated from the sum of the right and left force plates’ loading plus the lateral CoP under each foot (Henry et al. 1998a). The initial position of CoP in relation to the edges of foot support was measured after each experiment from tracings of tape outlining the feet. There was no difference between the foot sizes of the control and PD subjects (P>0.05). The length of the base of support was similar for the backward and lateral directions. The base of support for the backward and lateral directions was smaller than the base of support for the forward directions. Initial CoP was defined as the mean position taken over the 500-ms duration just prior to translation. Initial CoP in the AP direction was referenced from the position of the malleolus. Peak CoP (referenced to the initial position) and CoP velocity were determined from individual trials and then averaged by condition for each subject. Initial CoP velocity was the averaged velocity from 150 to 350 ms after translation onset, and maximum CoP velocity was the peak derivative of CoP excursion over the duration of the trial. “Stability margin” represented the difference between peak CoP and peak CoM displacements because the farther ahead the CoP is from the CoM, the less likely the subject falls in that direction (Winter 1979; Horak et al. 2005).
Electromyography
Surface EMG activity was recorded differentially with bipolar Ag–AgCl electrodes placed on the muscle belly, 2 cm apart along the length of the muscle, with a ground electrode at C7. Data were collected at 480 Hz from six muscles bilaterally (12 muscles): lumbar erector spinae (ESP), rectus abdominis (ABD), tensor fascia latae (TFL), adductor longus (ADD), tibialis anterior (TIB), and soleus (SOL). To minimize differences in EMG magnitude due to skin impedance, resistance was kept ≤ 10 kΩ. There were no significant differences between control (5.7 ± 1.3 to 9.3 ± 1.6 kΩ) and PD (6.6 ± 1.2 to 10.6 ± 1.7 kΩ) subjects’ skin impedance. Each amplifier was used on the same muscle in all subjects, and amplifier/preamplifier bias was subtracted from each channel to minimize differences in EMG magnitude due to amplifier characteristics. The EMG signals were amplified (×5000–20,000), band-pass filtered (15–2500 Hz), full-wave rectified, and integrated at a cut-off frequency of 100 Hz. EMG signals were monitored during testing to verify signal quality and to ensure minimal cross-talk.
The magnitude of muscle responses to perturbations for each trial was defined by integrating the EMG signal (IEMG) during a time window of 70–470 ms following the onset of translation. This window corresponds to medium- and long-latency postural muscle bursts during platform translation (Diener and Dichgans 1987; Diener et al. 1988; Henry et al. 1998b). Background EMG activity was estimated by the mean value over 500 ms prior to translation onset and was subtracted from the active postural response. Muscle tuning-curves, defined as the mean IEMG magnitude plotted in polar coordinates against the direction of induced body sway, were calculated for each subject, and were subsequently analyzed by group (Macpherson 1988). The preferred direction of muscle activity for each muscle was estimated as a vector sum of the EMG responses to each direction of platform translation. For upright control subjects, directions in which a muscle exhibited less than 50% of its maximal activity were considered non-preferred (i.e. antagonistic) directions of activity for that muscle in all three groups of subjects. Therefore, with stooped control subjects or with PD subjects, antagonistic co-activation was defined as any muscle activity induced by a surface translation in which the muscle exhibited more than 50% of their maximal activity from the preferred direction of activation, provided the percent of antagonistic muscle activity in PD subjects or stooped control subjects was significantly different from the percent of antagonistic muscle activity in upright control subjects.
Statistical analyses
Trial results were averaged for each subject, and subject averages were analyzed by ANOVA. The active horizontal force magnitude and direction, peak CoP and CoM displacements, CoP velocity, the stability margin (peak CoP–peak CoM), the amount of joint flexion and extension, and IEMG magnitudes were analyzed by two mixed-model ANOVAs and one repeated-measures ANOVA. Specifically, one mixed-model ANOVA examined differences among PD subjects and upright control subjects, and another mixed-model ANOVA examined differences among PD subjects and stooped control subjects, treating group as a between-groups factor with two levels and the direction of platform translation as a repeated-measures factor with eight levels. The third ANOVA examined differences among stooped and upright control subjects, treating the two postural conditions and the direction of platform translation (eight levels) as repeated-measures factors, because the same control subjects performed trials in both postures. Each analysis was treated with a Bonferroni correction for multiple comparisons.
To compare the extent to which muscles were activated in their non-preferred directions between groups (i.e. antagonistic co-activation), IEMG activity was compared with three similar ANOVAs (comparing two groups or two postural conditions and n directions of translation) for each direction in which control subjects activated muscles less than 50% of their maximum activation during perturbations in upright posture. The number of directions (n) that were compared ranged from three to five for each muscle. For every measure, group differences are reported as mean ± standard error to the mean (SEM), and significance was defined as a P-value <0.05.
Joint motion data (but not the other variables) were omitted for one control subject identified as an outlier because the data were 2 SD from the mean while in stooped posture. Specifically, this subject demonstrated an unusual amount of flexion at the knees (mean = 3829 deg s) and ankles (mean = 2229 deg s) in response to perturbations while stooping. This flexion response was in contrast to all other control subjects who extended their knees and ankles in response to perturbations while stooping.
Results
Initial body and pressure positions
Stooped control subjects successfully mimicked the initial postural alignment of the PD subjects. Initial sagittal CoM position was not different between stooped control and PD subjects (P>0.2). Although both groups’ positions were held more forward than those of upright control subjects, significant differences were evident only among the upright and stooped control subjects (P<0.005, Fig. 1a). The initial CoP position in stooped control subjects was also held more forward compared with upright control subjects and PD subjects, although these differences were not significant (Fig. 1b). Figure 1c compares group mean joint angles during baseline quiet stance. The stooped control subjects and PD subjects exhibited similar initial hip (P>0.2), knee (P>0.2), and ankle angles (P>0.06), although some stooped control subjects tended to flex their ankles more than PD subjects flexed their ankles. Control subjects flexed their ankles more when stooped than when upright during baseline quiet stance (P<0.01). The stooped control and PD subjects’ initial hip and knee angles were more flexed than those of the upright control subjects (P<0.01), and initial ankle angles were not different between the upright control and PD subjects (P>0.6, Fig. 1c).
Fig. 1.
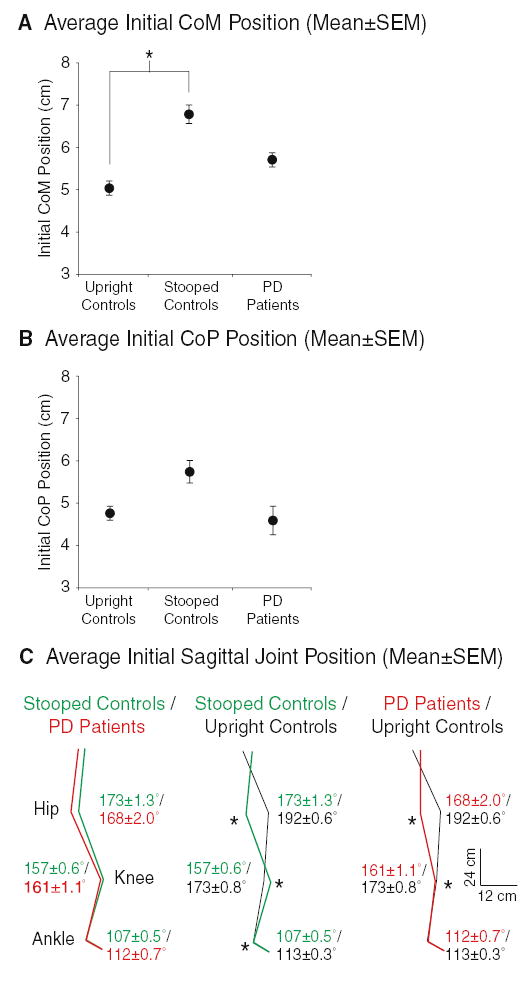
Group mean ± SEM initial CoM (a), CoP (b), and sagittal joint angle (c) positions recorded during the 500 ms just prior to perturbations for each trial. CoM positions (cm) are referenced to the ankle marker. CoP positions are referenced to the subjects’ malleolus over the center of the footplate. In (c), mean ± SEM values (in degrees) for each group are provided next to each joint. A * denotes significant group differences (P<0.05) for each measure
Measures of stability
Stooping decreased the stability margin of the control subjects (P<0.005). The stability margin of subjects with PD, however, was even smaller than the stability margin for stooped control subjects (P<0.05, left side of Fig. 2a). Despite the decreased margin of stability, control subjects never fell, regardless of posture. In contrast, PD subjects fell in 16% of the trials, primarily in the backward, back-left, and leftward directions (right side of Fig. 2a). Stability decreased for PD subjects compared with upright control subjects due to (1) increased peak CoM displacement, (2) decreased peak CoP displacement, (3) decreased initial CoP velocity, and (4) decreased peak CoP velocity (P<0.01 for all comparisons, Fig. 2b and Table 2). Stability decreased for stooped control subjects compared with upright control subjects due to (1) decreased peak CoP displacement, (2) decreased initial CoP velocity, and (3) decreased peak CoP velocity (P<0.01 for all comparisons, Fig. 2b and Table 2). Peak CoM displacements were not significantly different among upright and stooped control subjects (Table 2).
Fig. 2.
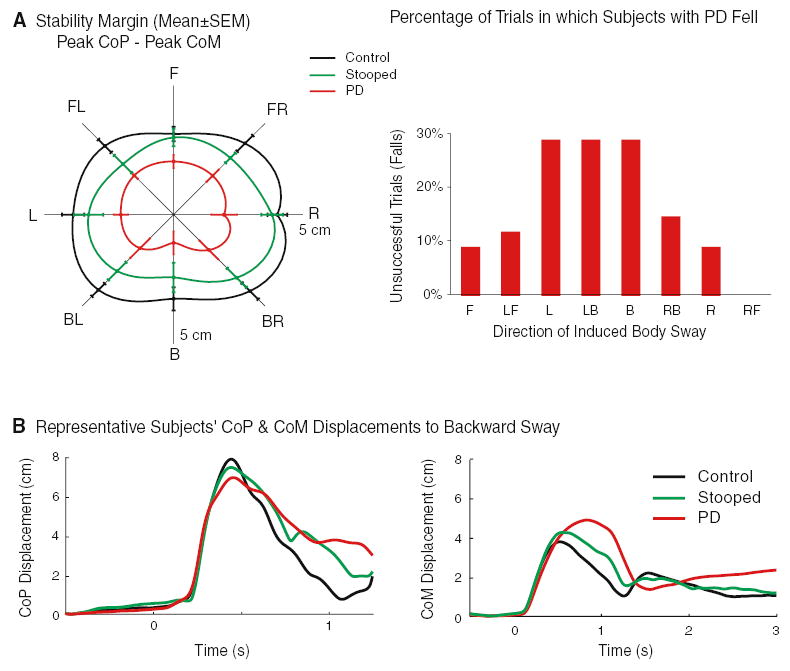
a Group mean ± SEM stability margins (difference between peak CoP and peak CoM displacements), and the percentage of trials in which PD subjects fell into the harness or were aided by the spotter to prevent an imminent fall for each direction of induced body sway. The axis quadrant for stability margins represents 5 cm. Differences were significant (P<0.05) among all three subject groups. Control subjects (not shown) did not fall in any trial, regardless of stance posture. b Representative subject averages for CoP and CoM displacements (cm) in response to five forward surface translations over time (s)
Table 2.
Measures of stability
| Measure | Group mean ± SEM across all eight directions
|
||
|---|---|---|---|
| Upright | Stooped | PD | |
| Stability margin (cm) | 3.78 ± 0.14 | 3.12 ± 0.16 | 1.90 ± 0.14 |
| Peak CoM (cm) | 4.14 ± 0.07 | 4.38 ± 0.11 | 5.12 ± 0.16 |
| Peak CoP (cm) | 7.92 ± 0.11 | 7.50 ± 0.11 | 7.02 ± 0.12 |
| CoP initial velocity (cm/s) | 30.96 ± 0.60 | 28.31 ± 0.72 | 21.89 ± 0.46 |
| CoP peak velocity (cm/s) | 48.95 ± 1.14 | 42.92 ± 1.11 | 31.87 ± 0.94 |
For all groups, the stability margin was smallest and the initial CoP velocity was slowest in response to translations that induced backward sway (P<0.05, Fig. 2a). Compared with lateral translations, peak CoP and peak CoM displacements were smaller in response to AP translations (P<0.01, illustrated in Fig. 2a by the stability margin). Significant group-by-direction interactions were evident for the initial CoP velocity: (1) compared with upright posture, stooped control subjects demonstrated slower velocities for F, FL, and FR directions of induced body sway (P<0.01), and (2) stooped control subjects increased their initial CoP velocity in response to lateral translations, whereas PD subjects exhibited slow initial CoP velocities in response to every direction of platform translation (P<0.05).
Measures of joint motion
Stooping in control subjects did not reduce joint displacements in response to perturbations, as seen in PD subjects (Fig. 3). Control subjects flexed their hips laterally in response to perturbations when stooped more than when upright (P<0.01), and they did so more than did the PD subjects (P<0.0001). Stooped control subjects exhibited more sagittal ankle extension in response to perturbations than did the PD subjects (P<0.05) or the upright control subjects (P<0.05), with no differences between PD subjects and upright control subjects (P>0.5). In response to perturbations, upright control subjects flexed their hips and knees in the sagittal plane more than the stooped control subjects (P<0.01 at the hip; P<0.001 at the knee), or the PD subjects (P<0.05 at the hip and knee). The stooped control subjects and the PD subjects responded with similar amounts of hip and knee flexion (P>0.2 at the hip and knee). Unlike PD subjects, stooped control subjects exhibited directionally specific hip and knee extensions (significant group-by-direction interactions), with hip extensions primarily occurring during induced backward sway and knee extensions primarily occurring during induced forward sway. These hip and knee extensions were greater in the stooped control subjects than in the upright control subjects (P<0.05 at the hip; P<0.01 at the knee). Knee extensions in stooped control subjects were also greater than those of PD subjects (P<0.05). Despite qualitatively greater hip extension during induced backward sway for stooped control subjects, differences in sagittal hip extension did not reach significance when compared with PD subjects.
Fig. 3.

Group mean ± SEM amount of joint flexion (left column) and joint extension (right column) for each direction of induced body sway during the time of translation. Values are in deg s (see Materials and methods), and the scales for each quadrant axis are presented within each plot. Note that scales are not equal among plots. Scales were chosen to emphasize group differences within each measure. Joint angles were calculated from markers on the right side of the body. Control subject no. 4 was omitted as an outlier
Measures of horizontal forces
The directions of the active horizontal forces under each foot were the same for upright and stooped control subjects, but differed from subjects with PD (Fig. 4a). Specifically, control subjects in either posture responded to lateral and diagonal platform translations primarily with their loaded limbs (the limb ipsilateral to the direction of induced body sway), rotating the force slightly backward from the direction of induced sway under the loaded leg. The direction of the force under the unloaded limb rotated to a forward direction. In contrast, subjects with PD responded to lateral and diagonal translations by directing both the unloaded and the loaded leg toward the direction of induced sway. For the PD subjects compared to the control subjects in either posture, shear force direction was different under the unloaded right foot in response to rightward perturbations that induced left-sway (P<0.01). Net horizontal-force directions summed for both feet, however, were similar for all three groups (Fig. 4a) and corresponded to the direction of induced sway.
Fig. 4.
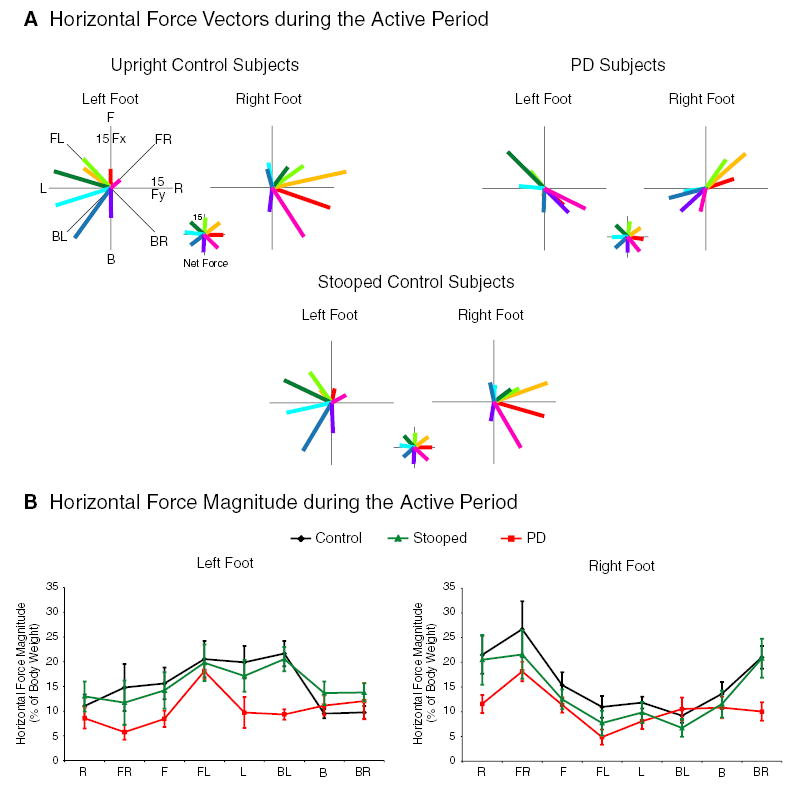
a Group-average horizontal-force vectors in response to eight directions of body sway during the active period (150–850 ms after translation onset). Net-force vectors (illustrated in smaller scale) represent the sum of the right and left foot vectors. The force vector colors denote the direction of induced body sway as illustrated by the net-force plots. For example, a backward translation induced a forward sway (light green) and a forward net horizontal force vector. b Horizontal force magnitude (group mean ± SEM) under each foot in response to eight directions of body sway during the active period. Force magnitude is expressed as a percentage of body weight
PD subjects’ horizontal-force magnitudes (Fig. 4b) under both feet were smaller than those of upright control subjects (P<0.005). Horizontal-force magnitudes were also smaller in subjects with PD compared with those in stooped control subjects under the left foot (P<0.01), but not under the right foot. Stooping in control subjects, compared to upright posture, reduced the magnitude of the horizontal forces under the right foot (P<0.01), but not under the left foot.
Measures of muscle activation
There were no significant group differences in the amount of IEMG activation. The TFL tended to activate most for upright control subjects, less for stooped control subjects, and even less for PD subjects, and PD subjects tended to activate the ESP muscle more than control subjects in either posture, but these group differences did not reach significance (Table 3). Every muscle, however, demonstrated directionally specific activation. The SOL muscle primarily activated for forward directions of induced body sway in the quadrant ipsilateral to that muscle (P<0.0001). The TIB muscle primarily activated for backward directions of induced body sway in the quadrant ipsilateral to that muscle (P<0.0001). The TFL muscle primarily activated for ipsilateral directions of induced body sway (P<0.0001). The ADD muscle primarily activated for backward directions of induced body sway in the quadrant contralateral to that muscle (P<0.05). The ESP muscle primarily activated for backward directions of induced body sway in the quadrant ipsilateral to that muscle (P<0.01). The ABD muscle primarily activated for backward directions of induced body sway (P<0.05).
Table 3.
Measures of muscle activity
| Measure | Group mean ± SEM across all directions
|
||
|---|---|---|---|
| Upright | Stooped | PD | |
| Right ESP IEMG (μV s) | 5515 ± 492 | 5488 ± 421 | 8774 ± 767 |
| Left ESP IEMG (μV s) | 5421 ± 417 | 5504 ± 429 | 9524 ± 823 |
| Right TFL IEMG (μV s) | 15,783 ± 2460 | 11,778 ± 1814 | 7139 ± 915 |
| Left TFL IEMG (μV s) | 18,160 ± 2152 | 12,679 ± 1397 | 6858 ± 833 |
| Right ADD co-activation (% max) | 31 ± 2 | 43 ± 4 | 56 ± 5 |
| Left ADD co-activation (% max) | 30 ± 2 | 41 ± 4 | 57 ± 5 |
| Right ESP co-activation (% max) | 46 ± 4 | 40 ± 2 | 53 ± 3 |
| Left ESP co-activation (% max) | 46 ± 5 | 45 ± 5 | 70 ± 7 |
Antagonistic co-activation was evident in PD subjects at the hip between the ADD and TFL muscles, but not in stooped or upright control subjects (P<0.01, Fig. 5). Antagonistic co-activation was also evident in PD subjects at the trunk between the ESP and ABD muscles, but these co-activations were only significantly different from upright control subjects for the left ESP muscle (P<0.05). Group averages for IEMG activity and antagonistic co-activations are given in Table 3.
Fig. 5.
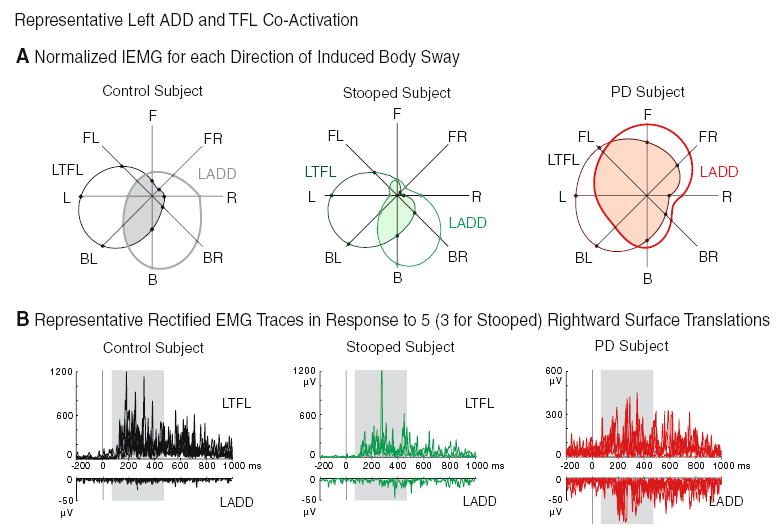
a Representative subject average IEMG values of the left ADD and TFL for each direction of induced body sway, demonstrating comparatively larger antagonistic co-activations (shaded regions) for the PD subject. Values represent a percentage normalized to the direction of maximum IEMG activation. b Representative subjects’ rectified EMG of the left TFL (top) and ADD (bottom) in response to five rightward translations (three for the stooped subject). The 400-ms period of integration (the shaded rectangle) began 70 ms after translation onset (solid bar at time zero)
Discussion
Stooped posture is a destabilizing posture
We found that stooping decreases postural stability in control subjects, although not to the extent observed in PD subjects. Stooped posture in control subjects decreased the magnitude and speed of CoP displacements, thereby leading to a decreased stability margin. Although stooping decreased stability margins in response to all eight directions of induced body sway, stooping destabilized control subjects the most in the AP directions, with the largest decrease in CoP velocity in response to forward induced sway, and the largest decrease in stability margin in response to backward induced sway. Therefore, lateral translations best differentiated PD subjects from control subjects, because they were less influenced by stooped posture. This observation is important because the majority of posture research utilizes AP perturbations when studying the effects of PD (Dietz et al. 1988; Bloem et al. 1996; Horak et al. 1996).
Stooped posture does not fully account for the postural instability of PD
Despite the destabilizing effect of stooped posture, stooping alone cannot explain instability in PD because the stability margin in stooped control subjects did not decrease to the magnitude of the stability margin in PD subjects. In addition, the stooped control subjects did not fall at all, in contrast to some of the PD subjects.
PD subjects are also different from healthy stoopers because, unlike the healthy elderly control subjects (upright or stooped) in this study, young control subjects (Henry et al. 2001), and cats (Macpherson 1988), PD subjects did not constrain the direction of the horizontal forces under their feet in responses to multidirectional displacements. A force constraint on the direction of horizontal active forces may represent a neural control strategy that minimizes destabilizing interactive torques on the trunk (Macpherson 1994; Henry et al. 2001). In response to lateral translations, by pushing with the loaded limb (the limb ipsilateral to the direction of induced body sway) in a backward/lateral direction and pushing with the unloaded limb in a forward direction, control subjects produce a force coupling that may reduce trunk rotations that accompany lateral hip flexions (Henry et al. 2001). In contrast to the force constraint strategy employed by control subjects, PD subjects co-activated antagonistic muscle groups at the hip and increased trunk stiffness at the lumbar erector spinae to stabilize the trunk.
Joint motion profiles between stooped control and PD subjects also supported the conclusion that PD subjects are different from healthy stoopers. Despite CoP displacements tending toward PD values in stooped control subjects, both upright and stooped control subjects exhibited large, direction-specific hip flexions and extensions, whereas PD subjects exhibited small hip flexions and extensions. Lateral hip flexion more reliably differentiated control from PD subjects’ postural responses because lateral hip flexion in response to lateral translations was not affected by stooping. Sagittal hip and knee angles revealed that while upright control subjects responded to translations with flexion, stooped control subjects responded with extension, and PD subjects exhibited minimal hip and knee flexion or extension. Therefore, stooped posture appears to confound hip and knee flexion in the sagittal plane. This observation, however, does not mean that PD subjects exhibit healthy responses at the hip and knee because they also exhibited undersized hip and knee extensions compared to hip and knee extensions in stooped control subjects.
The propensity to fall leftward in our PD population was unexpected. To ensure that the propensity to fall leftward was not due to unequal symptom involvement between the right and left sides of the body, motor UPDRS sub-scores that differentiate left- and right-sided symptoms were summed for each PD subject. A Wilcoxon t-test confirmed that there was no significant difference between left- and right-side involvements within the PD group (Table 1). Thus, unilateral involvement cannot explain the asymmetry of the subjects’ instability. This asymmetric instability could be due to a subject sample bias, given that every subject was right-handed, which could translate to limb dominance and imbalanced strength. In addition, the assistant stood to the left of the subjects, which could have diminished their fear and resistance to falling toward the left side. These factors, combined with the PD subjects’ general instability and weak, misdirected ground reaction forces, could have made the PD subjects prone to leftward falls.
CoP and CoM displacements, horizontal ground-reaction forces, hip and knee motions, and EMG activity, therefore, all demonstrate that stooping in PD subjects is a destabilizing posture, but PD subjects are not unstable simply because they stoop. PD subjects are also more unstable than healthy control subjects because they co-activate antagonistic muscle groups, stiffen their joints, and produce weak and abnormally directed ground reaction forces. This stiffening response at the hip inhibits the postural response in PD subjects, because movements around the hip provide a fast and effcient means to counteract a perturbation to the CoM (Kuo and Zajac 1993; Kuo 1995). Therefore, by stiffening their hips, PD subjects became unstable because they could not move their trunk quickly to adjust their CoM in response to surface translations.
Why do PD subjects stoop?
The decline in stability between an upright posture and a stooped posture in control subjects did not corroborate the hypothesis that the purpose of a stooped posture is to prevent falls (Dietz et al. 1993; Bloem et al. 1999). The observation that stooping destabilized responses to translations but has a stabilizing effect to backward rotations (Bloem et al. 1999) demonstrates the context-specific nature of postural responses. Responses to translations require the CoM to relocate within a base of support that displaces horizontally, whereas responses to rotations require a minimization of CoM displacement within a rotated support base that remains in a relatively similar horizontal position. This difference in the interaction among the CoM and the base of support requires distinct kinematic strategies and muscle activation patterns when responding to translations or rotations (Szturm and Fallang 1998). For rotations, a stooped posture would provide a stabilizing effect because flexion at the knee shortens the gastrocnemius, thereby decreasing that muscle’s passive stiffness and diminishing its medium-latency response to a toes-up rotation (Bloem et al. 1999). A diminished response at the gastrocnemius would inhibit plantar flexion of the ankle, thereby preventing a backward fall of the CoM. Additionally, a stooped posture allows for passive flexion at the hip, knee, and ankle along the gravitational vector. We speculate that this collapse of the hip, knee, and ankle would also stabilize the CoM in response to a toes-up rotation. In contrast, for translations, because the postural response must quickly relocate the CoM over a horizontally displaced base of support, a stooped posture may interfere with a response to a translation more than to a rotation. Specifically, a stooped posture takes the body out of a more neutral, upright position, which may render a stooped subject less capable to quickly counteract a randomly directed perturbation (as demonstrated by the diminished CoP velocity in stooped control subjects compared with upright control subjects). Despite the context-dependent differences among responses to rotations and translations, similarities suggest that rotations and translations assess similar postural control mechanisms affected by PD: (1) both translations and rotations elicit antagonistic muscle co-contractions and a propensity for backward instability in PD subjects (Carpenter et al. 2004; Dimitrova et al. 2004a; Horak et al. 2005), and (2) reactions to both translations and rotations moderately correlate with the Pull Test of the UPDRS (Bloem et al. 1998; Horak et al. 2005).
If not to prevent backward falls, what is the cause of stooping in PD? The stooped posture in PD subjects may represent tonic hyperactivity of the flexors due to abnormal drive from the basal ganglia (Zhang et al. 1999). Alternatively, stooped posture in PD subjects may represent a compensatory strategy to facilitate forward motion of the CoM during step initiation. A stooped posture would require less force to move the trunk forward as required for progression during stepping because the CoM is closer to the front edge of the base of support during quiet stance. The narrow foot separation commonly seen in PD represents another example of how a change in posture facilitates step initiation, but destabilizes responses to surface translations (Gross et al. 2000). Thus, in an effort to facilitate mobility in the face of bradykinesia, PD subjects may change their initial posture, inadvertently reducing their ability to withstand external perturbations with their feet in place. Further studies are needed to determine whether stooping facilitates or impairs voluntary stepping to initiate gait or compensatory stepping to preserve balance.
Acknowledgments
The authors thank Martine Mientjes for data analysis, Gary Sexton for advice on statistical procedures (supported by PHS grant 5 M01 RR000334); Jill Knop for figure graphics; and Sandra Oster, Leta Guptill, and Patricia Carlson-Kuhta for editorial assistance. This research was supported by NIH grant AG-06457 (Dr. Horak) and HSFPO SF0011/1999-B (Dr. Dimitrova).
References
- Bloem BR, Beckley DJ, van Dijk JG, Zwinderman AH, Remler MP, Roos RA. Influence of dopaminergic medication on automatic postural responses and balance impairment in Parkinson’s disease. Mov Disord. 1996;11:509–521. doi: 10.1002/mds.870110506. [DOI] [PubMed] [Google Scholar]
- Bloem BR, Beckley DJ, van Hilten BJ, Roos RA. Clinimetrics of postural instability in Parkinson’s disease. J Neurol. 1998;245:669–673. doi: 10.1007/s004150050265. [DOI] [PubMed] [Google Scholar]
- Bloem BR, Beckley DJ, van Dijk JG. Are automatic postural responses in patients with Parkinson’s disease abnormal due to their stooped posture? Exp Brain Res. 1999;124:481–488. doi: 10.1007/s002210050644. [DOI] [PubMed] [Google Scholar]
- Carpenter MG, Allum JH, Honegger F, Adkin AL, Bloem BR. Postural abnormalities to multidirectional stance perturbations in Parkinson’s disease. J Neurol Neurosurg Psychiatry. 2004;75:1245–1254. doi: 10.1136/jnnp.2003.021147. [DOI] [PMC free article] [PubMed] [Google Scholar]
- Chandler RF, Clauser CE, McConville JT, Reynolds HM, Young JW (1975) Investigation of inertial properties of the human body. Aerospace Medical Research Laboratory, Washington D.C., pp 1–162
- Chong RK, Jones CL, Horak FB. Postural set for balance control is normal in Alzheimer’s but not in Parkinson’s disease. J Gerontol A Biol Sci Med Sci. 1999;54:M129–M135. doi: 10.1093/gerona/54.3.m129. [DOI] [PubMed] [Google Scholar]
- Chong RK, Horak FB, Woollacott MH. Parkinson’s disease impairs the ability to change set quickly. J Neurol Sci. 2000;175:57–70. doi: 10.1016/s0022-510x(00)00277-x. [DOI] [PubMed] [Google Scholar]
- Diener HC, Dichgans J (1987) The use of short- and long-latency reflex testing in leg muscles of neurological patients. In: Weindl A (ed) Clinical aspects of sensory motor integration. Springer, Berlin Heidelberg New York, pp 165–174
- Diener HC, Horak FB, Nashner LM. Influence of stimulus parameters on human postural responses. J Neurophysiol. 1988;59:1888–1905. doi: 10.1152/jn.1988.59.6.1888. [DOI] [PubMed] [Google Scholar]
- Dietz V, Berger W, Horstmann GA. Posture in Parkinson’s disease: impairment of reflexes and programming. Ann Neurol. 1988;24:660–669. doi: 10.1002/ana.410240511. [DOI] [PubMed] [Google Scholar]
- Dietz V, Zijlstra W, Assaiante C, Trippel M, Berger W. Balance control in Parkinson’s disease. Gait Posture. 1993;1:77–84. [Google Scholar]
- Dimitrova D, Nutt JG, Horak FB. Postural muscle responses to multidirectional translations in patients with Parkinson’s disease. J Neurophys. 2004a;91:489–501. doi: 10.1152/jn.00094.2003. [DOI] [PubMed] [Google Scholar]
- Dimitrova D, Nutt JG, Horak FB. Abnormal force patterns for multidirectional postural responses in patients with Parkinson’s disease. Exp Brain Res. 2004b;156:183–195. doi: 10.1007/s00221-003-1770-4. [DOI] [PubMed] [Google Scholar]
- Fletcher PC, Hirdes JP. Risk factors for falling among community-based seniors using home care services. J Gerontol A Biol Sci Med Sci. 2002;57:M504–M510. doi: 10.1093/gerona/57.8.m504. [DOI] [PubMed] [Google Scholar]
- Gross AK, Frank JS, Nutt JG, Horak FB. The effects of stance width on gait initiation: voluntary and forced stepping in controls and subjects with Parkinson’s disease. Soc Neurosci Abstr. 2000;26:164. [Google Scholar]
- Henry SM, Fung J, Horak FB. Control of stance during lateral and anterior/posterior surface translations. IEEE Trans Rehabil Eng. 1998a;6:32–42. doi: 10.1109/86.662618. [DOI] [PubMed] [Google Scholar]
- Henry SM, Fung J, Horak FB. EMG responses to maintain stance during multidirectional surface translations. J Neurophysiol. 1998b;80:1939–1950. doi: 10.1152/jn.1998.80.4.1939. [DOI] [PubMed] [Google Scholar]
- Henry SM, Fung J, Horak FB. Effect of stance width on multidirectional postural responses. J Neurophysiol. 2001;85:559–570. doi: 10.1152/jn.2001.85.2.559. [DOI] [PubMed] [Google Scholar]
- Horak FB, Frank J, Nutt J. Effects of dopamine on postural control in parkinsonian subjects: scaling, set, and tone. J Neurophysiol. 1996;75:2380–2396. doi: 10.1152/jn.1996.75.6.2380. [DOI] [PubMed] [Google Scholar]
- Horak FB, Dimitrova D, Nutt JG. Direction-specific postural instability in Parkinson’s disease. Exp Neurol. 2005;193(2):504–521. doi: 10.1016/j.expneurol.2004.12.008. [DOI] [PubMed] [Google Scholar]
- Hughes AJ, Ben-Shlomo Y, Daniel SE, Lees AJ. What features improve the accuracy of clinical diagnosis in Parkinson’s disease: a clinicopathologic study. Neurology. 1992;42:1142–1146. doi: 10.1212/wnl.42.6.1142. [DOI] [PubMed] [Google Scholar]
- Kuo AD. An optimal control model for analyzing human postural balance. IEEE Trans Biomed Eng. 1995;42:87–101. doi: 10.1109/10.362914. [DOI] [PubMed] [Google Scholar]
- Kuo AD, Zajac FE. Human standing posture: multi-joint movement strategies based on biomechanical constraints. Prog Brain Res. 1993;97:349–358. doi: 10.1016/s0079-6123(08)62294-3. [DOI] [PubMed] [Google Scholar]
- Macpherson JM. Strategies that simplify the control of quadrupedal stance. II. Electromyographic activity. J Neurophysiol. 1988;60:218–231. doi: 10.1152/jn.1988.60.1.218. [DOI] [PubMed] [Google Scholar]
- Macpherson JM. Changes in a postural strategy with inter-paw distance. J Neurophysiol. 1994;71:931–940. doi: 10.1152/jn.1994.71.3.931. [DOI] [PubMed] [Google Scholar]
- Nevitt MC, Cummings SR, Kidd S, Black D. Risk factors for recurrent nonsyncopal falls. A prospective study. JAMA. 1989;261:2663–2668. [PubMed] [Google Scholar]
- Selby G (1968) Parkinson’s disease. In: Vinken PJ, Bruyn GW (eds) Diseases of the basal ganglia. Handbook of clinical neurology, vol 6. North-Holland, Amsterdam, pp 173–211
- Smithson F, Morris ME, Iansek R. Performance on clinical tests of balance in Parkinson’s disease. Phys Ther. 1998;78:577–592. doi: 10.1093/ptj/78.6.577. [DOI] [PubMed] [Google Scholar]
- Szturm T, Fallang B. Effects of varying acceleration of platform translation and toes-up rotations on the pattern and magnitude of balance reactions in humans. J Vestib Res. 1998;8:381–397. [PubMed] [Google Scholar]
- Vaughan CL, Davis BL, O’Connor JC (1991) Dynamics of human gait. Human Kinetics, Champaign, Ill.
- Winter DA (1979) Biomechanics of human movement. Wiley, New York
- Winter DA, Prince F, Frank JS, Powell C, Zabjek KF. Unified theory regarding A/P and M/L balance in quiet stance. J Neurophysiol. 1996;75:2334–2343. doi: 10.1152/jn.1996.75.6.2334. [DOI] [PubMed] [Google Scholar]
- Zhang T, Wei G, Yan Z, Ding M, Li C, Ding H, Xu S. Quantitative assessment of Parkinson’s disease deficits. Chin Med J (Engl) 1999;112:812–815. [PubMed] [Google Scholar]