

Abstract
Photoreceptor differentiation requires the coordinated expression of numerous genes. It is unknown whether those genes share common regulatory mechanisms or are independently regulated by distinct mechanisms. To distinguish between these scenarios, we have used in situ hybridization, RT-PCR and real time PCR to analyze the expression of visual pigments and other photoreceptor-specific genes during chick embryo retinal development in ovo, as well as in retinal cell cultures treated with molecules that regulate the expression of particular visual pigments. In ovo, onset of gene expression was asynchronous, becoming detectable at the time of photoreceptor generation (ED 5–8) for some photoreceptor genes, but only around the time of outer segment formation (ED 14–16) for others. Treatment of retinal cell cultures with activin, staurosporine or CNTF selectively induced or down-regulated specific visual pigment genes, but many cognate rod- or cone-specific genes were not affected by the treatments. These results indicate that many photoreceptor genes are independently regulated during development, are consistent with the existence of at least two distinct stages of gene expression during photoreceptor differentiation, suggest that intrinsic, coordinated regulation of a cascade of gene expression triggered by a commitment to the photoreceptor fate is not a general mechanism of photoreceptor differentiation, and imply that using a single photoreceptor-specific “marker” as a proxy to identify photoreceptor cell fate is problematic.
Keywords: photoreceptor, differentiation, chick embryo, visual pigments, cell culture, growth factors
INTRODUCTION
Retinal cell differentiation is still incompletely understood, despite recent progress in the identification of transcription factors and extracellular signaling molecules involved in its regulation (Jean et al., 1998; Cepko, 1999; Seigel, 1999; Adler, 2000; Lupo et al., 2000; Galli-Resta, 2001; Vetter and Brown, 2001; Marquardt and Gruss, 2002; Zhang et al., 2002; Hatakeyama and Kageyama, 2004; Malicki, 2004). It has been proposed that proliferating retinal progenitor cells are multipotential, becoming restricted to a specific lineage only after undergoing terminal mitosis (Adler and Hatlee, 1989; Belecky-Adams et al., 1996; Cepko, 1999). Analysis of this hypothesis has been predominantly phenomenological, through experiments testing whether populations of retinal progenitor cells change their developmental fate under different microenvironmental conditions. These studies have led to the categorization of progenitor cells as ‘multipotent”, “restricted”, or “committed”, but molecular descriptions of these hypothetical cell states and/or their underlying inductive event(s) are still lacking. Experiments addressing these issues are frequently confounded by the use, as markers of progenitor cell commitment, of molecules expressed during the terminal differentiation of the cells. Such use would only be justified in cases in which the entire process of cell differentiation is controlled cell-autonomously by intrinsic mechanisms set in motion at the time of progenitor cell commitment to a particular lineage, but would not be warranted if many separate inductive events are necessary before a committed progenitor can reach terminal differentiation (Adler, 2005).
Several unique properties of retinal photoreceptor cells make them particularly suitable for the investigation of these questions. Photoreceptor differentiation, for example, can be evaluated by assessing the development of characteristic structural properties (e.g., an elongated, compartmentalized cell body, an outer segment, complex ribbon-containing synaptic terminals, and structural and molecular polarity), and the expression of many photoreceptor-specific genes (e.g., those encoding visual pigments and other members of the phototransduction cascade, outer segment structural proteins, and transporters and binding proteins involved in retinoid metabolism; Nathans, 1987; Adler, 2000; Hargrave, 2001; Gonzalez-Fernandez, 2002; Parsons and Sterling, 2003; Palczewski et al., 2004. Photoreceptor subtypes (rods and several types of cones) can be distinguished based on further structural and molecular criteria.
There is some evidence suggestive of both cell-autonomous and non cell-autonomous mechanisms in photoreceptor differentiation. We have hypothesized that many of its aspects are controlled by a cell-intrinsic “master plan”, which retinal progenitors acquire shortly after terminal mitosis and express autonomously (Adler, 2000). Supportive evidence was derived from isolation experiments, in which chick embryo retinal progenitor cells were dissociated before the onset of overt differentiation, and cultured at low densities that minimized contact-mediated intercellular interactions. Under these conditions, some progenitor cells developed as non-photoreceptor (predominantly amacrine) neurons, while others differentiated as photoreceptors (Adler et al., 1984; Belecky-Adams et al., 1996). The relative frequency of photoreceptors and non-photoreceptor neurons was developmental stage-dependent, with photoreceptors being more abundant when cells were isolated from younger embryos (Adler and Hatlee, 1989; Belecky-Adams et al., 1996). Photoreceptor progenitors underwent a series of complex morphogenetic changes even in the absence of contacts with other cells, including elongation, development of structural and molecular polarity, and formation of a small outer segment process and a short axon (Madreperla and Adler, 1989; Madreperla et al., 1989; Saga et al., 1996). Structural differentiation was accompanied by molecular differentiation, e.g., expression of visinin and of the red cone pigment by 100% and 50% of the photoreceptors, respectively (Adler et al., 2001), and by functional differentiation, e.g., photomechanical responses to light (Stenkamp and Adler, 1993; Stenkamp et al., 1994).
A role for cell-intrinsic mechanisms in the regulation of early aspects of photoreceptor differentiation was also suggested by the patterns of photoreceptor gene expression observed in vivo during retinal development in the ferret (Johnson et al., 2001) as well as in other species (Cook and Desplan, 2001). However, inductive signals from the microenvironment appeared necessary for later events, including the expression of genes which became detectable around the time of outer segment formation (see Discussion). The possible existence of independent regulatory mechanisms for different photoreceptor genes, however, has not been experimentally tested. Towards this goal, we have now used in situ hybridization, RT-PCR and real time PCR to investigate the expression of visual pigments and several other photoreceptor-specific genes, both during normal chick embryo development in vivo and in retinal cells cultured under different experiment conditions. These results indicate that many photoreceptor genes are independently regulated during development, suggesting that expression of a visual pigment gene cannot be considered by itself an indication that photoreceptors have already acquired the complex molecular machinery necessary for their visual function. The results are also consistent with the existence of at least two distinct stages of gene expression during photoreceptor differentiation, and raise some concerns about the use of molecules expressed during terminal differentiation (a late event) as indicators of the commitment of retinal progenitor cells to the photoreceptor lineage (a much earlier event).
METHODS
Materials
Reagents were purchased from the following suppliers: Roche Molecular Biochemicals (previously known as Boehringer Mannheim; Indianapolis, IN): T1 RNAse, alkaline phosphatase (AP)-labeled anti-digoxigenin antibody, horseradish peroxidase (HRP)-labeled anti-digoxigenin antibody, HRP-labeled anti-fluorescein antibody, blocking reagents, 5-bromo-4-chloro-3-indolyl-phosphate (BCIP), DNAse I, 4-nitroblue tetrazolium chloride (NBT), T7 and T3 polymerases, nylon membranes, digoxigenin-labeled nucleotide (NTP) mix, LightCycler FastStart DNA MasterPlusSYBR Green 1 kit, Dig-labeled Control RNA, bovine serum albumin. Gibco BRL (Bethesda, MD): formamide, proteinase K, yeast tRNA. Sigma (St. Louis, MO): staurosporine, DMSO, sucrose, heparin, 3-[(3-cholamidopropyl) dimethylammonio]-1-propanesulfonate (CHAPS), EDTA, saponin, ahydride, maleic acid, paraformaldehyde, Triton X-100, Tween 20, triethanolamine HCl, polyornithine, linoleic acid, phenol-chloroform, ethidium bromide. VectorLabs (Burlingame, CA): DAPI-containing Vectashield. Invitrogen (Carlsbad, CA): Trizol, RNase A, DNAse, Superscript II, Recombinant Taq Polymerase, SP6 polymerase, oligo(dT), random primers, 10mM dNTP, PCR enhancer. Perkin Elmer Life Sciences (Shelton, CT): cyanine-3 fluorophore tyramide amplification reaction, fluorescein fluorophore tyramide amplification. Hyclone Laboratories (Logan, UT): Fetal Bovine Serum. B&E Eggs (Stevens, PA): White Leghorn Chicken embryos. JT Baker (Phillipsburg, NJ): Hydrogen Peroxide, NaCl, sodium citrate. Sakura Finetek U.S.A, Inc (Torrance, CA): OCT Medium. Fisher Scientific (Newark, DE): Superfrost Slides. R and D Systems (Minneapolis, MN): CNTF. Activin was a generous gift from Dr. Yuzuro Eto (Ajinomoto Co. Inc, Suzuki-cho, Kawasaki, Japan).
Dissociated Retinal Cultures
Embryonic day (ED) 6 dissociated retinal cell cultures were prepared as described (Adler, 1990; Saga et al., 1996). Experimental or control solutions were applied to the cultures in 20 μl aliquots, 3 hours after seeding. A staurosporine solution in DMSO was delivered to achieve a final concentration of 50 nM. Activin (diluted in medium 199 with 2% fetal calf serum) was delivered to a final concentration of 100 ng/ml. CNTF was delivered in medium 199 containing 0.1% bovine serum albumin, to a final concentration of 20 ng/ml. Unsupplemented vehicle aliquots were used as controls. After four days in culture at 37°C in 5% CO2 in air, cells were either fixed in 4% paraformaldehyde in phosphate buffered saline (PBS) for 30 minutes, or lysed for RNA isolation and cDNA synthesis (see below).
In Situ Hybridization using Chromogenic Detection
Tissue Sections: Chick embryos were studied on ED 4, 5, 8, 12, 15, 16, 17, and 18. Whole heads (ED 4–8) or embryonic eyes (ED 12–18) were collected in RNase-free Hanks Balanced Salt Solution, fixed at 4°C in 4% paraformaldehyde, incubated in an increasing concentration series of sucrose in PBS, and embedded in a 1:2 mixture of OCT™ and 20% sucrose in 0.1 M phosphate buffer, pH 7.4. Cryosections were processed for in situ hybridization with digoxigenin-labeled RNA probes as described (Belecky-Adams et al., 1997). Hybridization was detected with the Digoxigenin Nucleic Acid Detection kit according to the manufacturer’s instructions.
Cultured Cells
Paraformaldehyde-fixed cultures were washed twice in PBS, permeated for 15 min with 3% Triton X in PBS at 37°C, washed in PBS, incubated for 1 hour at room temperature in 0.1 M saponin/10 mM EDTA in PBS, postfixed for 5 min in 4% paraformaldehyde in PBS, washed in PBS, and acylated with 2 ml of 0.1 M triethylalmine (pH 8.0) and 15 μl acetic acid. After rinses in 70% and 95% ethanol, pre-hybridization, hybridization and post-hybridization treatments were as described above.
Fluorescence Detection for Single- and Double-label In Situ Hybridization
Digoxigenin-labeled probes were used for single-labeling experiments. Pre-hybridization, hybridization and stringency washes were as described above. The samples were then incubated for 30 min in 2% blocking solution, followed by 30 min in 2% blocking solution containing horseradish peroxidase (HRP)-labeled anti-digoxigenin antibody, three washes with Boeheringer’s buffer 1, incubation with the cyanine-3 fluorophore tyramide amplification reaction for 5 min as recommended by the manufacturer, and 3 washes in buffer 1.
A digoxigenin-labeled probe and a fluorescein-labeled probe were used for double-labeling in situ hybridization. The digoxigenin-labeled probe was detected as described above, and the sample was then incubated for 40 min in a 0.3% hydrogen peroxide solution in buffer 1, to quench HRP from the first reaction. The samples were then washed 3X in PBS for 15 min, incubated for 30 min in 2% blocking solution followed by 30 min in 2% blocking solution containing HRP-labeled anti-fluorescein antibody, and processed for fluorescein tyramide amplification reaction as described by the manufacturer. Quenching efficiency was evaluated in parallel control samples by carrying out the fluorescein tyramide amplification reaction without previous incubation in HRP-labeled anti-fluorescein antibody. In all cases, samples were coverslipped with DAPI-containing Vectashield.
RNA Isolation and cDNA Synthesis
Cultured cells were lysed by adding 1 ml of Trizol reagent; the same Trizol aliquot was transferred from one dish to the next (for up to 10 dishes). For in ovo studies, eyes were collected in RNase-free Hanks’ and their retinas dissected free from other eye tissues, including the pigment epithelium, frozen in liquid nitrogen, and stored at −70°C until homogenized in Trizol reagent for RNA isolation. Total RNA was isolated according to manufacturer’s instructions, including a DNAse treatment to eliminate contaminating DNA. cDNA was synthesized with Superscript II using both oligo(dT) and random primers, and purified by phenol-chloroform extraction and ethanol precipitation.
Polymerase Chain Reaction
In addition to visinin and the visual pigment genes (Adler et al., 2001), the following gallus gallus sequences were used: interphotoreceptor retinoid-binding protein (IRBP; ACCESSION AF121968); α subunit of cone photoreceptor CNG-channel (ACCESSION NM_205221); α subunit of rod photoreceptor CNG-channel (ACCESSION NM_205220); cone-type transducin α subunit (ACCESSION AF200339); cone cGMP phosphodiesterase α’-subunit (ACCESSION L29233); photoreceptor outer segment membrane glycoprotein (“peripherin”; ACCESSION NM_205038); guanylate cyclase activating protein 1 (GCAP 1; ACCESSION AF172707); phosphodiesterase 6 beta subunit (β-PDE; ACCESSION AY226460); cDNA similar to cone arrestin (“cone arrestin”; ACCESSION AI438139); gallus gallus sequence similar to bovine retinal rod rhodopsin-sensitive cGMP 3′5′-cyclic phosphodiesterase δ subunit (“δ PDE”; ACCESSION BM427028); transducin γ (cDNA clone from chick retinal cDNA library, highly homologous to canine, bovine and mouse γ transducin; unpublished); cDNA clone similar to mRNA for rod transducin β subunit (“β transducin”; ACCESSION BG625695). Oligonucleotides were designed using the Primer3 program to generate 200–600 base pair products with minimal hairpin or loop formation (see Table 1). Reactions were carried out with an initial denaturation step of 1 min at 94°C, 30 cycles of 45 sec at 94°C, 1 min at 57°C, 1 min at 72°C, and a final 5 min elongation step at 72°C. Amplification products were separated by agarose gel electrophoresis and visualized by ethidium bromide staining. Identity of the initial amplification products was verified by sequencing.
TABLE 1.
OLIGONUCLEOTIDE SEQUENCES USED FOR RT-PCR AND REAL TIME PCR
| L27 Ribosomal protein |
| Forward: AGCAATGGGCAAGAAGAAGA |
| Reverse: GCAGCTTCTGGAAGAACCAC |
| GAPDH |
| Forward: CCATTCCTCCACCTTTGATG |
| Reverse: GGAACAGAACTGGCCTCTCA |
| PDE β |
| Forward: GAGGCATCACCTGGATTTTG |
| Reverse: GGTAATCAGTCCAGGCAGTTG |
| PDE δ |
| Forward: TCCACAAACACTTGGCAGTC |
| Reverse: AGCTCCAAAAAGCCCCATC |
| GCAP |
| Forward: GGTCGCACGTTCTTTGATTT |
| Reverse: TACTGACATTGCGACCGTTG |
| IRBP |
| Forward: TCCTCATCTCTGCAAAATACCA |
| Reverse: CGCTTCACACAAAATGCTGTA |
| Transducin α |
| Forward: CTGCAGCTCCACATCACTGT |
| Reverse: TACGAGGTACGGGGCATTTA |
| Transducin α |
| Forward: CGTTCACGGACAGCACATAG |
| Reverse: CTTGGCTCTGGTGATCTGCT |
| Transducin γ |
| Forward: CGCATCTGAAGTAGCAGCAG |
| Reverse: CCTACCCGTGCCATTAAAGC |
| Cone cGMP-activated Channel/ α subunit |
| Forward: TGCCAGAGTAGAAACCAGAGTG |
| Reverse: CCCAAATGATGGACCAAATC |
| Rod GMP-activated Channel-α subunit |
| Forward: TGCTGCACAACAGAAACTGA |
| Reverse: TCTTTCCTAAACCTGCCAAA |
| Arrestin |
| Forward: GTACTCCGGGTCGATGAGG |
| Reverse: TGGCACCTGACTTACAATGG |
| Peripherin |
| Forward: GAC CCC ACT AGG ACT TTC AAT ACT T |
| Reverse: AAG AAT ACA GCA GGA AAT ACC ACT G |
| PDEα |
| Forward: GGAGGTCAGAGATGACTCCTG |
| Reverse: TGGGAAACTGTGGATTCCTT |
| Violet |
| Forward: GAGGTGTCCTCCGTGTCCT |
| Reverse: TTGTTTGCTGCGTACGAACT |
| Blue |
| Forward: GCTATGGCGGCCTTTATGTTCCTC |
| Reverse: TGCCACTTGTTGTCCGTCGTGTA |
| Red |
| Forward: CTCCTCCGTCTCCAACTCCT |
| Reverse: GGACGAAACGAAGCCTTTTA |
| Green |
| Forward: CAAGAGCATGGGAAGGGGGAAAGA |
| Reverse: CCGAGGAGAGGGGGACGCTAACA |
| Visinin |
| Forward: GGAGATCATCACGGCCATCTTC |
| Reverse: GCATAATGGCGTCGTTCTTCATCA |
| Rhodopsin |
| Forward: AGAAACTCCGGACGCCTCTAAACT |
| Reverse: GTACCGTGACCAGCCGAACA |
Real Time Polymerase Chain Reaction
Quantitative analysis of PCR products (QPCR) was done with the LightCycler FastStart DNA MasterPlusSYBR Green 1 kit and the Roche Lightcycler 2.0 PCR instrument. PCR mix containing 4 μl of 5X Master Mix, 2 μl of 0.5 μM primers, and 12 μl H2O was dispensed into LightCycler capillaries in a pre-cooled, custom-designed centrifuge adaptor (Roche Biochemicals). Two μl of each cDNA sample was added to its respective capillary tube, sealed with a stopper, and centrifuged at 700 x g (3000 rpm) for 10 seconds. Duplicate samples were measured at 1:1 (400 ng/μl), 1:2 (200 ng/μl) and 1:4 (100 ng/μl) dilutions. Amplification included 45 cycles of 10 sec at 95°C, 10 sec at 55 °C and 5 sec at 72 °C, with a temperature transition rate of 20 °C/sec. Each QPCR assay reaction also included amplification of two “housekeeping genes” (L27 ribosomal protein and GAPDH) from each cDNA reaction. The PCR reaction quality and specificity were verified by melting-curve dissociation analysis and gel electrophoresis of the amplified product. For quantification, a standard curve was generated from the cDNA template. Relative transcript levels of each gene were calculated using the second derivative maximum values from the linear regression of cycle number versus log concentration of the amplified gene. Results for the experimental genes were normalized based on the average of L27 and GAPDH results for each sample. Primer sequences are included in Table 1.
Qualitative and Quantitative Analysis of the Cultures
Microscopic analysis was done by an investigator who was masked regarding the identity of each sample. Cultures processed by in situ hybridization with chromogenic detection were analyzed by visual inspection. Total cell numbers were determined by counting cells in 10 fields under bright field 40 X magnification. Cell types were identified as described (Adler, 1993) and scored as positive or negative. In situ hybridization specimens processed for fluorescent detection were analyzed using Image J, available from NIH (http://rsb.info.nih.gov/ij). Images were collected in the blue channel (to determine total number of cells by DAPI staining of their nuclei), and in the red and/or green channels for signals generated by the fluorescent probes. Replicate dishes processed for in situ hybridization with a visinin probe were used to determine the number of photoreceptor cells in these cultures (Adler et al., 2001).
Statistical Analysis
Results are means of triplicate dishes from at least two experiments, +/− standard deviation. Significance of the differences between experimental and controls samples was evaluated with the one-tailed Student’s t test.
RESULTS
Expression of Photoreceptor Genes is Asynchronous During Retinal Development in ovo
Analysis by the polymerase chain reaction
The possibility that photoreceptor-specific genes may share common regulatory mechanisms was suggested by their similar temporal patterns of expression in bovine retinas (DesJardin et al., 1993; Timmers et al., 1993; van Ginkel and Hauswirth, 1994); however, a marked asynchrony in onset of photoreceptor gene expression has been documented in great detail in the ferret (Johnson et al., 2001). We therefore decided to examine in detail the temporal patterns of expression of photoreceptor genes in the chick embryo. We examined genes expressed in both rods and cones (IRBP, peripherin, visinin, GCAP 1), only in rods (rhodopsin, β transducin, β-PDE, “δ PDE, rod channel), and only in cones (the blue, green, red and violet visual pigments; cone channel, transducin α, PDE α, cone arrestin, transducin γ). The primers used for PCR are shown in Table 1. As shown in Fig. 1, a broad range in the time of onset of expression of photoreceptor- specific genes was observed with the polymerase chain reaction. Several genes were first detected on ED 15 (e.g., the green cone pigment and rhodopsin) or even somewhat later (e.g., rod channel, arrestin, blue cone pigment). In contrast, other genes were already detectable on ED 5–6, when photoreceptors are still being generated. This early group included IRBP, visinin, PDEα, transducin α, β and γ, cone channel, and PDE δ. A third group of genes, including GCAP and peripherin, was first detectable at intermediate stages (ED 8–12).
Figure 1.

Temporal patterns of expression of photoreceptor genes, investigated by the polymerase chain reaction. Chick embryo retinas were dissected on the embryonic days (ED) shown in the figure, and processed for RT-PCR for 17 photoreceptor-specific genes. The onset of gene expression was detected as early as ED 5 for some genes (IRBP, visinin, PDEα, transducin α, β and γ, cone channel, and PDE δ), whereas others only became detectable at or after ED 15 (e.g., the green cone pigment, rhodopsin, rod channel, arrestin, blue cone pigment). GCAP and peripherin were first detectable at intermediate stages (ED 8–12).
Analysis by in situ hybridization
Asynchrony in the expression of photoreceptor-specific genes was also observed by in situ hybridization (Fig. 2). Light hybridization signals were observed throughout the retinal neuroepithelium as early as ED 4 for visinin (Fig. 2A) and ED 5 for IRBP (Fig. 2 E). In both cases, the signals were stronger at ED 8 (Fig. 2 B,F), and appeared restricted to the photoreceptor layer by ED 12 (Fig. 2 C,G). In contrast to these early genes, transducin γ remained undetectable until ED 15 (Fig. 2 I-L), whereas arrestin (Fig. 2 N-P) and peripherin (Fig. 2 R-T) were negative until ED 16. These later stages correlated in general with the onset of visual pigment expression (Bruhn and Cepko, 1996) and outer segment formation (Grun, 1982). The expression domains of the late genes were already restricted to the photoreceptor layer when the signals first became detectable (Fig. 2 I, N, R); they were also quite widespread across the retina at that time (not shown), in contrast to the situation with visual pigments, whose initial expression domains are fairly restricted (Bruhn and Cepko, 1996).
FIGURE 2.
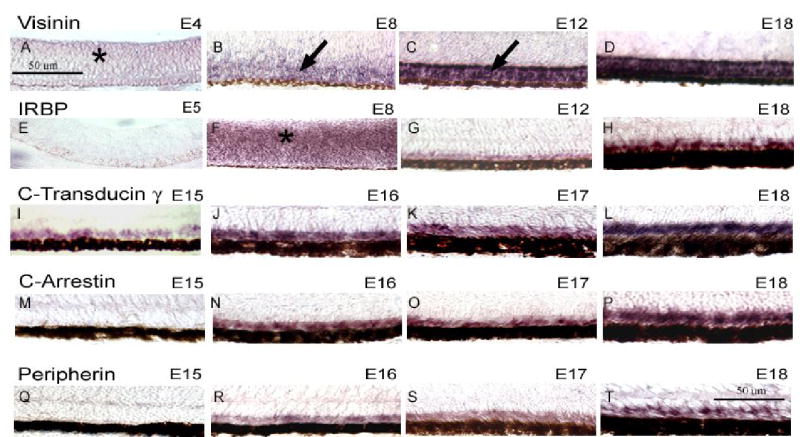
In situ hybridization analysis of the expression patterns of photoreceptor-specific genes in the chick embryo retina. Chick embryo retinas were fixed and sectioned at various stages between embryonic day (ED) 4 and 18, and processed for in situ hybridization with probes against visinin (A–D), IRBP (E–H), transducin γ(I–L), cone arrestin (M–P) and peripherin (Q–T). Retinas are oriented with the RPE down. Visinin was already diffusely detectable on ED 4 (A), and by ED 8 was still expressed not only in the future outer nuclear layer (arrow) but also more vitreally. By ED 12 the signal became very strong and restricted to the ONL, where it remained thereafter (D). IRBP followed a similar expression pattern, with signal being very light on ED 5 (D) and much stronger but still diffuse (asterisk) by ED 8 (E). The signal became restricted to the outer nuclear layer at later stages (C,D). Other photoreceptor genes were not detectable until ED 15 (transducin γ, I) or ED 16 (arrestin, N; peripherin, R). These gene products were localized to the photoreceptor layer at all the stages studied.
Experimental Modulation of Photoreceptor Gene Expression in vitro
The evidence described above is consistent with the independent regulation of the expression of various photoreceptor-specific genes, but is only circumstantial in nature. We therefore decided to investigate the issue more directly, taking advantage of previous studies showing that three regulatory molecules have very specific inductive or inhibitory effects on visual pigment expression in cultured chick embryo photoreceptor cells. These agents are activin, which inhibits the expression of the red cone pigment, iodopsin (Belecky-Adams et al., 1999); CNTF, which upregulates the expression of the green cone pigment (Xie and Adler, 2000), and staurosporine, which induces rhodopsin expression and down-regulates expression of the red cone pigment (Xie and Adler, 2000). These effects made it possible to test experimentally whether other photoreceptor-specific genes are co-regulated with their cognate visual pigment.
The baseline for these experiments were cultures carried out under “control” conditions, in which as many as 60% of the photoreceptors (identifiable by morphological criteria and visinin immunostaining) showed hybridization signals with red cone pigment probes after 4 days in vitro (Figs. 3, 4). Green cone pigment mRNA was occasionally detectable by in situ hybridization in 2–6% of the photoreceptors, with signals of variable intensity (Fig. 3). As illustrated below, PCR analysis of control cultures showed strong bands for visinin, IRBP, transducin γ, GCAP and peripherin, and lighter bands for transducin β, arrestin, PDE α and δ, and transducin α; rhodopsin, the blue and violet cone pigments, the rod channel and PDE β were undetectable.
Figure 3.

In situ hybridization analysis of gene expression in dissociated retinal cell cultures, grown in control medium or in medium supplemented with activin, CNTF or staurosporine (see Methods). After 4 days in vitro, the cultures were processed for fluorescent in situ hybridization with probes for the red cone pigment (“red”), the green cone pigment (green), rhodopsin (rhod), or the calcium-binding protein visinin. Quantitative analysis of these cultures is presented in Figs. 4, 6 and 8. The red cone pigment was expressed in many of the photoreceptors in control cultures (A) and CNTF-treated cultures (C), but was inhibited almost completely by activin (B) and completely by staurosporine (D). The green cone pigment was occasionally detected in control cultures (E) or in cultures treated with activin (F), but was extensively upregulated by CNTF (G) and suppressed by staurosporine (H). Rhodopsin was undetectable by in situ hybridization (as well as by PCR) in control cultures (I) or in cultures treated with activin and CNTF (not shown). However, rhodopsin(+) photoreceptors were very abundant in cultures treated with staurosporine (J). The calcium-binding protein visinin was extensively expressed by photoreceptors under all culture conditions (K–N).
Figure 4.
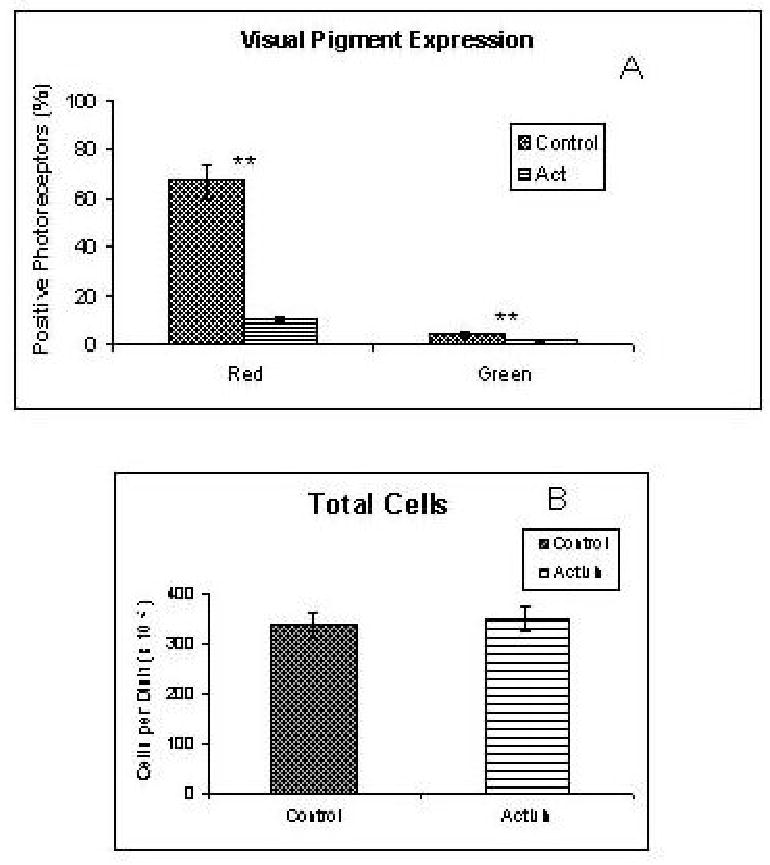
In situ hybridization analysis of activin effects on cultured retinal cells. See text for detail. A) Activin caused a marked decrease in the number of photoreceptors positive for the red cone pigment. Green cone pigment(+) photoreceptors were fairly scarce, both in control and activin-treated cultures. One hundred percent of the photoreceptors appeared visinin (+) under all conditions. B) The total number of cells in these cultures was unchanged. **: p<0.001
Effects of activin
In situ hybridization analysis showed the almost complete disappearance of red(+) and green(+) cells from activin-treated cultures (Figs. 3, 4). One hundred percent of the photoreceptors appeared visinin(+) in all cases. Analysis by RT-PCR showed that rhodopsin and the blue and violet cone pigments remained negative in activin-treated cultures, and confirmed the disappearance of the green visual pigment (Fig. 5). A band for the red visual pigment product was very faint in some experiments (Fig. 5) and completely undetectable in others (not shown). Other cone genes were downregulated in parallel to the red and green cone pigments. For example, RT-PCR bands were much lighter or even undetectable for transducin α, β and γ, and peripherin (Fig. 5). These results suggest that activin effects on cone gene expression are rather general. However, QPCR showed only moderate decreases in visinin and GCAP mRNAs, with activin: control ratios of 1: 2.5 (Table 2) . The cone channel values, moreover, were practically identical under both conditions (Table 2).
Figure 5.

Patterns of gene expression in activin-treated and control cultures, analyzed by RT-PCR. Conspicuous changes included the disappearance of a band for the green cone pigment, and a marked decrease in the intensity of the red cone pigment band; transducin α, β and γ and peripherin were undetectable or much lighter in activin-treated cultures. Rhodopsin and the blue and violet cone pigments were undetectable in both cases. See Table 2 for real time PCR analysis.
TABLE 2.
REAL TIME PCR (QPCR) ANALYSIS OF mRNA LEVELS FOR PHOTORECEPTOR-SPECIFIC GENES
| Activin/control | Staurosporine/control | CNTF/control | |
|---|---|---|---|
| Cone channel | 1.0 / 1.2 | ND | ND |
| GCAP | 1.0 / 2.2 | 1.0 / 142 | 1.3 / 1.0 |
| Visinin | 1.0 / 2.5 | 1.9 / 1.0 | 1.4 / 1.0 |
| R-PDE β | ND | 1.8 / 1.0 | 1.3 / 1.0 |
| Peripherin | ND | 2.1 / 1.0 | 2.0 / 1.0 |
| Red cone pigment | ND | 1.0 / 13.7 | 1.2 / 1.0 |
| Rhodopsin | ND | 1784.3 / 1.0 | ND |
| Green cone pigment | ND | ND | 14.2 / 1.0 |
| C-PDE α | ND | ND | 1.0 / 1.3 |
Activin-, staurosporine- and CNTF-treated cultures were compared with their respective controls to determine their effects on mRNA levels for the indicated genes. Genes were selected for QPCR analysis based on qualitative observations by RT-PCR (see Figs. 5, 7, 9). QPCR reactions were carried out at three dilutions from duplicate samples, and normalized relative to the average values for two housekeeping genes, L27 ribosomal protein and GAPDH, as described in Methods. QPCR values were generally consistent with observations made by RT-PCR, although in some cases differences observed by QPCR were not detectable by RT-PCR, probably because the latter was carried out under saturating conditions.
Effects of staurosporine
As shown in Figs. 3, 6 and 7, treatment with staurosporine, a protein kinase inhibitor, had very dramatic effects on visual pigment expression in the cultures. Staurosporine-treated cultures had similar cell numbers as compared to controls (Fig. 6), but showed no photoreceptors positive for the red or green visual pigments (Figs. 3, 6). On the other hand, approximately 80% of the photoreceptors in staurosporine-treated cultures had strong hybridization signals for rhodopsin, the rod visual pigment, which was undetectable in controls (Figs. 3, 5). Rhodopsin induction was also confirmed by RT-PCR (Fig. 7), and by QPCR, which showed 1784-fold stimulation (Table 2). It is particularly noteworthy that this induction of rhodopsin expression was not accompanied by equivalent changes in other rod-specific genes. For example, no PCR products for either the rod channel or rod PDE β were observed in extracts of staurosporine-treated cultures (Fig. 7) using primers and conditions that showed strong bands in positive controls (not shown). With the more sensitive QPCR assay, a small (1.8-fold) induction of rod PDE β was observed (Table 2), which was minimal in comparison with rhodopsin induction.
Figure 6.
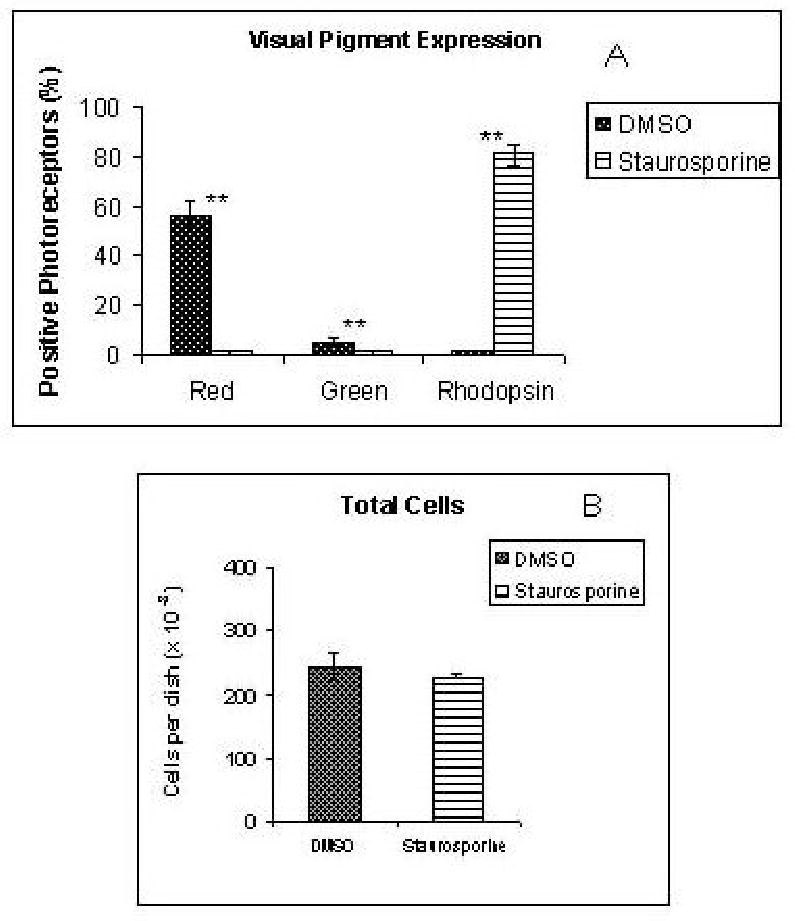
A) In situ hybridization analysis of the expression of visual pigment expression in staurosporine-treated and control cultures, prepared as described in Methods. Staurosporine caused complete disappearance of cells positive for the red and green cone pigments, as well as marked induction of rhodopsin(+) photoreceptors. B) The total number of cells was similar in control and treated cultures. **: p<0.001
Figure 7.

Patterns of gene expression in staurosporine-treated and control cultures analyzed by RT-PCR. Staurosporine caused the disappearance of green and red PCR products, and the appearance of a rhodopsin band. Blue and violet remained undetectable. Rhodopsin induction was not accompanied by equivalent changes in the rod channel and rod PDE β. Decreases in red and green cone pigments were accompanied by the loss of cone arrestin and by apparent decreases in the intensity of products for other genes such as GCAP and C-transducin α. Other genes, such as the cone channel and IRBP, appeared unchanged by RT-PCR (see Table 2 for real time PCR analysis).
A lack of correlation between cone visual pigments and their cognate genes was also observed. In agreement with the in situ hybridization data, RT-PCR also showed the absence of detectable mRNA for the green and red cone pigments (Fig. 7); the decrease in red mRNA levels was 14-fold as measured by QPCR (Table 2). These changes in cone pigment expression were accompanied by parallel changes in some, but not all the cone genes studied. Thus, RT-PCR (Fig. 7) showed the loss of cone arrestin, and conspicuously lighter bands for PDE α and transducin α, but there were no obvious changes in the bands for the cone channel, or for genes expressed in both cones and rods, such as visinin, IRBP and peripherin. Some of these mRNAs were further analyzed by QPCR (Table 2), which actually showed 2-fold increases in both peripherin and visinin in staurosporine-treated cultures. Another gene expressed in both rods and cones, GCAP, showed a very weak band by RT-PCR (Fig. 6), reflecting a 142-fold decrease as measured by QPCR (Table 2). The staurosporine experiments, in summary, showed lack of gene co-regulation in both rods and cones; this applied to inhibitory as well as to inductive effects.
Effects of ciliary neurotrophic factor (CNTF)
A very interesting pattern of gene expression changes was observed in cultures treated with CNTF. The frequency of photoreceptors positive for the red cone pigment by in situ hybridization was similar in CNTF-treated and control cultures (Fig. 3, 8). On the other hand, nearly 60% of the photoreceptors were positive for the green cone pigment in CNTF-treated cultures, representing a 10-fold increase over controls (Figs. 3, 8). The remaining visual pigments (blue, violet and rhodopsin) remained absent from CNTF-treated cultures (Fig. 9). QPCR analysis showed a 14-fold increase in green pigment mRNA in CNTF-treated cultures (Table 2). In contrast, the CNTF: control ratios for other cone genes were 1: 1.2 for the red cone pigment, 1: 1.3 for GCAP and visinin, and 1: 0.8 for PDE α (Table 2). The data, therefore, appear to indicate that the up-regulation of the green cone pigment gene was quite specific, and was not accompanied by an equivalent up-regulation of other photoreceptor-specific genes.
Figure 8.
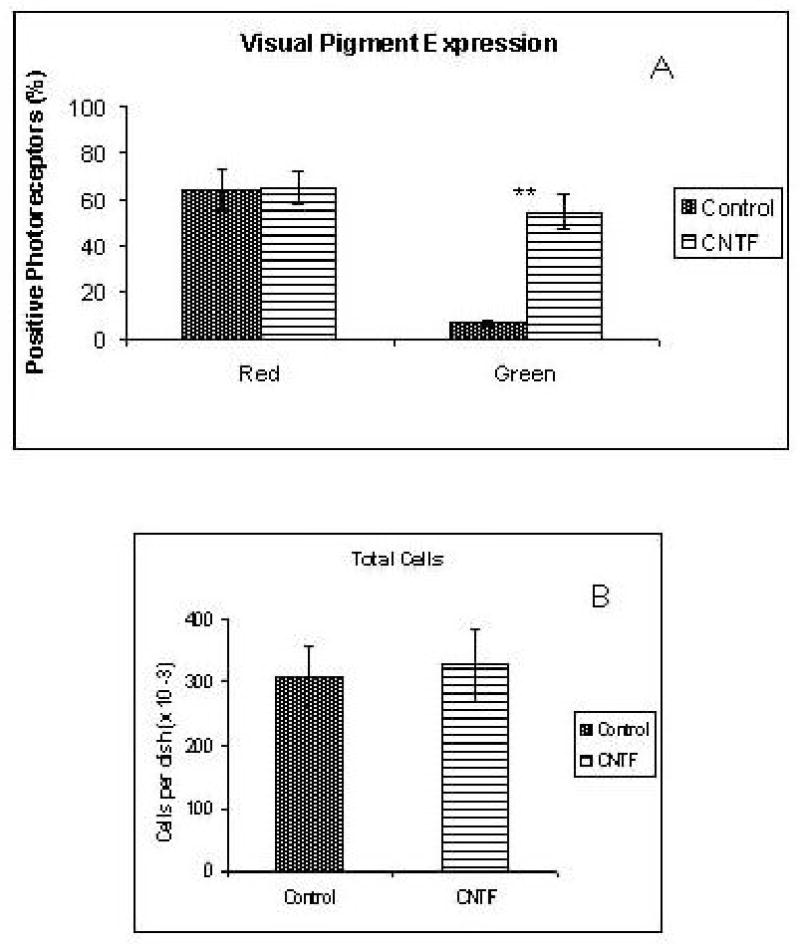
A) In situ hybridization analysis of visual pigment expression in CNTF-treated and control cultures. CNTF caused a marked increase in the number of photoreceptors positive for the green cone pigment, without detectable changes in the frequency of red(+) photoreceptors. B) The number of cells in the cultures was unchanged. **: p<0.001
Figure 9.

Patterns of photoreceptor gene expression in CNTF-treated and control cultures, analyzed by RT-PCR. The PCR products for red and green appear of similar intensity in control and treated cultures in these reactions, run under saturating conditions, but a marked induction of green expression was observed by real time PCR (Table 2) and by in situ hybridization (Figs. 3, 8). Blue, violet, rhodopsin and the rod channel remained undetectable in all cases. The cone PDE β product observed in control cultures was not detectable in CNTF-treated cultures, but no other striking differences were observed by RT-PCR. See Table 2 for real time PCR analysis.
Co-expression of red and green cone pigments within individual photoreceptors
The possible co-expression of red and green pigments in individual photoreceptors was suggested by the relative frequency of cells positive with the individual probes, which totaled more than 100% of the photoreceptors. This possibility was investigated by double-labeling in situ hybridization combining a digoxigenin-labeled and a fluorescein-labeled probe (see Methods). No double-labeled photoreceptors were observed in control cultures (not shown). On the other hand, CNTF-treated cultures not only contained photoreceptors that had either red or green signals, but also showed a substantial number of photoreceptors that appeared double-labeled, with bright hybridization signals for both red and green mRNAs (Fig.10). Quantitative analysis showed that 25% of photoreceptors were double-labeled in CNTF-treated cultures. We used a similar technique to investigate whether double-labeled photoreceptors could be seen during normal retinal development in ovo. As shown in Fig. 10, ED 18 retinas showed a clear separation of the visual pigment mRNAs, with cells expressing either green or red. Similar observations were made on ED 16 and 17 (data not shown).
Figure 10.

Double-labeling in situ hybridization analysis of co-expression of the red and green cone pigment mRNAs in CNTF-treated cells in culture (A–C) and in vivo (D–F). Co-expression was never seen in control cultures (not shown), but was readily detectable in CNTF-treated cultures. Three photoreceptors are shown in the figure that express both iodopsin (panel A) and the green cone pigment (panel B); the overlay of the signals is shown in panel C. Sections of ED 18 retinas showed abundant photoreceptors positive for iodopsin (D) or for the green cone pigment (E), but no double-labeled photoreceptors were detected (F).
DISCUSSION
The key findings of this study were as follows. 1) Onset of expression of visual pigments and other photoreceptor-specific genes was asynchronous during chick retinal development. 2) In situ hybridization signals for several photoreceptor-specific genes (including peripherin, transducin and arrestin) first became detectable around ED 14–16, correlating with the onset of visual pigment expression (Bruhn and Cepko, 1996) and outer segment formation (Grun, 1982). 3) Hybridization signals for other gene products became detectable as early as ED 5–8, when photoreceptors are being generated and/or are still morphologically undifferentiated. 4) Asynchronous onset of gene expression was also observed with a more sensitive technique, the polymerase chain reaction (PCR). 5) The only two visual pigments observed in retinal cell cultures under control conditions were the red cone pigment, detectable by in situ hybridization in 60% of the isolated progenitor cells that differentiated as photoreceptors, and the green cone pigment, consistently detected by PCR, and occasionally also by in situ hybridization in 2–6% of the photoreceptors. 6) Treatment of the cultures with either activin or staurosporine inhibited the expression of red and green cone pigment genes; their effects were quite different, however, because staurosporine concomitantly induced rhodopsin expression, but activin did not. 7) CNTF markedly up-regulated expression of the green cone pigment gene, without detectable effects on any of the remaining visual pigments. 8) As many as 25% of the photoreceptors treated with CNTF showed co-expression of mRNAs for the red and green cone pigments; pigment co-expression was not observed during retinal development in vivo or in control cultures. 9) Many photoreceptor genes failed to mimic the expression changes shown by their cognate visual pigments in response to treatment.
Gene expression patterns observed during retinal development suggested that photoreceptor-specific genes may share common regulatory mechanisms (DesJardin et al., 1993; van Ginkel and Hauswirth, 1994). This notion was supported by the finding that transcription factors, such as the cone rod homeobox (Crx), the neural retina leucine zipper (Nrl), NR2E3, and NR1D1 can transactivate multiple photoreceptor-specific promoters (Chen et al., 1997; Cheng et al., 2004; Freund et al., 1997; Kumar et al., 1996; Lerner et al., 2001; Livesey et al., 2000; Rehemtulla et al., 1996). However, the present results, together with data from the literature, indicate that co-regulation of gene expression is not a general phenomenon during photoreceptor differentiation. For example, considerable asynchrony in the onset of expression of photoreceptor-specific genes has been observed within each one of the vertebrate species that have been analyzed so far (Bruhn and Cepko, 1996; Stenkamp et al., 1997; Johnson et al., 2001). At least two main periods of onset of expression have been recognized. Early genes are first expressed at, or shortly after the time of photoreceptor birth, preceding outer segment formation by many days, or even weeks. Examples, analyzed by in situ hybridization and/or immunocytochemistry, include IRPB and visinin in the chick [this report; see also (Bruhn and Cepko, 1996)], IRPB in the goldfish (Stenkamp et al., 1997), arrestin, rhodopsin and recoverin in the ferret (Johnson et al., 2001), and rhodopsin in Xenopus (Saha and Grainger, 1993).
Several lines of evidence suggest that this early phase of photoreceptor differentiation is regulated by cell-intrinsic mechanisms. Early genes are expressed in the ferret as the photoreceptors are being generated, for example, suggesting that they are controlled by intracellular determinants rather than by diffusible signals (Johnson et al., 2001). It has been similarly suggested that the expression of one visual pigment may represent a “default” state, with distinct “acquired” photoreceptor states developing upon receiving additional extrinsic and/or intrinsic signals (Cook and Desplan, 2001). Consistent with this suggestion are our findings that undifferentiated progenitor cells isolated from ED 5–8 chick embryo retinae can express cell autonomously not only the visual pigment iodopsin (Adler et al., 2001), but also a complex array of photoreceptor-specific phenotypic properties, including formation of inner and outer segments, structural and molecular polarity, and photomechanical responses [(Adler, 2000); see Introduction]. As discussed below, however, this developmental program appears to control only initial aspects of photoreceptor differentiation.
Late genes only become detectable many days (Cepko, 1996) or even several weeks after photoreceptors are born (Bumsted et al., 1997), and the onset of their expression correlates approximately with the onset of outer segment formation. This late group includes β- and γ-transducin, cGMP phosphodiesterase, phosducin, rhodopsin kinase, rod cGMP-gated cation channel, peripherin and short- and medium-wavelength cone opsins in the ferret (Johnson et al., 2001), and visual pigments, arrestin, transducin γ, and peripherin in the chick [(Bruhn and Cepko, 1996), and this report]. This evidence, although circumstantial, appears inconsistent with the hypothesis that photoreceptor-specific genes are globally co-regulated.
Our cell culture experiments provide direct evidence indicative of lack of co-regulation of photoreceptor genes by the same molecular mechanisms. Rhodopsin, for example, is not detectable in control cultures, even by RT-PCR, but becomes readily detectable by in situ hybridization in 80% of the photoreceptors in staurosporine-treated cultures. This strong inductive effect is not accompanied by detectable changes in other rod-specific genes, such as PDE β or the cGMP-activated rod cation channel. Similarly, a variety of cone genes remain unchanged when the red and green cone pigment genes are inhibited by staurosporine, and/or when the green cone pigment gene is upregulated by CNTF treatment. Activin treatment does have a more generalized inhibitory effect on cone-specific genes, but even in this case there are exceptions, such as the cGMP-activated cone channel. A practical implication of these findings is that expression of a visual pigment gene cannot be considered by itself an indication that photoreceptors have already acquired the complex molecular machinery necessary for their visual function.
The apparent differences between regulatory mechanisms controlling early and late aspects of photoreceptor differentiation raise some concerns about the use of molecules expressed during terminal differentiation (a late event) as indicators of the commitment of retinal progenitor cells to the photoreceptor lineage (a much earlier event). This may in fact explain some of the controversies regarding the specific role of signaling molecules in the control of photoreceptor development. Thus, increases in rhodopsin immunoreactive cells in rat retinal cultures treated with 9-cis retinoic acid were initially interpreted to show that retinoic acid directs progenitor cells to the photoreceptor fate (Kelley et al., 1994). However, other studies subsequently found no evidence of a fate switch, and showed that retinoic acid acts by shortening the maximum time between terminal mitosis and detectable rhodopsin expression (Wallace and Jensen, 1999). Similarly, while there is consensus that CNTF causes a decrease in the number of rhodopsin(+) cells in rat retinal cultures, there is considerable controversy regarding the interpretation of these results. Thus, these effects have been described as a re-specification of cells destined to become rods (Ezzeddine et al., 1997), arrested differentiation of cells already committed to the rod fate (Neophytou et al., 1997), or a transient and reversible down-regulation of rhodopsin expression (Schulz-Key et al., 2002). The ambiguity between cell fate determination and modulation of the expression of markers of terminal differentiation also remains unresolved for other factors that regulate photoreceptor development, such as taurine (Altshuler et al., 1993), ligands of steroid/thyroid receptors (Kelley et al., 1995), and sonic hedgehog (Levine et al., 1997).
The CNTF-induced co-expression of red and green cone pigments within individual photoreceptors was an unexpected finding. Although the detailed analysis of this phenomenon is beyond the scope of this paper, it deserves some consideration as an indicator of the susceptibility of differentiating photoreceptors to the action of extracellular regulatory molecules. The “one cone/one visual pigment” rule appears to be valid for most cones in most animal species so far studied (Nathans, 1999), but exceptions to this rule have been found. Co-expression of medium- and short-wavelength pigments in mouse cones, for example, was discovered by Rohlich et al., (1994), and further characterized by others (Lyubarsky et al., 1999; Applebury et al., 2000). Other examples have been described in mammals (Glosmann and Ahnelt, 2002; Lukats et al., 2002; Parry and Bowmaker, 2002), including human fetuses (Xiao and Hendrickson, 2000), as well as in salamander (Makino and Dodd, 1996), eel (Hope et al., 1998), and butterflies (Kitamoto et al., 1998). To the best of our knowledge, however, visual pigment co-expression has not been reported in adult or even embryonic birds, and our studies with the green and red pigments also failed to find co-expression in ovo. Against this background, it is relevant that a substantial fraction of chick embryo photoreceptors showed the capacity to co-express these two pigments in vitro in response to CNTF treatment. While these results could be disregarded as “in vitro artifacts”, they nevertheless imply that the activation of the transcription of one visual pigment gene (e. g., red) does not automatically result in the repression of another visual pigment gene (e.g., green).
In summary, while it is theoretically possible that the entire process of photoreceptor differentiation is regulated by a cascade of cell-intrinsic mechanisms set in motion when retinal progenitor cells are induced to the photoreceptor fate, our results, taken together with the literature summarized above, argue against this possibility. It is our working hypothesis that cell autonomous mechanisms regulate only some (early) aspects of photoreceptor differentiation, and that many of the genes necessary for their terminal differentiation are independently regulated by separate signaling molecules, many of which are still unknown.
Acknowledgments
This work was supported by NIH grants EYO4859 (RA), EY 09769 (DJZ), and Core Grant EY1765, a center grant from the Foundation Fighting Blindness (Baltimore, MD), a grant from the Macula Vision Foundation, an unrestricted departmental grant from Research to Prevent Blindness, Inc. (New York, NY), and by funds from Mr. and Mrs. Robert and Clarice Smith. RA is the Arnall Patz Distinguished Professor of Ophthalmology, and a senior investigator of Research to Prevent Blindness, Inc. DJZ is the Guerrieri Professor of Genetic Engineering and Molecular Ophthalmology.
References
- Adler, R. Preparation, enrichment and growth of purified cultures of neurons and photoreceptors from chick embryos and from normal and mutant mice. In: Conn, P. M., (Ed.) Methods in Neurosciences, Vol. II, Orlando, Academic Press, 1990, pp. 134–150.
- Adler R. Determination of cellular types in the retina. Invest Ophthalmol Vis Sci. 1993;34:1677–1682. [PubMed] [Google Scholar]
- Adler R. A model of retinal cell differentiation in the chick embryo. Prog Ret Eye Res. 2000;20:529–557. doi: 10.1016/s1350-9462(00)00008-2. [DOI] [PubMed] [Google Scholar]
- Adler, R., 2005. Challenges in the study of neuronal differentiation: a view from the embryonic eye. Dev Dyn, in press. [DOI] [PMC free article] [PubMed]
- Adler R, Hatlee M. Plasticity and differentiation of embryonic retinal cells after terminal mitosis. Science. 1989;243:391–393. doi: 10.1126/science.2911751. [DOI] [PubMed] [Google Scholar]
- Adler R, Lindsey JD, Elsner CL. Expression of cone-like properties by chick embryo neural retina cells in glial-free monolayer cultures. J Cell Biol. 1984;99:1173–1178. doi: 10.1083/jcb.99.3.1173. [DOI] [PMC free article] [PubMed] [Google Scholar]
- Adler R, Tamres A, Bradford RL, Belecky-Adams TL. Microenvironmental regulation of visual pigment expression in the chick retina. Dev Biol. 2001;15:454–464. doi: 10.1006/dbio.2001.0331. [DOI] [PubMed] [Google Scholar]
- Altshuler D, Lo Turco JJ, Rush J, Cepko C. Taurine promotes the differentiation of a vertebrate retinal cell type in vitro. Development. 1993;119:1317–1328. doi: 10.1242/dev.119.4.1317. [DOI] [PubMed] [Google Scholar]
- Applebury ML, Antoch MP, Baxter LC, Chun LL, Falk JD, Farhangfar F, Kage K, Krzystolik MG, Lyass LA, Robbins JT. The murine cone photoreceptor: a single cone type expresses both S and M opsins with retinal spatial patterning. Neuron. 2000;27:513–523. doi: 10.1016/s0896-6273(00)00062-3. [DOI] [PubMed] [Google Scholar]
- Belecky-Adams T, Cook B, Adler R. Correlations between terminal mitosis and differentiated fate of retinal precursor cells in vivo and in vitro: analysis with the “window-labeling” technique. Dev Biol. 1996;178:304–315. doi: 10.1006/dbio.1996.0220. [DOI] [PubMed] [Google Scholar]
- Belecky-Adams T, Tomarev S, Li HS, Ploder L, McInnes RR, Sundin O, Adler R. Pax-6, Prox 1, and Chx10 homeobox gene expression correlates with phenotypic fate of retinal precursor cells. Invest Ophthalmol Vis Sci. 1997;38:1293–1303. [PubMed] [Google Scholar]
- Belecky-Adams TL, Scheurer D, Adler R. Activin family members in the developing chick retina: expression patterns, protein distribution, and in vitro effects. Dev Biol. 1999;210:107–123. doi: 10.1006/dbio.1999.9268. [DOI] [PubMed] [Google Scholar]
- Bruhn SL, Cepko CL. Development of the pattern of photoreceptors in the chick retina. J Neurosci. 1996;16:1430–1439. doi: 10.1523/JNEUROSCI.16-04-01430.1996. [DOI] [PMC free article] [PubMed] [Google Scholar]
- Bumsted K, Jasoni C, Szel A, Hendrickson A. Spatial and temporal expression of cone opsins during monkey retinal development. J Comp Neurol. 1997;378:117–134. [PubMed] [Google Scholar]
- Cepko CL. The patterning and onset of opsin expression in vertebrate retinae. Curr Opin Neurobiol. 1996;6:542–546. doi: 10.1016/s0959-4388(96)80062-6. [DOI] [PubMed] [Google Scholar]
- Cepko CL. The roles of intrinsic and extrinsic cues and bHLH genes in the determination of retinal cell fates. Curr Opin Neurobiol. 1999;9:37–46. doi: 10.1016/s0959-4388(99)80005-1. [DOI] [PubMed] [Google Scholar]
- Chen S, Wang QL, Nie Z, Sun H, Lennon G, Copeland NG, Gilbert DJ, Jenkins NA, Zack DJ. Crx, a novel Otx-like paired-homeodomain protein, binds to and transactivates photoreceptor cell-specific genes. Neuron. 1997;19:1017–1030. doi: 10.1016/s0896-6273(00)80394-3. [DOI] [PubMed] [Google Scholar]
- Cheng H, Khanna H, Oh EC, Hicks D, Mitton KP, Swaroop A. Photoreceptor-specific nuclear receptor NR2E3 functions as a transcriptional activator in rod photoreceptors. Hum Mol Genet. 2004;13:1563–1575. doi: 10.1093/hmg/ddh173. [DOI] [PubMed] [Google Scholar]
- Cook T, Desplan C. Photoreceptor subtype specification: from flies to humans. Semin Cell Dev Biol. 2001;12:509–518. doi: 10.1006/scdb.2001.0275. [DOI] [PubMed] [Google Scholar]
- DesJardin LE, Timmers AM, Hauswirth WW. Transcription of photoreceptor genes during fetal retinal development. Evidence for positive and negative regulation. J Biol Chem. 1993;268:6953–6960. [PubMed] [Google Scholar]
- Ezzeddine ZD, Yang X, DeChiara T, Yancopoulos G, Cepko CL. Postmitotic cells fated to become rod photoreceptors can be respecified by CNTF treatment of the retina. Development. 1997;124:1055–1067. doi: 10.1242/dev.124.5.1055. [DOI] [PubMed] [Google Scholar]
- Freund CL, Gregory-Evans CY, Furukawa T, Papaioannou M, Looser J, Ploder L, Bellingham J, Ng D, Herbrick JA, Duncan A, Scherer SW, Tsui LC, Loutradis-Anagnostou A, Jacobson SG, Cepko CL, Bhattacharya SS, McInnes RR. Cone-rod dystrophy due to mutations in a novel photoreceptor-specific homeobox gene (CRX) essential for maintenance of the photoreceptor. Cell. 1997;91:543–553. doi: 10.1016/s0092-8674(00)80440-7. [DOI] [PubMed] [Google Scholar]
- Galli-Resta L. Assembling the vertebrate retina: global patterning from short-range cellular interactions. Neuroreport. 2001;12:A103–106. doi: 10.1097/00001756-200112040-00003. [DOI] [PubMed] [Google Scholar]
- Glosmann M, Ahnelt PK. A mouse-like retinal cone phenotype in the Syrian hamster: S opsin coexpressed with M opsin in a common cone photoreceptor. Brain Res. 2002;929:139–146. doi: 10.1016/s0006-8993(02)02267-9. [DOI] [PubMed] [Google Scholar]
- Gonzalez-Fernandez F. Evolution of the visual cycle: the role of retinoid-binding proteins. J Endocrinol. 2002;175:75–88. doi: 10.1677/joe.0.1750075. [DOI] [PubMed] [Google Scholar]
- Grun G. The development of the vertebrate retina: a comparative survey. Adv Anat Embryol Cell Biol. 1982;78:1–85. [PubMed] [Google Scholar]
- Hargrave PA. Rhodopsin structure, function, and topography. The Friedenwald lecture Invest Ophthalmol Vis Sci. 2001;42:3–9. [PubMed] [Google Scholar]
- Hatakeyama J, Kageyama R. Retinal cell fate determination and bHLH factors. Semin Cell Dev Biol. 2004;15:83–89. doi: 10.1016/j.semcdb.2003.09.005. [DOI] [PubMed] [Google Scholar]
- Hope AJ, Partridge JC, Hayes PK. Switch in rod opsin gene expression in the European eel, Anguilla anguilla (L.) Proc R Soc Lond B Biol Sci. 1998;265:869–874. doi: 10.1098/rspb.1998.0372. [DOI] [PMC free article] [PubMed] [Google Scholar]
- Jean D, Ewan K, Gruss P. Molecular regulators involved in vertebrate eye development. Mech Dev. 1998;76:3–18. doi: 10.1016/s0925-4773(98)00117-8. [DOI] [PubMed] [Google Scholar]
- Johnson PT, Williams RR, Reese BE. Developmental patterns of protein expression in photoreceptors implicate distinct environmental versus cell-intrinsic mechanisms. Vis Neurosci. 2001;18:157–168. doi: 10.1017/s0952523801181150. [DOI] [PubMed] [Google Scholar]
- Kelley MW, Turner JK, Reh TA. Retinoic acid promotes differentiation of photoreceptors in vitro. Development. 1994;120:2091–2102. doi: 10.1242/dev.120.8.2091. [DOI] [PubMed] [Google Scholar]
- Kelley MW, Turner JK, Reh TA. Ligands of steroid/thyroid receptors induce cone photoreceptors in vertebrate retina. Development. 1995;121:3777–3785. doi: 10.1242/dev.121.11.3777. [DOI] [PubMed] [Google Scholar]
- Kitamoto J, Sakamoto K, Ozaki K, Mishina Y, Arikawa K. Two visual pigments in a single photoreceptor cell: identification and histological localization of three mRNAs encoding visual pigment opsins in the retina of the butterfly Papilio xuthus. J Exp Biol. 1998;201 ( Pt 9):1255–1261. doi: 10.1242/jeb.201.9.1255. [DOI] [PubMed] [Google Scholar]
- Kumar R, Chen S, Scheurer D, Wang QL, Duh E, Sung CH, Rehemtulla A, Swaroop A, Adler R, Zack DJ. The bZIP transcription factor Nrl stimulates rhodopsin promoter activity in primary retinal cell cultures. J Biol Chem. 1996;271:29612–29618. doi: 10.1074/jbc.271.47.29612. [DOI] [PubMed] [Google Scholar]
- Lerner LE, Gribanova YE, Ji M, Knox BE, Farber DB. Nrl and Sp nuclear proteins mediate transcription of rod-specific cGMP-phosphodiesterase beta-subunit gene: involvement of multiple response elements. J Biol Chem. 2001;276:34999–35007. doi: 10.1074/jbc.M103301200. [DOI] [PubMed] [Google Scholar]
- Levine EM, Roelink H, Turner J, Reh TA. Sonic hedgehog promotes rod photoreceptor differentiation in mammalian retinal cells in vitro. J Neurosci. 1997;17:6277–6288. doi: 10.1523/JNEUROSCI.17-16-06277.1997. [DOI] [PMC free article] [PubMed] [Google Scholar]
- Livesey FJ, Furukawa T, Steffen MA, Church GM, C L, Cepko Microarray analysis of the transcriptional network controlled by the photoreceptor homeobox gene Crx. Curr Biol. 2000;10:301–310. doi: 10.1016/s0960-9822(00)00379-1. [DOI] [PubMed] [Google Scholar]
- Lukats A, Dkhissi-Benyahya O, Szepessy Z, Rohlich P, Vigh B, Bennett NC, Cooper HM, Szel A. Visual pigment coexpression in all cones of two rodents, the Siberian hamster and the pouched mouse. Invest Ophthalmol Vis Sci. 2002;43:2468–2473. [PubMed] [Google Scholar]
- Lupo G, Andreazzoli M, Gestri G, Liu Y, He RQ, Barsacchi G. Homeobox genes in the genetic control of eye development. Int J Dev Biol. 2000;44:627–636. [PubMed] [Google Scholar]
- Lyubarsky AL, Falsini B, Pennesi ME, Valentini P, Pugh EN., Jr UV- and midwave-sensitive cone-driven retinal responses of the mouse: a possible phenotype for coexpression of cone photopigments. J Neurosci. 1999;19:442–455. doi: 10.1523/JNEUROSCI.19-01-00442.1999. [DOI] [PMC free article] [PubMed] [Google Scholar]
- Madreperla SA, Adler R. Opposing microtubule- and actin-dependent forces in the development and maintenance of structural polarity in retinal photoreceptors. Dev Biol. 1989;131:149–160. doi: 10.1016/s0012-1606(89)80046-6. [DOI] [PubMed] [Google Scholar]
- Madreperla SA, Edidin M, Adler R. Na+,K+-adenosine triphosphatase polarity in retinal photoreceptors: a role for cytoskeletal attachments. J Cell Biol. 1989;109:1483–1493. doi: 10.1083/jcb.109.4.1483. [DOI] [PMC free article] [PubMed] [Google Scholar]
- Makino CL, Dodd RL. Multiple visual pigments in a photoreceptor of the salamander retina. J Gen Physiol. 1996;108:27–34. doi: 10.1085/jgp.108.1.27. [DOI] [PMC free article] [PubMed] [Google Scholar]
- Malicki J. Cell fate decisions and patterning in the vertebrate retina: the importance of timing, asymmetry, polarity and waves. Curr Opin Neurobiol. 2004;14:15–21. doi: 10.1016/j.conb.2004.01.015. [DOI] [PubMed] [Google Scholar]
- Marquardt T, Gruss P. Generating neuronal diversity in the retina: one for nearly all. Trends Neurosci. 2002;25:32–38. doi: 10.1016/s0166-2236(00)02028-2. [DOI] [PubMed] [Google Scholar]
- Nathans J. Molecular biology of visual pigments. Annu Rev Neuroscsci. 1987;10:163–194. doi: 10.1146/annurev.ne.10.030187.001115. [DOI] [PubMed] [Google Scholar]
- Nathans J. The evolution and physiology of human color vision: insights from molecular genetic studies of visual pigments. Neuron. 1999;24:299–312. doi: 10.1016/s0896-6273(00)80845-4. [DOI] [PubMed] [Google Scholar]
- Neophytou C, Vernallis AB, Smith A, Raff MC. Muller-cell-derived leukaemia inhibitory factor arrests rod photoreceptor differentiation at a postmitotic pre-rod stage of development. Development. 1997;124:2345–2354. doi: 10.1242/dev.124.12.2345. [DOI] [PubMed] [Google Scholar]
- Palczewski K, Sokal I, Baehr W. Guanylate cyclase-activating proteins: structure, function, and diversity. Biochem Biophys Res Commun. 2004;322:1123–1130. doi: 10.1016/j.bbrc.2004.07.122. [DOI] [PubMed] [Google Scholar]
- Parry JW, Bowmaker JK. Visual pigment coexpression in Guinea pig cones: a microspectrophotometric study. Invest Ophthalmol Vis Sci. 2002;43:1662–1665. [PubMed] [Google Scholar]
- Parsons TD, Sterling P. Synaptic ribbon. Conveyor belt or safety belt? Neuron. 2003;37:379–382. doi: 10.1016/s0896-6273(03)00062-x. [DOI] [PubMed] [Google Scholar]
- Rehemtulla A, Warwar R, Kumar R, Ji X, Zack DJ, Swaroop A. The basic motif-leucine zipper transcription factor Nrl can positively regulate rhodopsin gene expression. Proc Natl Acad Sci USA. 1996;93:191–195. doi: 10.1073/pnas.93.1.191. [DOI] [PMC free article] [PubMed] [Google Scholar]
- Rohlich P, van Veen T, Szel A. Two different visual pigments in one retinal cone cell. Neuron. 1994;13:1159–1166. doi: 10.1016/0896-6273(94)90053-1. [DOI] [PubMed] [Google Scholar]
- Saga T, Scheurer D, Adler R. Development and maintenance of outer segments by isolated chick embryo photoreceptor cells in culture. Invest Ophthalmol Vis Sci. 1996;37:561–573. [PubMed] [Google Scholar]
- Saha MS, Grainger RM. Early opsin expression in Xenopus embryos precedes photoreceptor differentiation. Brain Res Mol Brain Res. 1993;17:307–318. doi: 10.1016/0169-328x(93)90016-i. [DOI] [PubMed] [Google Scholar]
- Schulz-Key S, Hofmann HD, Beisenherz-Huss C, Barbisch C, Kirsch M. Ciliary neurotrophic factor as a transient negative regulator of rod development in rat retina. Invest Ophthalmol Vis Sci. 2002;43:3099–3108. [PubMed] [Google Scholar]
- Seigel GM. The golden age of retinal cell culture. Mol Vis. 1999;5:4. [PubMed] [Google Scholar]
- Stenkamp DL, Adler R. Photoreceptor differentiation of isolated retinal precursor cells includes the capacity for photomechanical responses. Proc Natl Acad Sci U S A. 1993;90:1982–1986. doi: 10.1073/pnas.90.5.1982. [DOI] [PMC free article] [PubMed] [Google Scholar]
- Stenkamp DL, Barthel LK, Raymond PA. Spatiotemporal coordination of rod and cone photoreceptor differentiation in goldfish retina. J Comp Neurol. 1997;382:272–284. doi: 10.1002/(sici)1096-9861(19970602)382:2<272::aid-cne10>3.0.co;2-u. [DOI] [PubMed] [Google Scholar]
- Stenkamp DL, Iuvone PM, Adler R. Photomechanical movements of cultured embryonic photoreceptors: regulation by exogenous neuromodulators and by a regulable source of endogenous dopamine. J Neurosci. 1994;14:3083–3096. doi: 10.1523/JNEUROSCI.14-05-03083.1994. [DOI] [PMC free article] [PubMed] [Google Scholar]
- Timmers AM, Newton BR, Hauswirth WW. Synthesis and stability of retinal photoreceptor mRNAs are coordinately regulated during bovine fetal development. Exp Eye Res. 1993;56:257–265. doi: 10.1006/exer.1993.1034. [DOI] [PubMed] [Google Scholar]
- van Ginkel PR, Hauswirth WW. Parallel regulation of fetal gene expression in different photoreceptor cell types. J Biol Chem. 1994;269:4986–4992. [PubMed] [Google Scholar]
- Vetter ML, Brown NL. The role of basic helix-loop-helix genes in vertebrate retinogenesis. Semin Cell Dev Biol. 2001;12:491–498. doi: 10.1006/scdb.2001.0273. [DOI] [PubMed] [Google Scholar]
- Wallace VA, Jensen AM. IBMX, taurine and 9-cis retinoic acid all act to accelerate rhodopsin expression in postmitotic cells. Exp Eye Res. 1999;69:617–627. doi: 10.1006/exer.1999.0741. [DOI] [PubMed] [Google Scholar]
- Xiao M, Hendrickson A. Spatial and temporal expression of short, long/medium, or both opsins in human fetal cones. J Comp Neurol. 2000;425:545–559. [PubMed] [Google Scholar]
- Xie HQ, Adler R. Green cone opsin and rhodopsin regulation by CNTF and staurosporine in cultured chick photoreceptors. Invest Ophthalmol Vis Sci. 2000;41:4317–4323. [PubMed] [Google Scholar]
- Zhang SS, Fu XY, Barnstable CJ. Molecular aspects of vertebrate retinal development. Mol Neurobiol. 2002;26:137–152. doi: 10.1385/MN:26:2-3:137. [DOI] [PubMed] [Google Scholar]