

Abstract
Current hierarchical models of the cerebral cortex are mainly based on qualitative connection studies. From wheatgerm-agglutinin-horseradish peroxidase injections, we examined the laminar patterns of projections to and between the three major subdivisions of the motion-processing lateral suprasylvian (LS) complex [areas posteromedial lateral suprasylvian area (PMLS), anteromedial lateral suprasylvian (AMLS), posterolateral lateral suprasylvian area (PLLS)] of cat extrastriate cortex and of an adjoining form-processing area, 21a. We counted ~ 145,000 labelled projection cells in 20 cortical areas in 11 cats, and applied various analyses to the data, expressed as the percent supragranular layer (%SG) origin of each connection. We report two main results. (i) A wide range of %SG values was obtained, both from each individual cat and across the 163 projections examined. Nonetheless, both hierarchical and non-parametric cluster analyses of the pooled connection origins suggested the presence of three distinct laminar projection classes, constrained by graded %SG values of 0–33%, 39–69% and 76–97%. These conformed, respectively, to feedback, lateral and feedforward laminar patterns seen qualitatively in our material. (ii) Hierarchical connectivity analyses suggested that PMLS, AMLS and PLLS are ordered in a hierarchical sequence. Macaque motion areas V5/MT, MST and FST are arranged in a similar sequence, and areas at equivalent levels of the two motion hierarchies have some analogous functional specializations. Our findings provide the first objective support for the three laminar projection classes that underpin existing theoretical models of hierarchical cortical organization, and they suggest that the implementation of higher-order motion processing evolved along similar lines in the cat and monkey visual cortex.
Keywords: cluster analyses, feedforward-feedback, hierarchical models, lateral suprasylvian, wheatgerm-agglutinin-horseradish peroxidase
Abbreviations: AChE, acetylcholine; AES, anterior ectosylvian sulcus; AEV, anterior ectosylvian visual area; AMLS, anteromedial lateral suprasylvian area; AP, anteroposterior; ER, entorhinal; FB, feedback; FF, feedforward; FST: floor of superior temporal sulcus area; HCA, hierarchical cluster analysis; Ins, insular; IT, inferotemporal; L, lateral; LS, lateral suprasylvian; MDS, multidimensional scaling; MSS, middle suprasylvian sulcus; MST, medial superior temporal area; MT, middle temporal area; NPCA, non-parametric cluster analysis; pCG, posterior cingulate gyrus; PLLS, posterolateral lateral suprasylvian area; PMLS, posteromedial lateral suprasylvian area; PP, posterior parietal; PS, posterior suprasylvian area; PSG, posterior suprasylvian gyrus; %SG, percentage supragranular; STS, superior temporal sulcus; STSa, anterior (polysensory) superior temporal sulcus area; SVA, splenial visual area; TMB, tetramethylbenzidine; VLS, ventrolateral suprasylvian area; WGA-HRP, wheatgerm-agglutinin-horseradish peroxidase
Introduction
A major challenge in systems neuroscience is to understand how information is disseminated among the multiple, functionally specialized areas of the cerebral cortex. One widely influential idea (Felleman & Van Essen, 1991), originating from anatomical studies of the visual cortex (Rockland & Pandya, 1979), is that the direction of information trafficking can be determined from three classes of laminar projections existing between different cortical areas. In this model, ‘feedforward’ (FF) projections are sent predominantly from supragranular layer neurons to higher areas engaged in more complex functions, with complementary ‘feedback’ (FB) projections to lower processing areas coming mainly from infragranular cells. A third ‘lateral’ (L) pattern of roughly equal supragranular and infragranular layer origins signifies integration between areas at equivalent processing stages – but having different functional specializations – as in connections between the colour (V4) and motion [V5/middle temporal area (MT)] areas of monkey visual cortex.
These reciprocal FF–FB and L–L patterns have been used in both informal (Felleman & Van Essen, 1991) and computational (Hilgetag et al., 1996, 2000a) meta-analyses of laminar connectivity databases to construct information-processing hierarchies of the cat and macaque visual cortex. Although differing in detail, the hierarchies possess the same fundamental logic: information flows forward, and in parallel, from the primary occipital areas (17/V1, 18/V2), via several specialized extrastriate areas, to more distant areas in inferotemporal and posterior parietal cortex. However, in very few of the original studies compiled for these databases were laminar projection origins quantified, and some that did disputed the existence of any distinct classes. Of particular relevance, Symonds & Rosenquist (1984b) undertook cell counts of the laminar origins of projections to 15 areas of cat visual cortex and found them to be highly variable and non-categorical. While a problem with this study was that the tracing techniques available produced relatively low numbers of labelled cells (< 100) in many areas evaluated, more recent quantitative analyses of monkey cortex employing improved labelling techniques also suggested that laminar projections form a gradual continuum in their proportions of supragranular-to-infragranular layer cells (Barone et al., 2000; Vezoli et al., 2004).
In previous quantitative studies (Shipp & Grant, 1991; Hilgetag & Grant, 2000), we showed that area 17 has dense FF–FB connections with the two medial areas [posteromedial lateral suprasylvian area (PMLS), anteromedial lateral suprasylvian (AMLS)] of the motion-processing complex in cat extrastriate cortex (Fig. 1; Payne, 1993; Lomber, 2001). Here we have extended this approach by quantifying the laminar origins of projections from all visual cortical areas to each major lateral suprasylvian (LS) subdivision and by employing different cluster analyses to determine whether the data can be grouped objectively into distinct classes. Finally, motivated both by disagreements about connectional relations within the LS complex (Felleman & Van Essen, 1991; Hilgetag et al., 2000a) and by indications that it may be homologous to the complex of motion areas located in the superior temporal sulcus (STS) of macaques (Zeki, 1974; Payne, 1993), we applied computational hierarchical analyses to our data on local LS connectivity to determine whether it resembles the known processing sequence in the monkey STS.
Fig. 1.
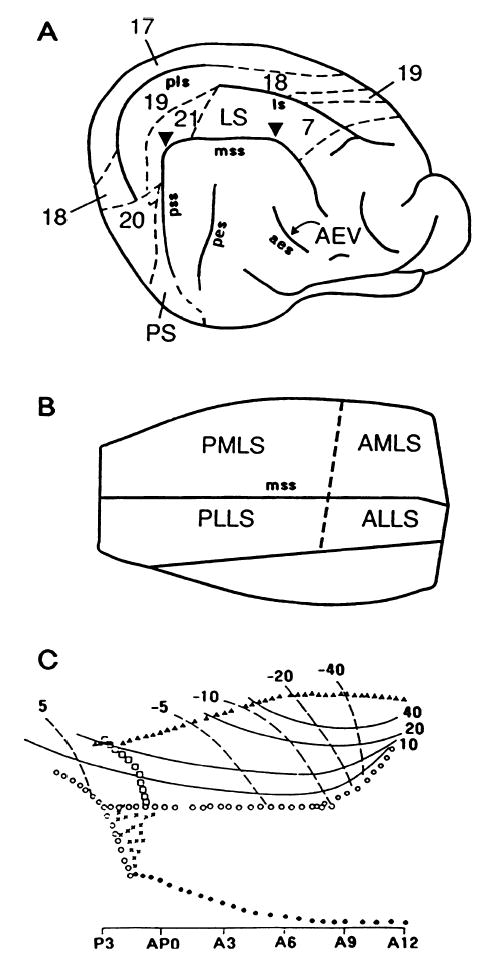
(A) Lateral surface view of the right cerebral cortex of the cat showing the approximate locations of area 17 and several major extrastriate visual areas. The lower diagrams show flattened views of the middle suprasylvian sulcus (MSS) containing (B) the posteromedial, anteromedial, posterolateral and anterolateral subdivisions of the lateral suprasylvian complex (areas PMLS, AMLS, PLLS and ALLS, respectively) suggested by the visual field mapping experiments of Palmer et al. (1978), and (C) the visuotopic organization of the single striate-recipient projection field defined by others (Sherk, 1986a; Grant & Shipp, 1991) in LS cortex. This latter incorporates areas PMLS and AMLS, plus part of area 21a and the caudal pole of area PLLS. Caudal is to the left and lateral is uppermost in all diagrams. ALLS, anterolateral lateral suprasylvian area.
Materials and methods
This study is based upon quantitative analyses of cortical labelling in 11 adult cats: 10 with single wheatgerm-agglutinin-horseradish peroxidase (WGA-HRP) injections in different regions of LS cortex, and one with a similar injection in area 21a, which adjoins PMLS caudally (Fig. 1) and shows specialization for aspects of form vision (Dreher et al., 1996). We included this extra case as a partial check that the data obtained from the LS complex might apply to a non-motion area of cat visual cortex. All procedures were conducted in accordance with the ethical guidelines of the UK Animals (Scientific Procedures) Act of 1986. Detailed methods of tissue injection and processing have been described elsewhere (Grant & Shipp, 1991). In brief, WGA-HRP injections were carried out under combined ketamine (30 mg/kg) and acepromazine maleate (0.3 mg/kg)/Rompun (5 mg/kg) anaesthesia, and the animals were killed 2–3 days later by intravenous injection of sodium pentobarbital (100 mg/kg). Injected brains were serially sectioned in the coronal plane at 60 μm thickness, and every cortical section from the occipital pole to the anterior commissure was collected. Two sets of non-adjacent 1-in-4 sections were reacted for WGA-HRP using tetramethylbenzidine (TMB) as the chromagen; intermediate sets were Nissl stained or reacted for acetylcholinesterase (AChE) to show the cortical layers.
Distribution of label by cortical area
To examine the overall distribution of the cortical connections, camera lucida was used to make large-scale (× 40) drawings of a complete 1-in-4 set of WGA-HRP sections through each brain. The locations of labelled cells and terminals were plotted on these drawings from inspection under bright- and dark-field illumination, along with the regions of dense and lighter reaction product at the injection site. The borders of areas 17 and 18 were determined from adjoining Nissl-stained material using conventional cytoarchitectural criteria (Otsuka & Hassler, 1962) and were added to the drawings. All other areas of the cats’ visual cortex have been defined previously by electrophysiological and/or connectional mapping, and how they may correspond to the notoriously indeterminate architectural ‘borders’ of areas in this cortical territory in the cat remains unclear (e.g. Sherk, 1986a,b; Olson & Lawler, 1987). Rather than trying to define such borders, we employed an alternative strategy, used before by us (Grant & Shipp, 1991) and by various other workers (e.g. Symonds & Rosenquist, 1984a; Olson & Lawler, 1987; Scannell et al., 1995; MacNeil et al., 1997; Conway et al., 2000), to determine the location of the extrastriate labelling in our cortical material.
As previously described (Grant & Shipp, 1991), we first established the cortical sections in each brain containing specific sulci and gyri located at the following anteroposterior (AP) levels (see Fig. 1): P8, the caudal pole of the suprasylvian gyrus; P3, the posterior bend of the middle suprasylvian sulcus (MSS); A4.5, the vertical limb of the posterior ectosylvian sulcus; A10, the caudal pole of the anterior ectosylvian sulcus where it lies internal to the overlying ectosylvian gyrus; A14, the anterior bend of the MSS. We chose these particular landmarks because they are relatively evenly spaced and, in our experience, show little variability in position or configuration between individual cats. The AP level of each section located between these landmarks was then determined by interpolation. This procedure represents a form of normalization, in which our sections were fitted to the ‘standardized’ AP coordinate maps used by Tusa et al. (1981) and others (e.g. Updyke, 1986; Olson & Lawler, 1987; Grant & Shipp, 1991; MacNeil et al., 1997) to define the location and organization of extrastriate visual areas in the cat.
The location of the labelling in our material was decided mainly by reference to the comprehensive and widely utilized maps of Tusa et al. (1981), but with some alterations and additions. The main modifications involved extension of area PMLS onto the caudal pole of the lateral MSS, replacing area posterolateral lateral suprasylvian area (PLLS) in this region (see Fig. 1C), and expansion of dorsolateral suprasylvian area (DLS) more anteriorly on the posterior ectosylvian gyrus, as suggested by Updyke (1986). The additions included four areas of extrastriate cortex not examined by Tusa and colleagues. These were: posterior suprasylvian area (PS), at the base of the posterior suprasylvian gyrus (PSG), between levels P3 and AP0 (Updyke, 1986); area 7p, on the crown of the middle suprasylvian gyrus, between AP0 and A14 (Olson & Lawler, 1987); splenial visual area (SVA), occupying a thin strip of cortex medial to area 17, between P2 and A8 (Kalia & Whitteridge, 1973); and anterior ectosylvian visual area (AEV), lying internally in the ventral bank of the anterior ectosylvian sulcus (Mucke et al., 1982). We also included three ‘visuo-limbic’ regions linked to the extrastriate network (cf. Scannell et al., 1995): areas 35/36 of entorhinal (ER) cortex, anterior ectosylvian sulcus (AES) of insular (Ins) cortex (Guldin & Markowitsch, 1984; Reinoso-Suárez & Roda, 1985), and the posterior cingulate gyrus (pCG) of splenial cortex (Olson & Musil, 1992).
Insofar as there is agreement about the location of cat extrastriate visual areas, we are confident that the provenance of the WGA-HRP-labelled cells was correctly identified prior to counting them. This confidence is born of two facts. First, we were able to follow each group of labelled cells comprising a particular connection over several or many consecutive sections that invariably included AP levels definitively containing the given cortical area. Second, most of our injections sites avoided representations of the vertical meridian or extreme visual periphery in MSS cortex (Table 1), representations that often delineate the border between adjoining extrastriate areas (Tusa et al., 1981; Updyke, 1986). As a consequence, only ~ 5000 cells (< 4%) of all those counted had to be excluded from further analysis because they appeared to straddle such border regions and their location was thus uncertain. The one general exception to this relates to areas 21b and ventrolateral suprasylvian area (VLS). It is agreed that these areas occupy the banks of the PSG and contain mainly representations of the upper and lower visual quadrants, respectively (Tusa et al., 1981; Updyke, 1986). However, their precise extents are disputed, and we found the laminar distribution of cell labelling in the larger region mapped by Updyke (1986) to be consistently columnar in appearance. For these reasons, we were unable to distinguish between the two areas, and so grouped them together as ‘area 21b/VLS’ for cell counting purposes.
Table 1.
Location in MSS cortex and visuotopic involvement of injection sites
| Case | Area injected | Core spread | Core size (mm2) | AP level | Area 17 label: visuotopic involvement |
|---|---|---|---|---|---|
| Mll | 21a | PMLS | 18.8 | P4 | Upper quadrant |
| M03 | PMLS, lateral | None | 22.3 | P2 | Area centralis |
| M19 | PMLS, caudal | None | 11.3 | P1.5 | Horizontal meridian, paracentral |
| M17 | PMLS, middle | 7p | 13.1 | A2.5 | Horizontal meridian, peripheral |
| M15 | PMLS, middle | None | 16.9 | A2.75 | Horizontal meridian and below |
| M01 | PMLS/AMLS | PLLS/ALLS | 19.1 | A8.25 | Lower quadrant |
| M04 | AMLS | PMLS | 16.0 | A9.75 | Lower periphery |
| L12 | PLLS, caudal | None | 11.7 | AP0 | Area centralis |
| L21 | PLLS, middle | PEG | 14.6 | A1.5 | Upper, paracentral |
| L24 | PLLS, middle | None | 9.3 | A2 | Upper, paracentral |
| L23 | PLLS, middle | PMLS | 13.2 | A2 | Upper quadrant |
Distribution of label by cortical layer and cell counting
Cortical layers were identified according to orthodox criteria. The laminar distribution of labelled cells and terminals within each area was assessed by superimposing adjacent WGA-HRP-reacted with Nissl- or AChE-stained sections magnified to the same scale using the camera lucida. To quantify the laminar distribution of the labelled cells, counts were undertaken of every labelled neuron in each cortical area at regular, 1-in-8 section intervals, through the brain. Separate counts were made for the cells occupying the supragranular (II, III) and infragranular (V, VI) layers. This was aided by the Golgi-like filling of larger pyramidal cells at the lower border of layer III and in layer V of most cortical areas, and by the fact that very few cells were labelled in layer IV in any of them. Counting was performed under bright-field at × 10 magnification, although higher magnifications were occasionally used to resolve uncertainties. To increase reliability, five–six heavily labelled sections in each cat were recounted (by the same or a different observer), and further recounts undertaken for any areas in which the totals differed by more than 10% of the mean. The total number of labelled neurons and the proportion occupying the supragranular layers (%SG) in each cortical area was then computed for each cat.
These counts spanned the entire projection zone in each cortical area and typically produced totals of several 100 to a few 1000 neurons for the larger and/or more densely labelled ones, numbers that were considered sufficient to accurately represent their laminar connectivity pattern. However, two problems were encountered that required further counts. These were: (i) smaller/weakly labelled areas yielding low initial counts; and (ii) areas in which the laminar distribution of cell labelling showed local changes. Two factors contributed to this latter problem. For some areas, shifts in the laminar distribution (e.g. from mainly supragranular to mainly infragranular) were associated with changes in sulcal and gyral configurations between adjoining brain levels, whereas in others there was local variability even within the same section. This variability typically consisted of patchy regions of supragranular cell labelling sitting directly above continuous labelling of infragranular cells, as in the FB projections from LS cortex to area 17 in the cat (Shipp & Grant, 1991). To overcome these difficulties, further counts were undertaken on every available WGA-HRP section (i.e. at 1-in-2 intervals) through all areas that initially yielded total counts of <200 cells or discrepancies between some neighbouring sections. This ensured that the projection site from each area was sampled as representatively as possible. Despite this extra effort, the total count obtained from a few areas in each brain remained relatively low (e.g. <100 cells). These areas were generally the remotest from the injection site and varied from case to case, exceptions being the consistently low counts from areas 17 and 18 after PLLS injections.
Some of the subsequent analyses involved combining data from several PMLS (n = 5) and PLLS (n = 4) injection sites (Table 2). For these approaches we conservatively used median values to represent the pooled %SG data acquired from each labelled area across these cases, as this minimized the impact of individual ‘outliers’ on the results obtained.
Table 2.
Relative supragranular layer origin, %SG, and total cell counts (N) of projections to MSS cortex in each injected cat
| Area | 21a M11 %SG (N) | PMLS M03 %SG (N) | PMLS M19 %SG (N) | PMLS M17 %SG (N) | PMLS M15 %SG (N) | PMLS M01 %SG (N) | AMLS M04 %SG (N) | PLLS L12 %SG (N) | PLLS L21 %SG (N) | PLLS L24 %SG (N) | PLLS L23 %SG (N) |
|---|---|---|---|---|---|---|---|---|---|---|---|
| 17 | 84 (5932) | 92 (2350) | 96 (2392) | 93 (3557) | 87 (1961) | 93 (1518) | 85 (1478) | 97 (59) | 95 (56) | 89 (9) | 92 (112) |
| 18 | 79 (5939) | 82 (3265) | 94 (1332) | 89 (1995) | 86 (3629) | 90 (1535) | 80 (2186) | 93 (76) | 95 (123) | 86 (22) | 89 (835) |
| 19 | 57 (1807) | 55 (1773) | 51 (2249) | 49 (3065) | 45 (524) | 62 (1203) | 56 (2273) | 50 (697) | 59 (1524) | 50 (528) | 62 (1370) |
| 20a | 19 (6230) | 0 (212) | 2 (219) | 12 (853) | 17 (128) | 0 (36) | 9 (596) | 14 (107) | 22 (332) | 48 (491) | 6 (377) |
| 20b | 2 (184) | 0 (181) | – | 0 (286) | – | – | 0 (189) | 21 (34) | 9 (249) | 5 (294) | 0 (83) |
| PS | 0 (418) | 5 (141) | 4 (595) | 2 (918) | 0 (58) | 15 (1145) | 0 (38) | 9 (563) | 27 (2677) | 9 (501) | 5 (458) |
| ER | – | – | – | – | – | – | – | – | 0 (162) | 1 (144) | 13 (93) |
| 21a | 43 (618) | 54 (668) | 52 (323) | 60 (532) | 60 (109) | – | 52 (21) | 59 (323) | 53 (371) | 46 (443) | 46 (432) |
| 21b/VLS | 57 (218) | 51 (1260) | 44 (243) | 46 (868) | 40 (766) | 49 (514) | 49 (194) | 59 (3542) | 69 (5460) | 51 (1094) | 50 (2241) |
| PMLS | 29 (1684) | 46 (1491) | 53 (1075) | 50 (1753) | 54 (1184) | 51 (1094) | 76 (362) | 76 (779) | 50 (564) | 44 (306) | 48 (1032) |
| AMLS | 11 (212) | 31 (656) | 19 (332) | 27 (561) | 33 (438) | 45 (1287) | 54 (474) | 39 (82) | 44 (141) | 50 (12) | 30 (243) |
| DLS | – | – | – | – | – | – | – | – | 55 (686) | – | 49 (1119) |
| PLLS | 17 (312) | 28 (925) | 48 (247) | 20 (174) | 22 (218) | 21 (489) | 21 (814) | 53 (1202) | 50 (2219) | 47 (1388) | 46 (1294) |
| ALLS | – | 43 (105) | – | – | 30 (23) | 19 (203) | 49 (396) | – | 47 (79) | 29 (304) | 22 (818) |
| 7p | 13 (2625) | 30 (357) | 22 (473) | 22 (601) | 25 (507) | 55 (181) | 33 (522) | 22 (288) | 32 (1360) | 22 (1291) | 31 (876) |
| SVA | 13 (105) | – | – | – | – | 41 (64) | – | 19 (102) | – | – | 29 (306) |
| PCG | – | – | 3 (37) | 32 (152) | – | 33 (232) | 57 (830) | 26 (384) | 19 (117) | 18 (253) | 33 (321) |
| AEV | – | 16 (325) | 5 (19) | – | 9 (103) | 16 (257) | – | 20 (539) | 16 (1147) | 9 (734) | 12 (493) |
| Ins | – | – | – | – | – | – | – | – | 16 (458) | 14 (1379) | 0 (41) |
| Mean ± SEM | 32.6 ± 7.9 | 38.1 ± 7.5 | 37.8 ± 9.0 | 38.6 ± 8.2 | 39.1 ± 7.5 | 42.1 ± 7.4 | 44.4 ± 7.5 | 43.8 ± 7.4 | 42.1 ± 6.4 | 36.9 ± 6.3 | 31.9 ± 6.2 |
| (Total) | 26 284 | 13 709 | 9 536 | 15 315 | 9 648 | 9 758 | 10 373 | 8 777 | 17 735 | 9 193 | 12 544 |
Laminar projection origins: cluster analyses
The quantitative data on the %SG layer labelling in all cortical areas were entered into two types of cluster analyses designed to objectively determine whether discrete categories of laminar connectivity exist in the cat. Generally, these analyses group data points into clusters based on the similarities and dissimilarities (e.g. neighbourhood relations or distances) between them. By varying such grouping parameters one can gradually increase or decrease the size and composition of the resultant clusters between two extremes, from just one (all-inclusive) group at one extreme, to the separation of each data point into its own individual ‘cluster’ at the other. Our specific aims were to manipulate these parameters to produce clusters of intermediate size, in order to identify the most common groupings of the data points (i.e. individual %SG values).
We first applied a hierarchical cluster analysis (HCA) routine provided by the STATISTICA package (StatSoft, Tulsa, OK, USA), using a matrix of absolute pair-wise differences between the data points as the input to a weighted pair-group average algorithm. This method calculates the distance between clusters as the average distance between all data points in the different clusters, weighted by cluster size. Choice of this method was motivated by the fact that stable results are obtained for different shapes of candidate clusters, and so the algorithm imposes no assumptions about whether the data points should be equally or unequally distributed between suggested groupings. The solutions provided by HCA were verified by non-parametric cluster analysis (NPCA) of the same data, using the MODECLUS procedure of the SAS statistical software (SAS Institute). The NPCA identifies the proximity and grouping of data points by determining the spatial density distribution of the data in the coordinate space using kernels of fixed or variable radius. We used a range of different ‘interval of distance’ and ‘neighbourhood number’ parameters to compute clusters resulting from fixed and variable kernel radii, and compared the principal features of the commonest solutions. The NPCA methods are also capable of identifying groupings of unequal size, shape and/or dispersion, and thus impose no preconditions on the possible (e.g. discrete or gradual) cluster solutions.
Laminar projection variability: multidimensional scaling (MDS) analysis
We used MDS to assess the variability and similarity of laminar patterns resulting from injections in the same and different cortical areas. MDS is a versatile approach for representing high-dimensional data sets (e.g. injection sites characterized by the laminar patterns of their afferent projections) in lower- (typically two-) dimensional space (Cox & Cox, 1994). The algorithm arranges objects more closely together if they are more similar, and separates them if they are more dissimilar in their parameters. Here we used MDS to test if injections made in the same LS area in different cases were relatively more similar to each other compared with injections made in other LS areas. More specifically, the arrangement of injection sites in the MDS analysis allowed us to evaluate both the variability in the patterns of laminar projection produced by similar injections in different brains and the extent to which these patterns differed between injections located in different MSS areas.
Each of the 11 injections was characterized by the %SG origins of all projections to it, that is, by between 13 and 19 parameters per case (see Table 2). Pairwise similarities between the injections’ parameters were measured by squared Euclidean distances, which were submitted to the PROXSCAL routine of the SPSS software (v.11, SPSS, Chicago, IL, USA). Different types of proximity transforms (ratio, interval or ordinal) were explored for translating the injection similarities into two dimensions (see Fig. 8); all of them showed comparable and high goodness of fit (expressed as ‘normalized raw stress’).
Fig. 8.
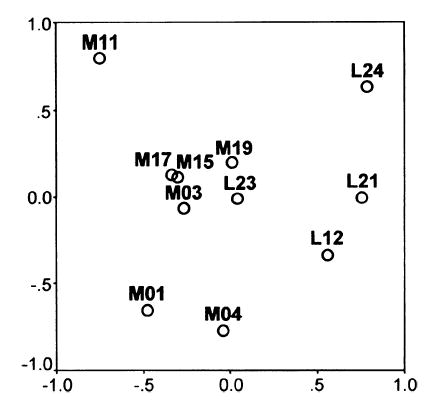
MDS representation of the relative similarity of MSS injections. Closer proximity of the data points in the diagram indicates greater similarity of the injections, in terms of the afferent laminar patterns produced by them. The shown configuration has a high goodness of fit in two dimensions, as indicated by a low normalized stress value of 0.03, and accounts for 97% of the data dispersion.
Local connectivity of MSS cortex: hierarchical analyses
Two methods of hierarchical analysis were used to examine the detailed connectional relations between the injected areas (21a, PMLS, AMLS, PLLS) of MSS cortex, based upon information about the origins of their reciprocal projections. The first, categorical method used the commonest classes of laminar projection origins suggested by HCA and NPCA as input to the same optimization technique previously used to compute global hierarchical orderings of areas in the cats’ visual cortex (Hilgetag et al., 2000a). The other approach was based on a graded definition of hierarchical connectivity. In this scheme (Barone et al., 2000; Hilgetag & Grant, 2001), 100% SG represents a ‘strictly FF’ projection, 0% SG is considered ‘strictly FB’, and intermediate values either side of strictly lateral (i.e. 50% SG) are either increasingly FF (51–99% SG) or increasingly FB (49–1% SG). This definition was also expressed by a hierarchy index, H, where H = %SG − 50. In this case, projections would be considered strictly lateral if their H-value equals 0%, whereas they become increasingly more FF or FB as their positive or negative index, H, approaches +50% or −50%, respectively. We applied a modified (weighted) version of the optimization procedure (Hilgetag et al., 2000a) to these graded parameters to rank the connections between each MSS area.
Results
Injection sites
The placement of the WGA-HRP injections in the 11 cats studied and the main visuotopic location of their connections in area 17 are summarized in Table 1. Four injections were made in different parts of area PMLS (including one in the area centralis representation in the lateral bank of the MSS), with one injection each in areas 21a and AMLS, and four in area PLLS. In the remaining case (M01), the injection site involved both PMLS and AMLS. Injection sites, as represented in Fig. 2, consisted of a dense core of reaction product extending the full thickness of the grey matter. In some cases there was visible spread of reaction product from the injection sites into an adjoining area (Table 1). As effective WGA-HRP uptake is known to be restricted to the zone immediately surrounding the actual ejection site in TMB-reacted material (Shook et al., 1984), it is unlikely that significant transport occurred from these latter regions (see below).
Fig. 2.
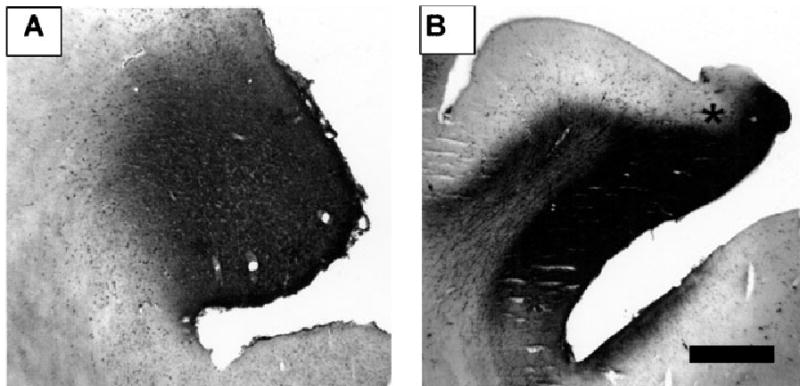
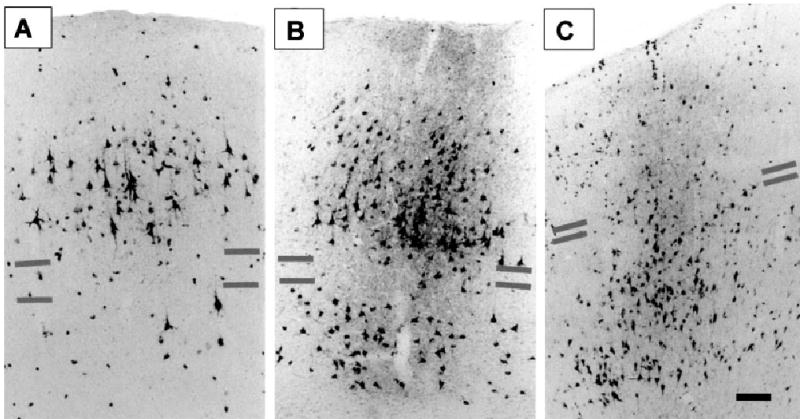
Examples of medial bank injection sites in (A) area PMLS (case M17) and (B) area AMLS (case M04). Asterisks denote the lighter zone of WGA-HRP diffusion either side of the dense reaction product at the core of the injection. Scale bar, 1 mm, and refers to both figures.
Cortical connectivity of the different MSS areas
Each injection resulted in widespread cortical cell and terminal labelling. As shown in Fig. 3, this labelling always involved area 17 along with most areas of extrastriate and visuo-limbic cortex, with consistently high concentrations of labelled neurons and terminals found in areas 19, 21b, VLS, PMLS, PLLS and 7p in all injected brains. As previously reported (Grant & Shipp, 1991; Hilgetag & Grant, 2000, 2001), the overall distribution and strength of the connections showed important similarities in the cases with injections of area 21a, PMLS or AMLS, but major differences with the four PLLS injected brains. Medial MSS areas (Fig. 3A–C) showed dense connections with areas 17 and 18, but very few labelled cells were present in these primary areas after PLLS injection (Fig. 3D). Conversely, area PLLS consistently showed relatively dense connections with more remote cortical areas (20b, PS, 35/36, AEV, Ins, pCG), most of which were unlabelled in some or all of the medial MSS injected brains.
Fig. 3.
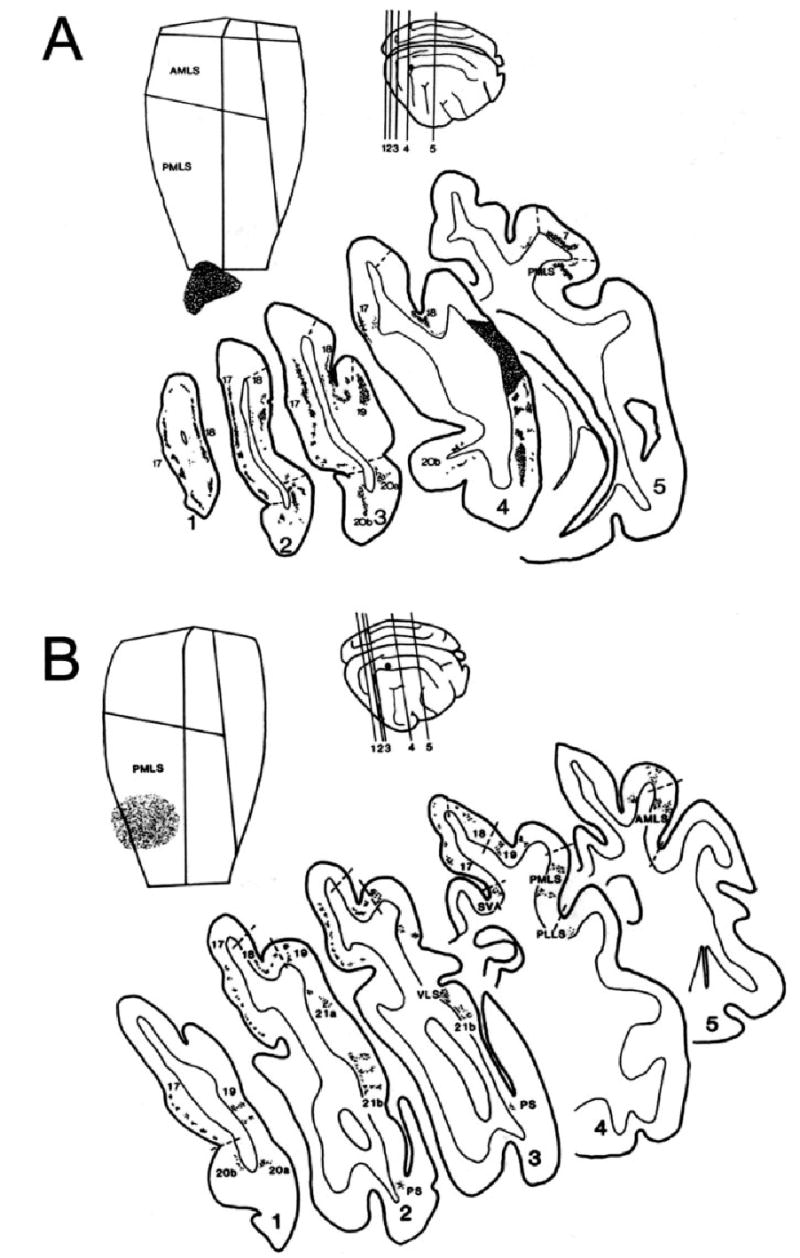
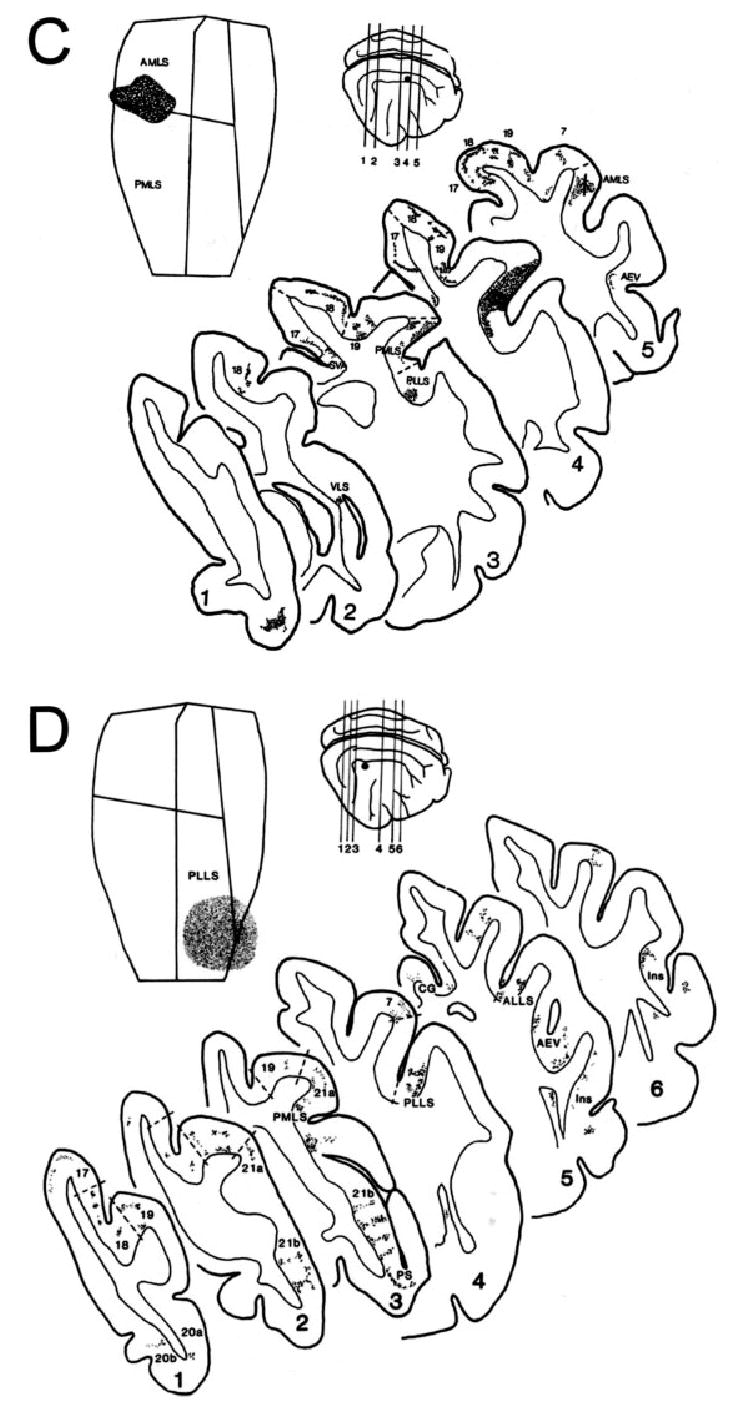
Connectivity patterns revealed by WGA-HRP injections into different regions of MSS cortex. Each figure shows (top left) a flattened view of the MSS depicting the location of the dense core of WGA-HRP reaction product at the injection site (stippled region) and (top right) a lateral view of the right cortex indicating its approximate position (single dot). The numbered lines on this lateral view correspond to the levels of the selected coronal sections illustrated in the larger diagrams below. In these, the distribution and relative densities of WGA-HRP-labelled cells are indicated for most of the cortical areas that were connected to the injected area. Borders (broken lines) between areas are only depicted as guides to the location of the cell labelling on either side. (A) Injection in area 21a (cat M11); (B) injection in posteromedial lateral suprasylvian area (PMLS, cat M17); (C) injection in anteromedial lateral suprasylvian area (AMLS, cat M04); (D) injection in posterolateral lateral suprasylvian area (PLLS, cat L21).
Within the LS complex, area PMLS showed consistently strong links with areas AMLS and PLLS, but connections between these two were more variable. It was also notable that every LS injection resulted in widespread columnar patches of labelled neurons and terminals within the injected area itself (Fig. 3B–D). As shown in Fig. 4, these patches extended away from the injection site and occupied farther regions of the injected area, suggesting that it arose via transport in both local and longer-range connections intrinsic to each LS subdivision.
Fig. 4.
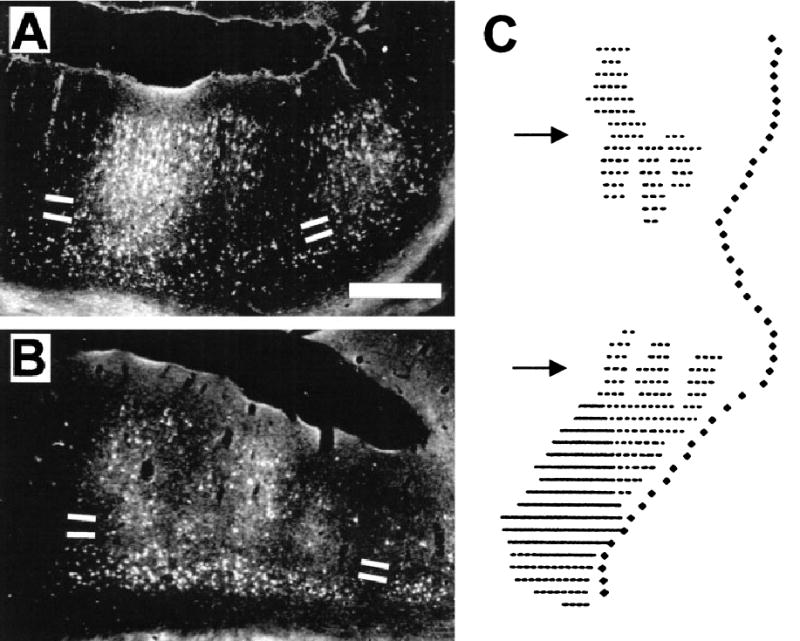
Dark-field photomicrographs (A) and (B) showing discontinuous, overlapping patches of WGA-HRP cell and terminal labelling in area PMLS following injection of the same area (case M19). The sections in (A) and (B) were taken, respectively, from a rostral region of this area and from a region adjoining the injection site. White bars indicate the upper and lower borders of layer IV. The fundus of the MSS (medially) is to the right; dorsal is uppermost. Scale bar, 0.5 mm, and refers to both sections. (C) Reconstruction of the complete distribution of cell label in area PMLS in the same case. The view represents the flattened medial bank cortex derived from a 1-in-4 series of sections through this region: medial is to the right; rostral is uppermost. Continuous lines represent the core of the injection site. Discontinuous dotted lines represent patches of cell labelling produced via transport in connections intrinsic to this area. These were plotted from large-scale drawings of each PMLS section with respect to a contour line running through the middle of layer IV. Each section is similarly aligned in the reconstruction via a marker representing the upper lip of the medial bank (laterally). Filled symbols (medially) represent the fundus of the MSS: upper and lower arrows show, respectively, the location of sections (A) and (B).
Laminar projection patterns: qualitative observations
Figure 3 also provides indications of the laminar distribution of the cells in most of the visual areas projecting to MSS cortex, many of which seem to conform to the FF, FB or L patterns. Figure 5 shows examples of each of these patterns of cell labelling in more detail and also illustrates the distributions of terminal labelling resulting from anterograde WGA-HRP transport from the injected area. Figure 5A shows the complementary pattern of reciprocal connectivity (in area 18) typically ascribed to a ‘lower’ processing level, with FF projections arising mainly from the supragranular layers and FB terminals mainly in layer I. Figure 5C shows the opposite pattern (in area 7p), indicative of a ‘higher’ processing level, with FF terminals from the injected MSS area concentrated in layers III and IV (and completely avoiding layer I) and FB projections arising mainly from infragranular layer cells. The intermediate pattern (in area 19) indicative of L interactions between same-level cortical areas is shown in Fig. 5B, with both labelled cells and terminals extending as a column through the cortical layers.
Fig. 5.
Photomicrographs showing the laminar distributions of WGA-HRP-labelled cells and terminals in different extrastriate areas. Grey bars indicate the upper and lower borders of layer IV. (A) Area 18, showing a forward projection originating mainly from supragranular layer cells, with feedback projections from LS cortex terminating in layer I (case M04). (B) Area 19, showing a lateral projection originating equally from the supragranular and infragranular layers, with terminations from LS cortex spanning all cortical layers (case M17). (C) Area 7p, showing a feedback projection originating mainly from the infragranular layers, with terminations from LS cortex targeting layers III and IV, in the region of some labelled supragranular neurons contributing to the feedback projection (case L24). Scale bar, 0.5 mm, and refers to all figures.
Several factors complicate the identification of just three laminar connectivity classes from these qualitative observations. First, FB projections from some areas appear to originate almost exclusively from infragranular cells (e.g. area 20b; Fig. 3), while those from others had a substantial supragranular layer component (e.g. area 7p; Fig. 5B), raising the possibility that the two arrangements represent discrete projection classes. Second, in the latter (mixed) cases, patches of supragranular and infragranular cell labelling densities sometimes seemed similar, thus blurring the distinction with what appears to be a separate L connectivity class. It was for these reasons that we undertook to quantify the laminar projection origins.
Three laminar projection origins revealed by objective cluster analyses
We counted a total of 143,042 identified projection neurons in the 11 cats. The total count for each cortical area in these animals and their laminar distribution, expressed as %SG, are given in Table 2 and are also shown in the scatter-plots of Fig. 6A, along with the pooled data obtained from all 163 projections examined. It can be seen that a wide range of %SG cell labelling densities (from <15% to >90%) was present in each individual cat, with little evidence that they segregated into any well-defined classes. In the pooled data, however, the eye is lead to two ‘gaps’ in the values obtained – prominently between 33 and 39% SG, and between 62 and 79% SG – suggesting that there may be discrete groupings of projection origins either side of these missing values. The histogram of Fig. 6B appears to confirm this, by suggesting a tri-modal distribution of %SG origins in the pooled data. However, whether the non-normal distribution of values obtained between 0 and 33% SG indicates further subdivisions within this apparently single class remains unclear.
Fig. 6.
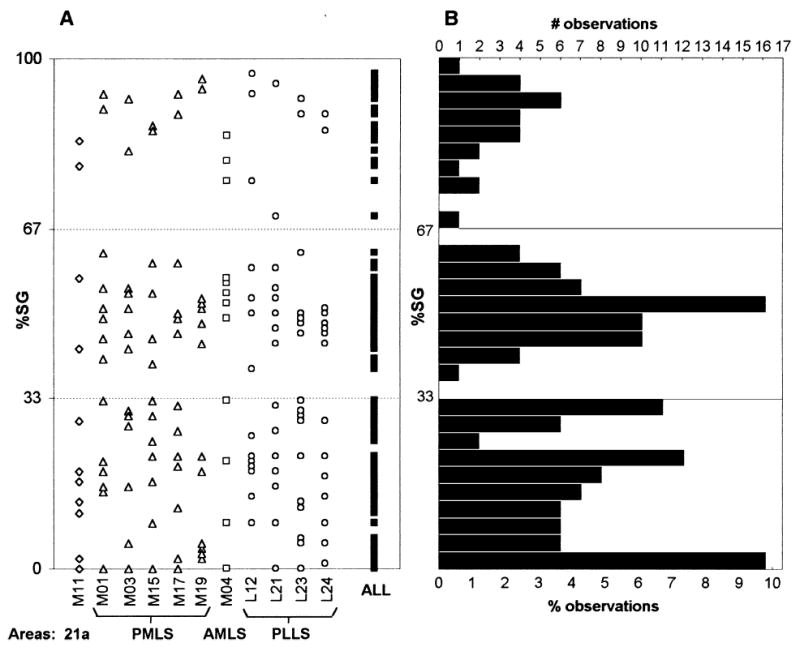
(A) Scatter plots and (B) histogram showing the relative distribution of cell labelling in the supragranular layers (%SG) in each cortical area in each cat and across all 11 cases. (A) The columns of symbols, from left to right, represent the %SG values for each projection quantified in the individual cases, with the pooled data shown on the far right (ALL). Cases corresponding to injections in the same area are shown with identical symbols. (B) The number and percentage of observations represents those obtained from the pooled values of %SG, plotted at consecutive bin widths of 3.33%.
Because definitive groupings cannot be established from simple inspection, segregation of the data was examined objectively using cluster analyses. In the HCA procedure, all %SG data points were grouped parametrically by descending linkage distance, and their gradual separation from a single cluster embracing all data points into a large number of finer groupings was captured by the ‘cluster tree’ shown in Fig. 7. This shows that the %SG groupings initially separated into two and then into three principal clusters. Two of these clusters (on the left) persisted over a similarly wide interval of relative linkage distances (20–30), while the third (on the right) disintegrated more quickly at a shorter linkage interval (< 15). Once the data segregated into more than four clusters (at a relative linkage distance of about 30), they became increasingly unstable, breaking rapidly into many small subcomponents and finally into the individual data points. This picture suggested a likely segregation of %SG values into a small number of clusters, of just two, three or four main groups. The two-cluster solution grouped the data around a cut-off value of 67% SG, while the three-cluster solution subdivided values <67% SG into two further groups with a cut-off at 37% SG. In other words, the two-cluster solution lumped together connections that appear qualitatively to be either FB or L into a single class, whereas the three-cluster solution split them into separate categories.
Fig. 7.
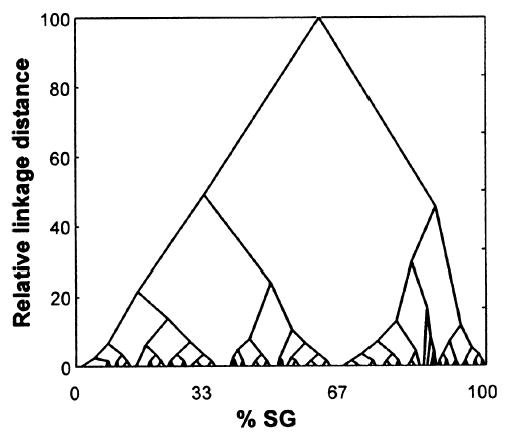
Tree diagram showing the results of a HCA for all individual %SG patterns. Proximity among the %SG data points was assessed on the basis of the patterns’ pair-wise dissimilarity (absolute differences) matrix. Individual data points and clusters were joined using the weighted pair-group averaging method in the STATISTICA software. The vertical axis of the diagram denotes the relative linkage distance, an indication of the parameter scale at which particular clusters join or split up. On the coarsest scale (top) all data points are joined into a single big cluster; at the highest resolution (bottom) clusters split up into individual data points. Sections parallel to the horizontal axis indicate the number and composition of clusters corresponding to each particular linkage distance. Existence of particular groupings over a wide linkage distance demonstrates greater stability or ‘likelihood’ of that configuration.
To probe these suggested groupings further, we applied NPCA to the same data using a wide range (n = 20) of values for the radius parameter, R, which defines the spatial extent of the clusters (from all-embracing to very narrow). This resulted in different solutions ranging from a single cluster to a large number of smaller ones, as with the HCA. However, by far the most common single fraction of intermediate solutions (7/18, 39%) was formed by arrangements consisting of three clusters, with the alternative two-cluster arrangement suggested by HCA among the least likely solutions (2/18, 11%). The three-clusters suggested by NPCA had similar boundaries to those suggested by the HCA. These were: for Cluster 1, 100–76% SG; for Cluster 2, 69–39% SG; and for Cluster 3, 33–0% SG. These boundaries are those most evident in the pooled scatter-plot and histogram of Fig. 6, and in the cluster tree of Fig. 7. We did also examine the possibility that there might be consistent relationships between the boundaries indicated by HCA and NPCA for larger (i.e. ≥ 4) cluster numbers, but these comparisons showed little agreement between the two methods. Thus, informal inspection of the pooled %SG data and both clustering algorithms applied to them converge on the same three classes of laminar projection origins.
Range and variability of laminar (%SG) labelling
The range of %SG labelling values obtained within-cases and, occasionally, between similar cases for the same area (e.g. from 20 to 48% SG in area PLLS after PMLS injections, Table 2) raises two concerns over the application of these algorithms. The first is that variability in the core size or possible spread of the injections (Table 1) contributed significantly to the spectrum of %SG values obtained. To examine this, we used MDS to contrast the relative similarity of injections in the same area in different cases with the similarity of laminar patterns produced by injections in different areas. This analysis showed (Fig. 8) a generally clear separation between medial and lateral bank injections, with the medial MSS cases further separated according to the area and visual field representation injected: that is, the four caudal area PMLS injections were grouped together at values intermediate to those of case M11 (area 21a, upper field) and cases M01 and M04 (rostral area PMLS and AMLS, lower field). In fact, the arrangement in Fig. 8 bears a close resemblance to the spatial layout of the injections in the cortex, with lateral bank cases on one side, medial cases on the other, and an overall caudal-to-rostral progression from top-to-bottom for the medial bank sites. Moreover, the groupings shown are almost identical to those revealed by previous cluster analyses of the relative strengths of the cortical projections to the same 11 injections (Hilgetag & Grant, 2000). Thus, both the laminar and non-laminar projection patterns were strikingly invariant for injections made at similar MSS locations – regardless of apparent tracer size or spread – while differing for injections made in different cortical areas, as would be expected. The exception to this was case L23, in which the laminar pattern (Fig. 8) – but not the connection strength – was closer to ‘neighbouring’ medial rather than lateral cases, suggesting that there may have been some effective uptake from area PMLS in this brain.
The second concern is that the three distinct clusters observed after pooling resulted, by chance, from unequal sampling of a relatively limited number of data points (n = 163 individual projections) from across a continuous spectrum. To test this possibility, we repeated the NPCA procedure for 20 randomly generated samples of 163 values of %SG, ranging from 0 to 100%, using Monte-Carlo simulation. Each of these random samples produced large numbers of clusters, but none resulted in a systematic trend towards small cluster numbers, as in the pooled experimental data. In view of these outcomes, we conclude that the three laminar classes specified above by HCA and NPCA represent the optimal description of our data, and note their close relationship to the origins of the three projection patterns shown in Fig. 5A–C.
Global and local hierarchical connectivity of the cat MSS cortex
We used these objective criteria to categorize the projections from each labelled area to MSS cortex in each of the 11 cats as FF, L or FB (Table 3 and Fig. 9). For areas PMLS and PLLS that were injected in several cases, these assignments were identical for the majority of cortical areas projecting to them, but there were also some discrepancies. For example, the projection from area PLLS was FB to PMLS (17–28% SG) in the majority of cases, but was L in cat M19 (48% SG). Minority assignments such as this are given in parentheses in Table 3. As in the cited example, such assignments always involved a single case of disagreement between neighbouring classes (i.e. L vs. FB) and mainly involved connectivity within the LS complex. Looking at the global connectivity of MSS cortex, it can be seen that all four injected areas receive FF projections from areas 17 and 18, L projections from areas 19 and 21b/VLS, and FB projections from areas 20a, 20b, PS and 7p. In addition, the projections (when present) are generally FB from areas AEV, Ins, SVA and pCG. These findings are consistent with a hierarchical outflow of visual information away from the primary areas that diverges widely from the MSS to several higher areas in ventral inferotemporal (IT), dorsal posterior parietal (PP), and various visuo-limbic cortices.
Table 3.
Laminar classes of projection origin between areas of cat visual cortex
| To area:
|
||||
|---|---|---|---|---|
| From area | 21a | PMLS | AMLS | PLLS |
| 17 | FF | FF | FF | FF |
| 18 | FF | FF | FF | FF |
| 19 | L | L | L | L |
| 20a | FB | FB | FB | FB(L) |
| 20b | FB | FB | FB | FB |
| PS | FB | FB | FB | FB |
| ER | – | – | – | FB |
| 21a | L | L | L | L |
| 21b/VLS | L | L | L | L |
| PMLS | FB | L | FF | L (FB) |
| AMLS | FB | FB (L) | L | L (FB) |
| DLS | – | – | – | L |
| PLLS | FB | FB (L) | FB | L |
| ALLS | – | FB (L) | L | FB (L) |
| 7p | FB | FB | FB | FB |
| SVA | FB | FB (L) | – | FB |
| pCG | – | FB | L | FB |
| AEV | – | FB | – | FB |
| Ins | – | – | – | FB |
Fig. 9.
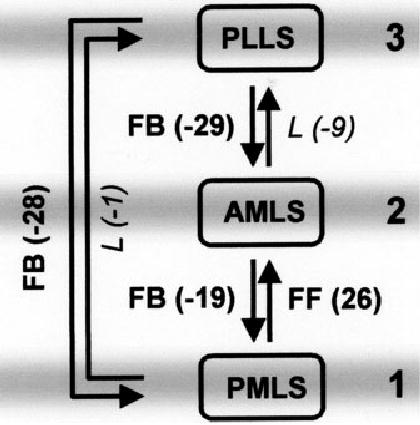
Unique optimal hierarchy of LS cortical areas based on categorical and graded quantitative data for laminar projection origins. Large numbers (1–3) on the right correspond to the three levels of the hierarchy (also indicated by grey bars). The FF, L and FB labels next to each arrow denote the categorical feedforward, lateral or feedback character of the projections, as derived from the clustering of all %SG values into three distinct groups. Numbers in brackets provide the hierarchical index H (with H = %SG − 50), which quantitatively describes the graded hierarchical character of the projections (based on median values of %SG in different cases). Larger positive H-values indicate a more pronounced feedforward and smaller negative H-values a more pronounced feedback character of projections. (In a hierarchical arrangement, FF connections should project from a lower to a higher hierarchical level, and FB connections from higher to lower levels.) The shown hierarchy is optimal for the categorical as well as for the graded laminar patterns, in the sense that only a minimal number of categorical patterns is misarranged [the two L-pattern projections from posteromedial lateral suprasylvian area (PMLS) and anteromedial lateral suprasylvian area (AMLS) to posterolateral lateral suprasylvian area (PLLS)], and that the sum of the H-values assigned to the wrong direction of projections is minimal (concerning the same two projections to PLLS). Labels and H-values belonging to the misaligned projections are shown in italics. Computational analysis verified that any other arrangement would lead to a larger number of misarranged categorical projection patterns (i.e. more than two) and to a greater sum of mismatched H-values (i.e. larger than 10).
Hierarchical relations between the injected LS areas were more formally examined using two methods of hierarchical analysis. In the categorical approach, the objectively defined FF, FB and L projection classes were used as constraints in the optimization protocol. In the graded approach, only connections with exactly 50% SG origins were treated as L and all other projections with either increasing or decreasing SG layer contributions (i.e. from 51 to 100% or from 49 to 0%) were classed and analysed as slightly to-strictly FF or FB. For areas PMLS and PLLS these constraints were based on the median %SG labelling obtained across cases for each projection (Tables 2 and 3), in order to reduce the influence of minority data points, such as those mentioned above. The results of both analyses were identical in suggesting the same, optimal, hierarchical relationship between the three injected LS areas. This unique solution is shown in Fig. 9, with areas PMLS, AMLS and PLLS representing the lowest, intermediate and highest levels, respectively, in the sequence of motion-processing LS areas.
Discussion
Neuroanatomical studies of cortical connectivity have identified several key organizing principles underlying data transfer in this complex system. Foremost among these are elements of hierarchical, clustered and distributed parallel processing (Zeki & Shipp, 1988; Felleman & Van Essen, 1991; Young, 1992; Bullier & Nowak, 1995; Scannell et al., 1995; Lamme et al., 1998; Hilgetag et al., 2000b), with sets of cortical areas further bound into familial groups by shared thalamic inputs (Rauschecker, 1988; Scannell et al., 1999). In focusing here on the laminar origins of projections to and within the LS complex of the cat, our purpose was to seek definitive evidence for one of these organizing principles and to gain a better understanding of how motion information may be distributed in this particular species. It should be understood that much of the following discussion is both informed by our philosophical prejudice (we are ‘lumpers’, rather than ‘splitters’) and hindered by a lack of information about the function of cortical areas beyond the main striate projection fields (areas 18, 19, 21a, LS) in the cat.
Our initial requirement was to verify which of its 20 visual cortical areas are connected to the LS complex. The answer seems to be most or all of them (Fig. 3, Table 2). This broadly agrees with previous findings (Symonds & Rosenquist, 1984a; Sherk, 1986a; MacNeil et al., 1997), although some additional extrastriate areas have been identified since the earlier studies and so were not included in their connectional surveys. From qualitative observations of combined retrograde and anterograde WGA-HRP transport, it was also possible to discern the three reciprocal laminar patterns that underpin hierarchical cortical models (e.g. Felleman & Van Essen, 1991). That is, different cortical areas seemed to contain either: (1) FF projection cells combined with FB terminals (Fig. 5A); or (2) FF terminals with FB projection cells (Fig. 5C); or (3) L patterns of both cells and terminals (Figs 4 and 5B). In using WGA-HRP on its own, it can be difficult to distinguish genuine terminal label from that residing in the fragmented distal dendrites and/or axon collaterals of labelled projection neurons in the area examined. This problem mainly affects the L pattern in which labelled cells and terminals substantially overlap, so whether the latter were more concentrated in a particular layer (e.g. IV) from one area to another could not be determined with certainty. Changes in cortical curvature accompanied by a local patchiness of labelled supragranular layer projection cells posed further difficulties for unequivocally determining, by inspection alone, whether the L and FB classes were actually distinct.
Three classes of laminar projection origins
By quantifying the %SG layer origin of all the projections present in our material and combining this with different types of cluster analyses, the present study provides the first objective evidence for the existence of three distinct classes of laminar projection origins in the mammalian visual cortex. In doing this we tried to obtain counts from large numbers of labelled cells from the entire projection field in each cortical area, so cutting across any changes in their local distribution or in cortical curvature that might have produced misleading results (see Barone et al., 2000; Vezoli et al., 2004). Despite increasing the section sampling frequency to 1-in-2 for certain projections with low labelling densities, total cell counts for some of them (~ 10%) remained relatively low (< 100 cells, Table 2). However, versions of the HCA and NPCA that we conducted with these less reliable data excluded yielded similar outcomes to those that we report.
The data points entered into these analyses came from 163 individual projections to injection sites placed in different functional areas of MSS cortex and at various visual field locations. Despite this variability in injection placement, the overall laminar patterns of their cortical connections were very similar (Table 2), and cross-correlation analysis of the %SG origins from each site yielded highly significant correlations (average r = 0.89, P < 0.01) for all of them (data not shown). MDS analysis (Fig. 8) further showed that the laminar %SG densities obtained were most similar for injections involving equivalent visuotopic locations in the same area (e.g. cases M03, M19, M15, M17), and revealed subtle differences between the laminar projection patterns to different MSS areas. These findings are important for two reasons. First, the highly reproducible patterns of %SG labelling across all projection sources to similar locations in different cats attest to the reliability of the laminar data obtained. Second, by producing groupings that were essentially identical to those seen before in relation to their overall connection strengths (Hilgetag & Grant, 2000), they suggest that patterns of both laminar and non-laminar projections to different MSS areas co-vary in a consistent manner.
The ‘hybrid’ PMLS/AMLS injection case (M01) is of interest in this context in that, in both analyses, it most resembled the AMLS injection (case M04) and was most different from the area 21a (case M11) and rostral PLLS (case L24) injections. The two anterior medial bank injections occupied very similar lower visual quadrant representations, whereas cases M11 and L24 mainly involved the upper quadrant. Subtle differences in %SG labelling have been reported for projections to macaque area V5/MT coming from the central vs. peripheral field representation within area 17/V1 (Falchier et al., 2000). No such central–peripheral differences were evident in our data. For instance, the injections in cases M03 and M17 produced almost identical laminar and non-laminar projection patterns (Fig. 8, Hilgetag & Grant, 2000) despite their involvement of the area centralis and horizontal periphery, respectively (Table 1). Differences in the projection patterns between the lower vs. upper quadrant cases could, however, be related to the fact that several areas of cat extrastriate cortex over-represent one or other of these quadrants (Tusa et al., 1981; Updyke, 1986) and may have differential projections to MSS areas with like vs. dissimilar visuotopic organizations. Further work is required to settle this issue.
The injected MSS areas represent intermediate levels of the global hierarchy of cat visual cortex (Felleman & Van Essen, 1991; Hilgetag et al., 2000a). A major advantage of this is that they each receive a range of FF, L and FB projections, allowing us to objectively test for clusters across a broad continuum of %SG values. It is notable, however, that only a few individual areas contributed to the ≥ 76% SG (FF) data points available for this analysis compared with the other two classes. To mitigate this problem, we specifically selected types of HCA and NPCA that work well for unevenly dispersed data sets and that make no a priori assumptions about the optimal cluster shapes or distributions. The smaller number of data points in the ≥ 76% category should not therefore have materially affected their results. We found that the majority of solutions produced by both methods pointed to three groupings around the same %SG boundaries, with two-cluster solutions and any larger (≥ 4) groupings forming less reliable outcomes. We also compared the outcomes of the HCA and NPCA with the results of Monte-Carlo simulations performed by clustering random sets of equivalent, but continuously distributed, data points and we found that the latter never produced solutions consisting of a small number (< 10) of clusters. We are confident therefore that projections with %SG layer origins of ≥ 76%, 69–39% and ≤ 33% define three distinct classes of cortical connectivity in the cat, at least in relation to areas of MSS cortex. It might, nonetheless, be worthwhile to extend the current analyses to injections made in ‘higher’ areas of cat cortex, in order to obtain quantitative data that includes a greater sample of FF projection origins (see below).
Laminar projection classes: comparisons with previous studies in cat and monkey
We and others have previously reported that the projections from area 17 to areas 21a, PMLS and AMLS originate mainly (~ 90%) from supragranular layers and that their return projections possess only a small (~ 20%) supragranular layer component (Symonds & Rosenquist, 1984a; Sherk, 1986a; Shipp & Grant, 1991; Conway et al., 2000). These values of %SG fall within the range of the FF and FB classes defined in the present study. Previous qualitative studies have also reported that all subareas of LS cortex send predominantly FF projections to all of those higher areas in which we present consistent and objective evidence of FB projections in the opposite direction (Table 3). This suggests that the two-way connections between LS and areas 20a, 20b, PS (Cavada & Reinoso-Suárez, 1983), 7p (Olson & Lawler, 1987), AEV, Ins (Mucke et al., 1982; Guldin & Markowitsch, 1984; Reinoso-Suárez & Roda, 1985) and pCG (Olson & Musil, 1992) conform to the FF–FB reciprocal rule as well.
Our definition of just three laminar projection classes in the cat appears to conflict with the findings of Symonds & Rosenquist (1984b). These authors did not lump the labelled cells they counted by supragranular vs. infragranular origin, as we did, but recorded their relative numbers in each lamina for every projection that they quantified. They concluded that projections from each area of extrastriate cortex have unique laminar origins, with differential involvements of layers II, III, V and VI, which depend upon the specific functional circuits to which the area contributes. We have two comments about this. First, inspection of their data indicates that had they not split the upper (II, III) and lower (V, VI) layers into their subcomponents, but had computed only the %SG labelling, then most of the projections would clearly have fallen within the range of %SG values comprising the graded FF, L and FB classes that we have defined. Second, while many of their cell counts were relatively low and thus may not have truly reflected the laminar origin of the projections in question, their main conclusion about the existence of specialized laminar circuits is, nonetheless, a valid one.
This is attested to by compelling qualitative evidence that not all FF or FB projections in the cats’ visual cortex are the same. Even for area 17 it is clear that separate populations of supragranular layer neurons send projections to different extrastriate areas (18, 19, 21a or LS), with FB from these areas also ending on different sets of cells outside layer IV in striate cortex (Bullier et al., 1984; Einstein & Fitzpatrick, 1991; Henry et al., 1991; Shipp & Grant, 1991; Conway et al., 2000). Moreover, the supragranular neurons sending FF projections to each of these extrastriate targets are distributed across area 17 as regularly spaced bands or patches that show different correspondences with the ‘blobs’ of cytochrome oxidase-rich cells in the upper layers (Bullier et al., 1984; Shipp & Grant, 1991; Boyd & Matsubara, 1999; Conway et al., 2000). These are anatomical hallmarks of parallel outflow from striate cortex, and probably contribute to the specializations of ‘ventral stream’ areas 19 and 21a for aspects of form perception (Duysens et al., 1982; Saito et al., 1988; Dinse & Kruger, 1990; Dreher et al., 1996; Lomber, 2001), and of the LS complex for ‘dorsal stream’ functions such as visual motion-processing, spatial attention and limb-placing behaviours (Spear & Baumann, 1975; Spear et al., 1983; Rauschecker et al., 1987; von Grünau et al., 1987; Hardy & Stein, 1988; Pasternak et al., 1989; Grant & Shipp, 1991; Lomber, 2001; Sherk & Fowler, 2002). There is every reason to believe therefore that subtle differences exist in the precise contribution of cells in each cortical layer to the FF, FB and L projections between extrastriate areas in the cat, as Symonds & Rosenquist (1984b) concluded 20 years ago.
We found a similarly wide range of %SG layer origins to that reported by Barone et al. (2000) in their recent quantitative studies of cortical projections to areas 17/V1 and V4 in the macaque. They proposed that this range of %SG contributions reflects a gradual and continuous metric of the differences in hierarchical rank between interconnected areas. Barone et al. (2000) did not formally examine whether the apparent continuum of %SG values they obtained were actually discontinuous. Nonetheless, their conceptual framework may also be applied to the graded distribution of %SG values that we obtained within each of the three laminar connection classes, and would suggest, for instance, that connections in the FB class having the lowest %SG contributions (e.g. < 15%) cross more levels (‘hierarchical distance’), in projecting from hierarchically high to very much lower cortical areas, than those in the FB class with higher %SG origins (e.g. 20–33%).
Motion processing complexes in cat and monkey extrastriate cortex
In this context, we re-examined the hierarchical structure of the motion areas of the LS complex based on our quantitative data for their reciprocal connectivity patterns. Both the categorical and graded approaches used revealed the same optimal unique ranking, in which areas PMLS, AMLS and PLLS are connected in a FF–FB sequence (Fig. 9). This scheme disagrees with previous meta-analyses derived mainly from qualitative studies in the cat (Felleman & Van Essen, 1991; Hilgetag et al., 2000a), both of which placed area PLLS at a lower level than AMLS and one of which placed areas PLLS and PMLS on the same level (Felleman & Van Essen, 1991). A body of physiological evidence supports our revised scheme. Area PMLS, at the lowest level of the sequence, seems to be an all-purpose motion processor: it contains a complete mixture of cells showing velocity-selective responses to relatively simple stimuli (such as moving spots, bars and edges), as well as cells that respond to more complex motions, including texture, optic flow and motion-in-depth stimuli (Spear & Baumann, 1975; Hamada, 1987; Rauschecker et al., 1987; Toyama et al., 1990; Grant & Shipp, 1991; Sherk et al., 1995). Areas AMLS and PLLS, by contrast, contain cells with larger receptive fields that are more concerned with analysing the motion of complex stimuli over wide regions of the visual scene, and they exhibit a higher level of functional specialization than PMLS: for three dimensional, radial optic flow and component-pattern motion in area AMLS (Toyama et al., 1990; Ouelette et al., 2004); and for figure–ground phase interactions in area PLLS (von Grünau et al., 1987).
A problem encountered with the categorical method was that it produced more constraint violations than the graded approach. These violations arose because of some mismatches in the reciprocal laminar projections between areas, with FB connections in one direction accompanied by the generally problematic L class forming the other component of the two-way link. We say generally problematic, because similar mismatches involving this class exist among previous reports on LS cortical connectivity (Symonds & Rosenquist, 1984b; Sherk, 1986a), contributing to the disagreements between earlier ranking schemes for the LS complex, and they are also common to reports of macaque cortical connectivity, especially between dorsal stream visual areas (Felleman & Van Essen, 1991; Hilgetag et al., 1996, 2000a). Our quantitative data suggest that such mismatches may be genuine features of LS cortex, but raise the question of why this might be so. A problem with the graded approach was that it is not entirely compatible with the hierarchical ‘distance’ rule of Barone et al. (2000). For example, the median H index for the FB connection from area PLLS to PMLS is less negative (−28) than that from area AMLS to PMLS (−19), suggesting that it crosses fewer hierarchical ranks (Fig. 9).
One possible explanation for these difficulties is that connections within the LS complex are structurally and functionally heterogeneous. Another new finding of the present study is that each LS area contains a dense network of ‘patchy’ intrinsic connections (Figs 3 and 4) that always conform to the L projection class (Tables 2 and 3). This suggests a requirement within each LS area for widespread integration of activity, as envisaged for the ‘perceptual binding’ role of L-type connections between cortical areas with different functional specialities (e.g. Maunsell & Van Essen, 1983; Felleman & Van Essen, 1991; Lamme et al., 1998). This requirement may arise because of the inhomogeneity of the LS areas, as manifest by the discontinuous nature of their thalamic, cortical and trans-callosal inputs (Symonds & Rosenquist, 1984a; Segraves & Innocenti, 1985; Sherk, 1986b; Shipp & Grant, 1991; MacNeil et al., 1997), and by the regional clustering of cells with differing functional properties within them (Rauschecker et al., 1987; Sherk et al., 1995). One can therefore envisage the need for a dual arrangement of extrinsic connections between LS areas: one (FF–FB) related to the different levels (simple–complex) of motion analysis that they undertake; and the other (L–L) required for binding their specialized analyses of different types of visual motion. If this dual system of projections was discontinuously distributed within each LS area – as would be true to form – our injections may have targeted one class more than the other, resulting in the mixed laminar classes obtained even for the same projection (Table 3). Further studies of local LS connectivity will be required to critically evaluate this.
Other possibilities are that hierarchical ordering applies more to ‘global’ than to ‘local’ cortical connectivity, or that laminar projection patterns may actually obey other structuring principles. One such alternative principle, originally proposed by Barbas (1986), is the difference in the level of cytoarchitectural differentiation between interconnected cortical areas. This ‘structural’ hypothesis predicts that the larger the architectural level difference between areas, the more extreme will be the supragranular layer contributions to their reciprocal FF (highest %SG) and FB (lowest %SG) connectivity, and quantitative data obtained for projections of monkey prefrontal cortex support this idea (Barbas, 1986; Barbas & Rempel-Clower, 1997). Inspection of Table 2 indicates that this ‘structural’ rule might apply to our data. For example, the FB projections to each injected LS area with lowest %SG layer origins (< 15%) came mainly from poorly differentiated cortical areas, such as 20b, ER and Ins, whereas those with consistently higher %SG contributions (20–33%) came mostly from adjoining and structurally similar areas of MSS cortex. We are currently investigating more formally whether the ‘hierarchical distance’ or ‘structural’ model best explains the distribution of %SG values in our data.
Finally, the present study was motivated, in part, by an interest in comparing the organization of the motion-processing complexes in cat LS and monkey STS cortex. Our results show a unidirectional ranking of PMLS–AMLS–PLLS projections analogous to the V5/MT–medial superior temporal area (MST)–floor of superior temporal sulcus area (FST) sequence of macaque motion areas consistently suggested by both informal and computational meta-analyses (Felleman & Van Essen, 1991; Hilgetag et al., 1996, 2000a). Such comparisons are often discussed with respect to homology: that is, whether similar structures in different species owe their similarity to the fact that they evolved from a common ancestor. A strong case has been argued, based on the position and functional organization of area PMLS, that it resembles macaque area V5/MT sufficiently that the two could be homologous (Zeki, 1974; Payne, 1993). It may be misguided, however, to seek homology between every LS and STS area, as such an exercise can only be carried out to an extent commensurate with the level of organization that existed in the common ancestor, which judging by their closest living descendants – simple insectivores – was probably extremely rudimentary (Krubitzer et al., 1997).
There are, nonetheless, a number of interesting additional similarities between the second and third ranked areas of the two motion hierarchies. At the second level, areas AMLS and MST receive substantial FF projections from area 17/V1, although mainly from its representation of the lower periphery (Fig. 3C; Grant & Shipp, 1991; Boussaoud et al., 1990), and both areas show similar functional specializations for three-dimensional motion and optic flow. Indeed, these properties of area MST cells have been linked to a special role in directional heading during locomotion (Roy et al., 1992; Lagae et al., 1994; Britten & van Wezel, 1998), aspects of potential area AMLS function (Sherk & Fowler, 2002) commensurate with its analogous functional specializations and over-representation of the visual field at ground level discussed above. On the third level, areas PLLS and FST receive only weak inputs from the central visual representation of striate cortex (Fig. 3D; Grant & Shipp, 1991; Barone et al., 2000), and both areas have particularly dense and widespread FF–FB links with ‘poly sensory’ cortical regions in or adjacent to insular cortex (i.e. cat areas AEV and Ins, Fig. 3D; Hilgetag & Grant, 2000; macaque area anterior (polysensory) superior temporal sulcus (STSa), Boussaoud et al., 1990; Young, 1992). While there have been few studies of the functional properties of cells in areas PLLS or FST, it is known that the STSa region contains cells selective for particular types of biological motion, such as walking (Bruce et al., 1981) and, anecdotally, we have recorded from cells in PLLS that only respond to particular walking directions (Grant & Shipp, personal communication).
While a more informative assessment of the analogies between areas AMLS–MST and PLLS–FST clearly requires further work, the similar connectional hierarchies of the LS and STS complexes suggest that they represent convergent organizational solutions to cortical visual motion analysis. The two complexes also have direct FF–FB connections with both ventral (IT) and dorsal (PP) stream areas. However, whereas in the monkey each STS area contributes projections to a number of different PP areas (Maunsell & Van Essen, 1983; Desimone & Ungerleider, 1986; Boussaoud et al., 1990), the only dorsal stream projections that we could identify from the cat LS complex were all to area 7p (Fig. 3; Olson & Lawler, 1987). Aside from pronounced saccade-related activity (Komatsu et al., 1983), little is known about the functions of area 7p (Lomber, 2001) or whether it contains any subdivisions. For the moment, then, the main organizational difference between the two motion complexes appears to be the expanded output from macaque STS to further specialized areas of PP cortex – probably reflecting their greater repertoire of visuomotor (e.g. prehension) skills – a further enlargement of which continues in the more evolved PP cortex of humans (Van Essen et al., 2001; Astafiev et al., 2003).
Acknowledgments
This work was supported by independent grants from The Wellcome Trust to each author. We thank Stewart Shipp for helpful discussions, Robert Taylor for contributions to the cell counting, and Nadia Sachs for assistance with the figures.
References
- Astafiev SV, Shulman GL, Stanley CM, Snyder AZ, Van Essen DC. Functional organization of human intraparietal and frontal cortex for attending, looking, and pointing. J Neurosci. 2003;23:4689–4699. doi: 10.1523/JNEUROSCI.23-11-04689.2003. [DOI] [PMC free article] [PubMed] [Google Scholar]
- Barbas H. Pattern in the laminar origin of corticocortical connections. J Comp Neurol. 1986;252:415–422. doi: 10.1002/cne.902520310. [DOI] [PubMed] [Google Scholar]
- Barbas H, Rempel-Clower N. Cortical structure predicts the pattern of corticocortical connections. Cereb Cortex. 1997;7:635–646. doi: 10.1093/cercor/7.7.635. [DOI] [PubMed] [Google Scholar]
- Barone P, Batardiere A, Knoblauch K, Kennedy H. Laminar distribution of neurons in extrastriate areas projecting to visual area V1 and V4 correlates with the hierarchical rank and indicates the operation of a distance rule. J Neurosci. 2000;20:3263–3281. doi: 10.1523/JNEUROSCI.20-09-03263.2000. [DOI] [PMC free article] [PubMed] [Google Scholar]
- Boussaoud D, Ungerleider LG, Desimone R. Pathways for motion analysis: cortical connections of the medial superior temporal and fundus of the superior temporal visual areas in the macaque. J Comp Neurol. 1990;296:462–495. doi: 10.1002/cne.902960311. [DOI] [PubMed] [Google Scholar]
- Boyd JD, Matsubara JA. Projections from V1 to lateral suprasylvian cortex: an efferent pathway in the cat’s visual cortex that originates preferentially from CO Blob columns. Vis Neurosci. 1999;16:849–860. doi: 10.1017/s0952523899165052. [DOI] [PubMed] [Google Scholar]
- Britten KH, van Wezel RJA. Electrical microstimulation of cortical area MST biases heading perception in monkeys. Nat Neurosci. 1998;1:59–63. doi: 10.1038/259. [DOI] [PubMed] [Google Scholar]
- Bruce CJ, Desimone R, Gross CG. Visual properties of neurons in a polysensory area in superior temporal sulcus of the macaque. J Neurophysiol. 1981;46:369–384. doi: 10.1152/jn.1981.46.2.369. [DOI] [PubMed] [Google Scholar]
- Bullier J, Kennedy H, Salinger W. Branching and laminar origin of projections between visual cortical areas in the cat. J Comp Neurol. 1984;228:329–341. doi: 10.1002/cne.902280304. [DOI] [PubMed] [Google Scholar]
- Bullier J, Nowak LG. Parallel versus serial processing: new vista on the distributed organization of the visual system. Curr Opin Neurobiol. 1995;5:497–503. doi: 10.1016/0959-4388(95)80011-5. [DOI] [PubMed] [Google Scholar]
- Cavada C, Reinoso-Suárez F. Afferent connections of area 20 in the cat studied by means of the retrograde axonal transport of horseradish peroxidase. Brain Res. 1983;270:319–324. doi: 10.1016/0006-8993(83)90606-6. [DOI] [PubMed] [Google Scholar]
- Conway B, Boyd JD, Stewart TH, Matsubara JA. The projection from V1 to extrastriate area 21a: a second patchy efferent pathway that colocalizes with the CO blob columns in cat visual cortex. Cereb Cortex. 2000;10:149–159. doi: 10.1093/cercor/10.2.149. [DOI] [PubMed] [Google Scholar]
- Cox, F. & Cox, M.A.A. (1994) Multidimensional Scaling. Chapman & Hall, London.
- Desimone R, Ungerleider LG. Multiple visual areas in the caudal superior temporal sulcus of the macaque. J Comp Neurol. 1986;248:164–189. doi: 10.1002/cne.902480203. [DOI] [PMC free article] [PubMed] [Google Scholar]
- Dinse HR, Kruger K. Contribution of area 19 to the foreground–background interaction of the cat: an analysis based on single cell recordings and behavioural experiments. Exp Brain Res. 1990;82:107–122. doi: 10.1007/BF00230843. [DOI] [PubMed] [Google Scholar]
- Dreher B, Wang C, Turlejski KJ, Djavadian RL, Burke W. Areas PMLS and 21a of cat visual cortex: two functionally distinct areas. Cereb Cortex. 1996;6:585–599. doi: 10.1093/cercor/6.4.585. [DOI] [PubMed] [Google Scholar]
- Duysens J, Orban GA, Van der Glas HW, De Zegher FE. Functional properties of area 19 as compared to area 17 of the cat. Brain Res. 1982;231:279–291. doi: 10.1016/0006-8993(82)90366-3. [DOI] [PubMed] [Google Scholar]
- Einstein G, Fitzpatrick D. Distributions and morphology of area 17 neurons that project to the cat’s extrastriate cortex. J Comp Neurol. 1991;303:132–149. doi: 10.1002/cne.903030112. [DOI] [PubMed] [Google Scholar]
- Falchier A, Barone P, Kennedy H. Eccentricity and cortical architecture. Eur J Neurosci. 2000;12 (Suppl 11):286. [Google Scholar]
- Felleman DJ, Van Essen DC. Distributed hierarchical processing in the primate cerebral cortex. Cereb Cortex. 1991;1:1–47. doi: 10.1093/cercor/1.1.1-a. [DOI] [PubMed] [Google Scholar]
- Grant S, Shipp S. Visuotopic organization of the lateral suprasylvian area and of an adjacent area of the ectosylvian gyrus of cat cortex: a physiological and connectional study. Vis Neurosci. 1991;6:315–338. doi: 10.1017/s0952523800006568. [DOI] [PubMed] [Google Scholar]
- von Grünau MW, Zumbroich TJ, Poulin C. Visual receptive field properties in the posterior suprasylvian cortex of the cat: a comparison between the areas PMLS and PLLS. Vis Res. 1987;27:343–356. doi: 10.1016/0042-6989(87)90083-6. [DOI] [PubMed] [Google Scholar]
- Guldin WO, Markowitsch HJ. Cortical and thalamic afferent connections of the insular and adjacent cortex of the cat. J Comp Neurol. 1984;229:393–418. doi: 10.1002/cne.902290309. [DOI] [PubMed] [Google Scholar]
- Hamada T. Neural responses to the motion of textures in the lateral suprasylvian area of cats. Behav Brain Res. 1987;25:175–185. doi: 10.1016/0166-4328(87)90066-0. [DOI] [PubMed] [Google Scholar]
- Hardy SC, Stein BE. Small lateral suprasylvian cortex lesions produce visual neglect and decreased visual activity in the superior colliculus. J Comp Neurol. 1988;273:527–542. doi: 10.1002/cne.902730408. [DOI] [PubMed] [Google Scholar]
- Henry GH, Salin PA, Bullier J. Projections from areas 18 and 19 to cat striate cortex: divergence and laminar specificity. Eur J Neurosci. 1991;3:186–200. doi: 10.1111/j.1460-9568.1991.tb00079.x. [DOI] [PubMed] [Google Scholar]
- Hilgetag CC, Burns GAPC, O’Neill MA, Scannell JW, Young MP. Anatomical connectivity defines the organization of clusters of cortical areas in macaque monkey and cat. Phil Trans Roy Soc Lond B. 2000b;355:91–110. doi: 10.1098/rstb.2000.0551. [DOI] [PMC free article] [PubMed] [Google Scholar]
- Hilgetag CC, Grant S. Uniformity, specificity and variability of corticocortical connectivity. Phil Trans Roy Soc Lond B. 2000;355:7–29. doi: 10.1098/rstb.2000.0546. [DOI] [PMC free article] [PubMed] [Google Scholar]
- Hilgetag CC, Grant S. Uniformity and specificity of long-range corticocortical connections in the visual cortex of the cat. Neurocomputing. 2001;38–40:667–673. [Google Scholar]
- Hilgetag CC, O’Neill MA, Young MP. Indeterminate organization of the visual system. Science. 1996;271:776–777. doi: 10.1126/science.271.5250.776. [DOI] [PubMed] [Google Scholar]
- Hilgetag CC, O’Neill MA, Young MP. Hierarchical organization of macaque and cat cortical sensory systems explored with a novel network processor. Phil Trans Proc Roy Soc Lond B. 2000a;355:71–89. doi: 10.1098/rstb.2000.0550. [DOI] [PMC free article] [PubMed] [Google Scholar]
- Kalia M, Whitteridge D. The visual areas in the splenial visual sulcus of the cat. J Physiol (Lond) 1973;232:275–283. doi: 10.1113/jphysiol.1973.sp010269. [DOI] [PMC free article] [PubMed] [Google Scholar]
- Komatsu Y, Shibuki K, Toyama K. Eye movement related activities in cells of the lateral suprasylvian cortex of the cat. Neurosci Lett. 1983;41:271–276. doi: 10.1016/0304-3940(83)90462-7. [DOI] [PubMed] [Google Scholar]
- Krubitzer L, Kunzle H, Kaas J. Organization of sensory cortex in a Madagascan insectivore, the tenrec (Echinops telfairi) J Comp Neurol. 1997;379:399–414. [PubMed] [Google Scholar]
- Lagae L, Maes H, Raigeul S, Xiao DK, Orban GA. Responses of macaque STS neurons to optic flow components: a comparison of areas MT and MST. J Neurophysiol. 1994;71:1597–1626. doi: 10.1152/jn.1994.71.5.1597. [DOI] [PubMed] [Google Scholar]
- Lamme VAF, Super H, Spekreijse H. Feedforward, horizontal and feedback processing in the visual cortex. Curr Opin Neurobiol. 1998;8:529–535. doi: 10.1016/s0959-4388(98)80042-1. [DOI] [PubMed] [Google Scholar]
- Lomber SG. Behavioural cartography of visual functions in cat parietal cortex: areal and laminar dissociations. Prog Brain Res. 2001;134:265–284. doi: 10.1016/s0079-6123(01)34018-9. [DOI] [PubMed] [Google Scholar]
- MacNeil MA, Lomber SG, Payne BR. Thalamic and cortical projections to middle suprasylvian cortex of cats: constancy and variability. Exp Brain Res. 1997;114:24–32. doi: 10.1007/pl00005620. [DOI] [PubMed] [Google Scholar]
- Maunsell JHR, Van Essen DC. The connections of the middle temporal visual area (MT) and the relationship to a cortical hierarchy in the macaque monkey. J Neurosci. 1983;3:2563–2586. doi: 10.1523/JNEUROSCI.03-12-02563.1983. [DOI] [PMC free article] [PubMed] [Google Scholar]
- Mucke L, Norita M, Benedek G, Creutzfeldt O. Physiologic and anatomic investigation of visual cortical area situated in the ventral bank of the anterior ectosylvian sulcus of the cat. Exp Brain Res. 1982;179:1–11. doi: 10.1007/BF00238092. [DOI] [PubMed] [Google Scholar]
- Olson CR, Lawler K. Cortical and subcortical afferent connections of a posterior division of feline area 7 (Area 7p) J Comp Neurol. 1987;259:13–30. doi: 10.1002/cne.902590103. [DOI] [PubMed] [Google Scholar]
- Olson CR, Musil SY. Topographic organization of cortical and subcortical projections to posterior cingulated cortex in the cat: Evidence for somatic, ocular, and complex subregions. J Comp Neurol. 1992;324:237–260. doi: 10.1002/cne.903240207. [DOI] [PubMed] [Google Scholar]
- Otsuka R, Hassler R. Uber aufbau und gliederung der corticalen sehsphare bei der katze. Arch Psychiat Nervenkrank. 1962;203:212–234. doi: 10.1007/BF00352744. [DOI] [PubMed] [Google Scholar]
- Ouelette BG, Minville K, Faubert J, Casanova C. Simple and complex visual motion response properties in the anterior medial bank of the lateral suprasylvian cortex. Neuroscience. 2004;123:231–245. doi: 10.1016/j.neuroscience.2003.09.002. [DOI] [PubMed] [Google Scholar]
- Palmer LA, Rosenquist AC, Tusa RJ. The retinotopic organization of lateral suprasylvian visual areas in the cat. J Comp Neurol. 1978;177:237–256. doi: 10.1002/cne.901770205. [DOI] [PubMed] [Google Scholar]
- Pasternak T, Horn KM, Maunsell JHR. Deficits in speed discrimination following lesions of the lateral suprasylvian cortex in the cat. Vis Neurosci. 1989;3:365–375. doi: 10.1017/s0952523800005538. [DOI] [PubMed] [Google Scholar]
- Payne BR. Evidence for visual cortical area homologs in cat and macaque monkey. Cereb Cortex. 1993;3:1–25. doi: 10.1093/cercor/3.1.1. [DOI] [PubMed] [Google Scholar]
- Rauschecker, J.P. (1988) Visual function of the cat’s LP/LS subsystem in global motion processing. In Hicks, T.P. & Benedek, G. (Eds), Progress in Brain Research, Vol. 75 Elsevier Science, Amsterdam, pp. 95–108. [DOI] [PubMed]
- Rauschecker JP, von Grünau MW, Poulin C. Centrifugal organization of direction preferences in the cat’s lateral suprasylvian visual cortex and its relation to flow field processing. J Neurosci. 1987;7:943–958. doi: 10.1523/JNEUROSCI.07-04-00943.1987. [DOI] [PMC free article] [PubMed] [Google Scholar]
- Reinoso-Suárez F, Roda JM. Topographical organization of the cortical afferent connections of the cortex of the anterior ectosylvian sulcus in the cat. Exp Brain Res. 1985;59:313–324. doi: 10.1007/BF00230911. [DOI] [PubMed] [Google Scholar]
- Rockland KS, Pandya DN. Laminar origins and terminations of cortical connections of the occipital lobe in the rhesus monkey. Brain Res. 1979;179:3–20. doi: 10.1016/0006-8993(79)90485-2. [DOI] [PubMed] [Google Scholar]
- Roy JP, Komatsu H, Wurtz RH. Disparity sensitivity of neurons in monkey extrastriate area MST. J Neurosci. 1992;12:2478–2492. doi: 10.1523/JNEUROSCI.12-07-02478.1992. [DOI] [PMC free article] [PubMed] [Google Scholar]
- Saito H, Tanaka K, Fukuda Y, Oyamada H. Analysis of discontinuity in visual contours in area 19 of the cat. J Neurosci. 1988;8:1131–1143. doi: 10.1523/JNEUROSCI.08-04-01131.1988. [DOI] [PMC free article] [PubMed] [Google Scholar]
- Scannell JW, Blakemore C, Young MP. Analysis of connectivity in the cat cerebral cortex. J Neurosci. 1995;15:1463–1483. doi: 10.1523/JNEUROSCI.15-02-01463.1995. [DOI] [PMC free article] [PubMed] [Google Scholar]
- Scannell JW, Burns GAPC, Hilgetag CC, O’Neil MA, Young MP. The connectional organization of the cortico-thalamic system of the cat. Cereb Cortex. 1999;9:277–299. doi: 10.1093/cercor/9.3.277. [DOI] [PubMed] [Google Scholar]
- Segraves MA, Innocenti GM. Comparison of the distributions of ipsilaterally and contralaterally projecting corticocortical neurons in cat visual cortex using two fluorescent tracers. J Neurosci. 1985;8:2107–2118. doi: 10.1523/JNEUROSCI.05-08-02107.1985. [DOI] [PMC free article] [PubMed] [Google Scholar]
- Sherk H. Location and connections of visual cortical areas in the cat’s suprasylvian sulcus. J Comp Neurol. 1986a;247:1–31. doi: 10.1002/cne.902470102. [DOI] [PubMed] [Google Scholar]
- Sherk H. Coincidence of patchy inputs from the lateral geniculate complex and area 17 to the cat’s Clare-Bishop area. J Comp Neurol. 1986b;253:105–120. doi: 10.1002/cne.902530109. [DOI] [PubMed] [Google Scholar]
- Sherk H, Fowler GA. Lesions of extrastriate cortex and consequences for visual guidance during locomotion. Exp Brain Res. 2002;144:159–171. doi: 10.1007/s00221-002-1027-7. [DOI] [PubMed] [Google Scholar]
- Sherk H, Kim JN, Mulligan K. Are the preferred directions of neurons in cat extrastriate cortex related to optic flow? Vis Neurosci. 1995;12:887–894. doi: 10.1017/s0952523800009445. [DOI] [PubMed] [Google Scholar]
- Shipp S, Grant S. Organization of reciprocal connections between area 17 and the lateral suprasylvian area of cat visual cortex. Vis Neurosci. 1991;6:339–355. doi: 10.1017/s095252380000657x. [DOI] [PubMed] [Google Scholar]
- Shook BL, Abramson BP, Chalupa LM. An analysis of the transport of WGA-HRP in the cat’s visual system. J Neurosci Meth. 1984;11:65–77. doi: 10.1016/0165-0270(84)90026-8. [DOI] [PubMed] [Google Scholar]
- Spear PD, Baumann TP. Receptive-field characteristics of single neurons in lateral suprasylvian visual area of the cat. J Neurophysiol. 1975;38:1404–1419. doi: 10.1152/jn.1975.38.6.1403. [DOI] [PubMed] [Google Scholar]
- Spear PD, Miller S, Ohman L. Effects of lateral suprasylvian visual cortex lesions on visual localization, discrimination, and attention in cats. Behav Brain Res. 1983;10:339–359. doi: 10.1016/0166-4328(83)90039-6. [DOI] [PubMed] [Google Scholar]
- Symonds LL, Rosenquist AC. Corticocortical connections among the visual areas in the cat. J Comp Neurol. 1984a;229:1–38. doi: 10.1002/cne.902290103. [DOI] [PubMed] [Google Scholar]
- Symonds LL, Rosenquist AC. Laminar origins of visual cortico-cortical connections in the cat. J Comp Neurol. 1984b;229:39–47. doi: 10.1002/cne.902290104. [DOI] [PubMed] [Google Scholar]
- Toyama K, Fujii K, Umetani K. Functional differentiation between the anterior and posterior Clare-Bishop cortex of the cat. Exp Brain Res. 1990;81:221–233. doi: 10.1007/BF00228111. [DOI] [PubMed] [Google Scholar]
- Tusa, R.J., Palmer, L.A. & Rosenquist, A.C. (1981) Multiple cortical visual areas: visual field topography in the cat. In Woolsey, C.N. (Ed.), Cortical Sensory Organization, Vol. 2 Multiple Visual Areas. Humana Press, New Jersey, pp. 1–31.
- Updyke BV. Retinotopic organization within the cat’s posterior suprasylvian sulcus and gyrus. J Comp Neurol. 1986;216:265–280. doi: 10.1002/cne.902460210. [DOI] [PubMed] [Google Scholar]
- Van Essen DC, Lewis JW, Drury HA, Hadjikhani N, Tootell RB, Bakiricioglu M, Miller MI. Mapping visual cortex in monkeys and humans using surface-based atlases. Vis Res. 2001;41:1359–1378. doi: 10.1016/s0042-6989(01)00045-1. [DOI] [PubMed] [Google Scholar]
- Vezoli J, Falchier A, Jouve B, Knoblauch K, Young MP, Kennedy H. Quantitative analysis of connectivity in the visual cortex: extracting function from structure. Neuroscientist. 2004;10:476–482. doi: 10.1177/1073858404268478. [DOI] [PubMed] [Google Scholar]
- Young MP. Objective analysis of the topological organization of the primate cortical visual system. Nature. 1992;358:152–155. doi: 10.1038/358152a0. [DOI] [PubMed] [Google Scholar]
- Zeki S. Functional organization of a visual area in the posterior bank of the superior temporal sulcus of the Rhesus monkey. J Physiol (Lond) 1974;236:549–573. doi: 10.1113/jphysiol.1974.sp010452. [DOI] [PMC free article] [PubMed] [Google Scholar]
- Zeki S, Shipp S. The functional logic of cortical connections. Nature. 1988;335:311–317. doi: 10.1038/335311a0. [DOI] [PubMed] [Google Scholar]